Copyright
©The Author(s) 2023.
World J Exp Med. Dec 20, 2023; 13(5): 142-155
Published online Dec 20, 2023. doi: 10.5493/wjem.v13.i5.142
Published online Dec 20, 2023. doi: 10.5493/wjem.v13.i5.142
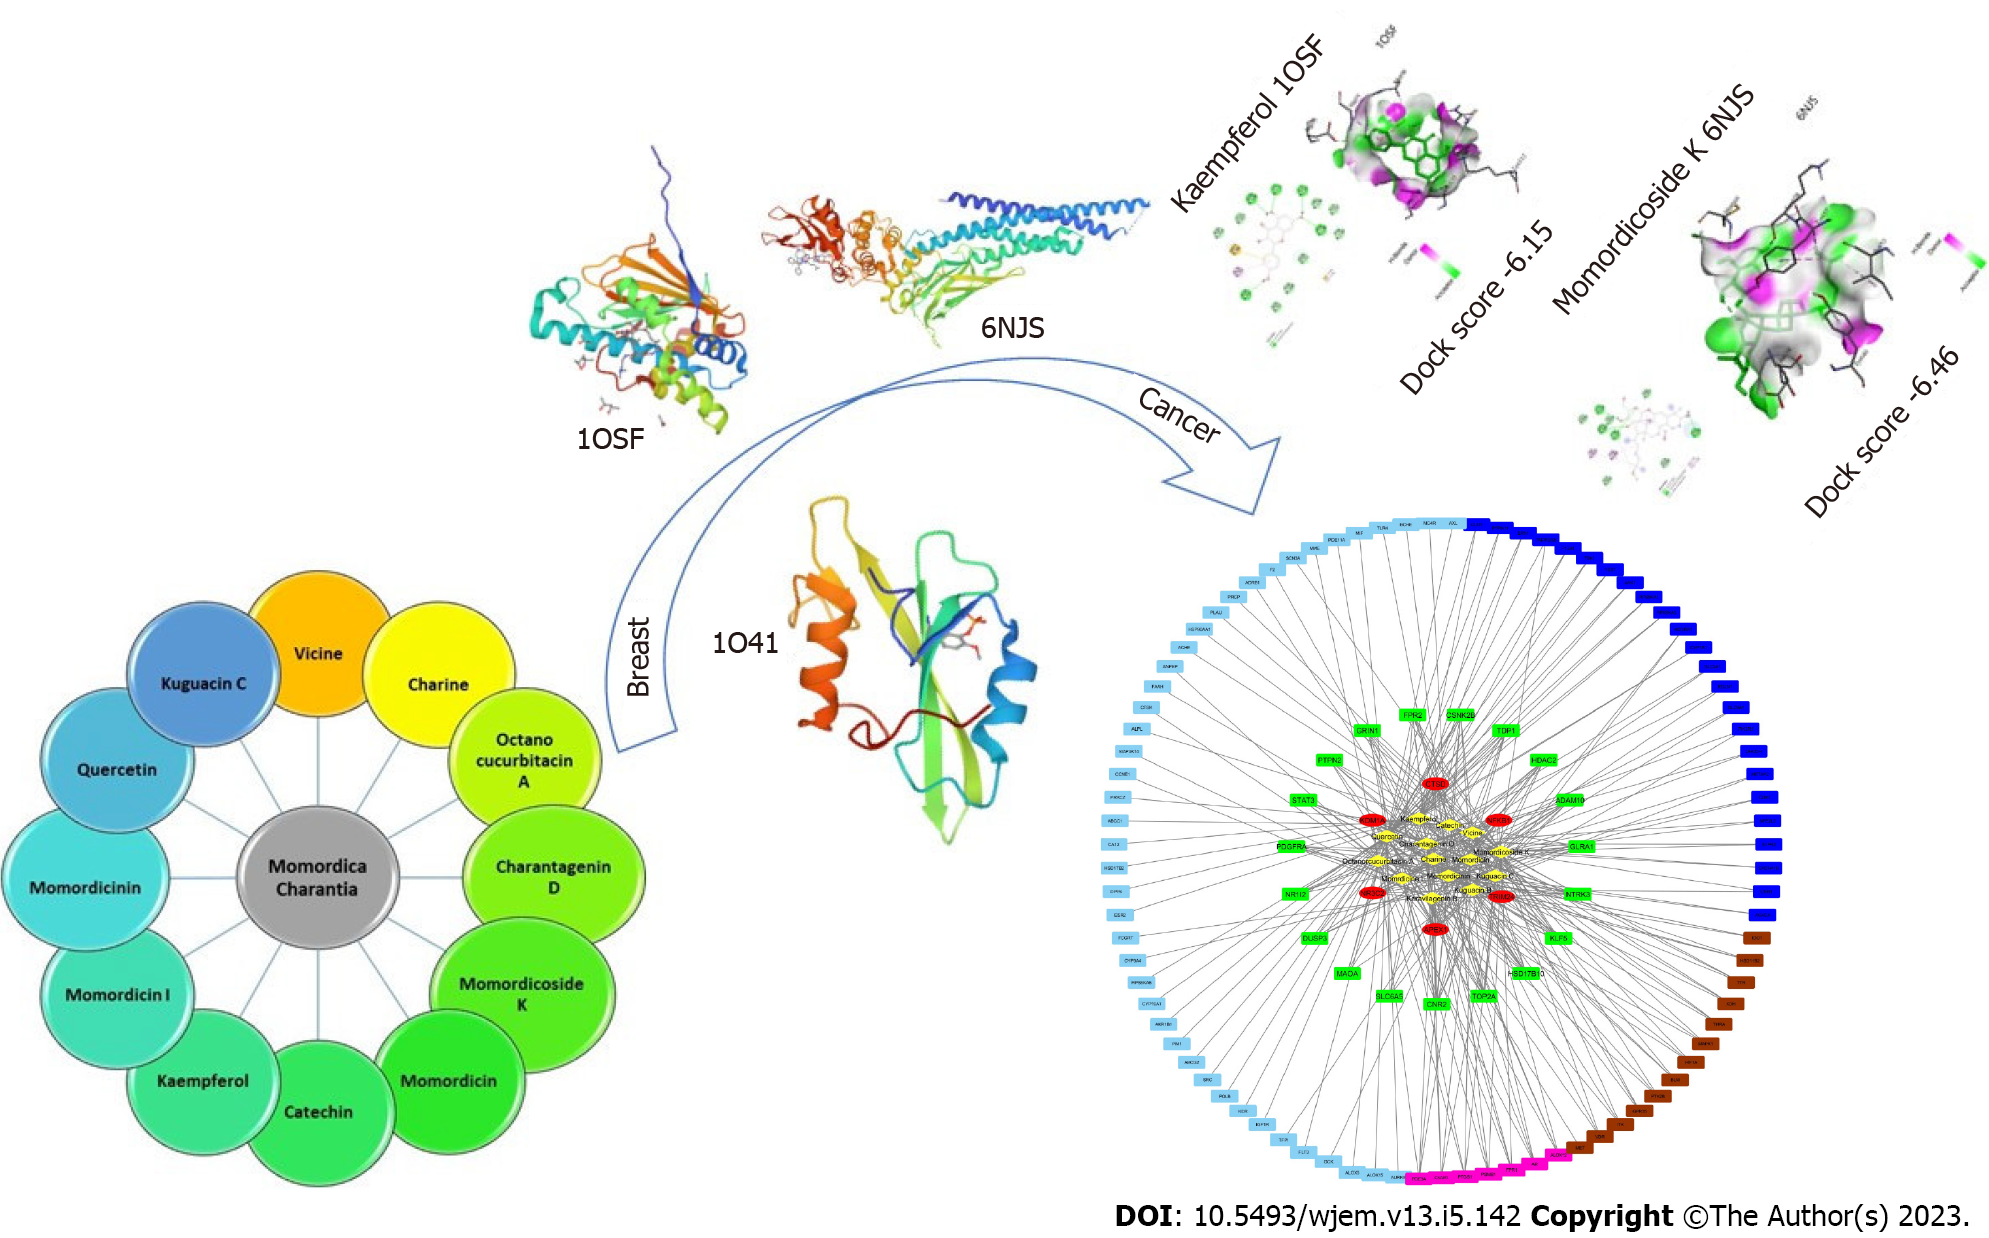
Figure 1 Graphical abstract.
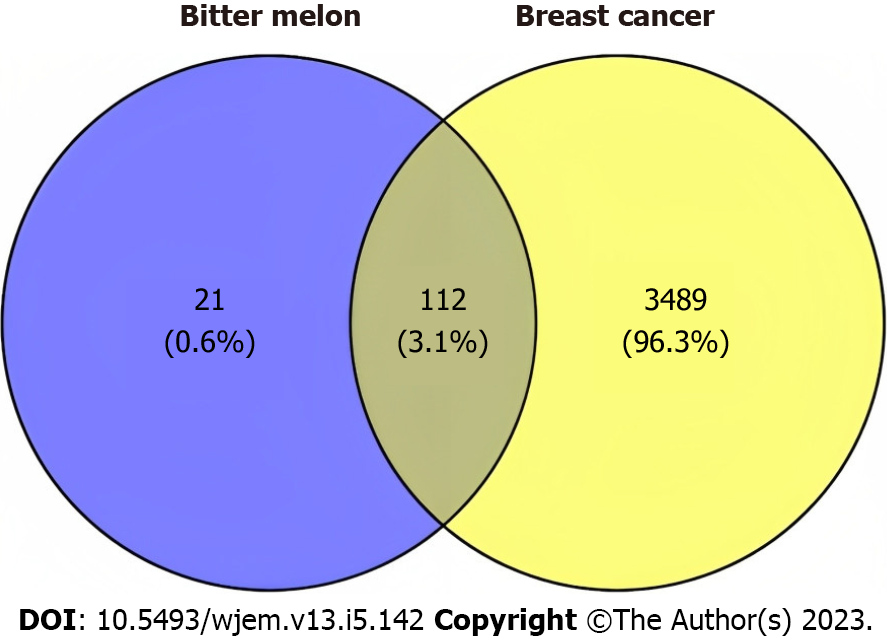
Figure 2 Venn diagram of targets of bitter melon and breast cancer where blue color indicates targets of bitter melon while yellow color indicates targets of breast cancer.
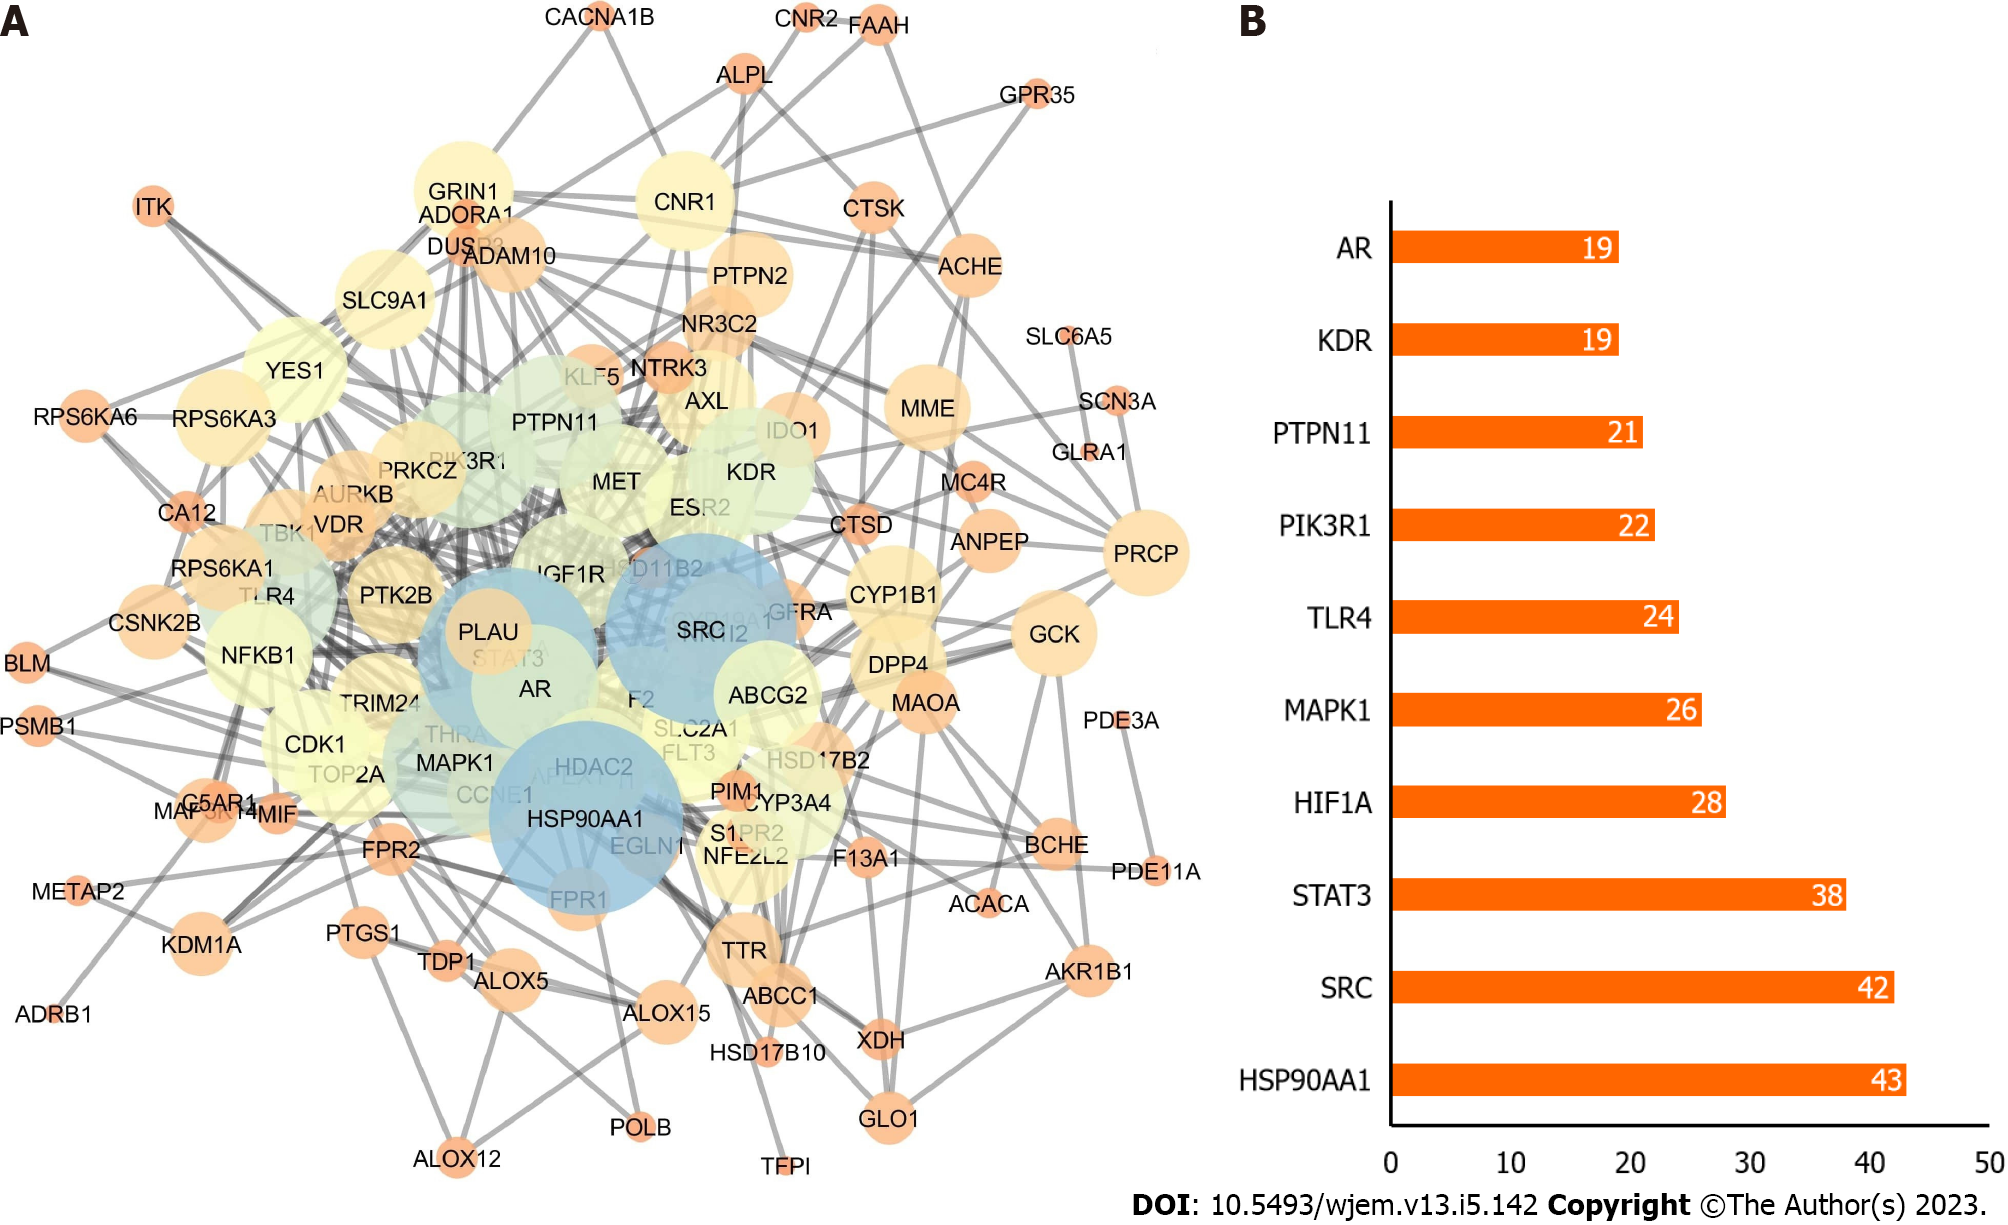
Figure 3 Potential targets.
A: Protein-protein interaction network; B: Bar chart of the top 10 genes according to degree where X-axis is the degree value, and the Y-axis is the gene name.
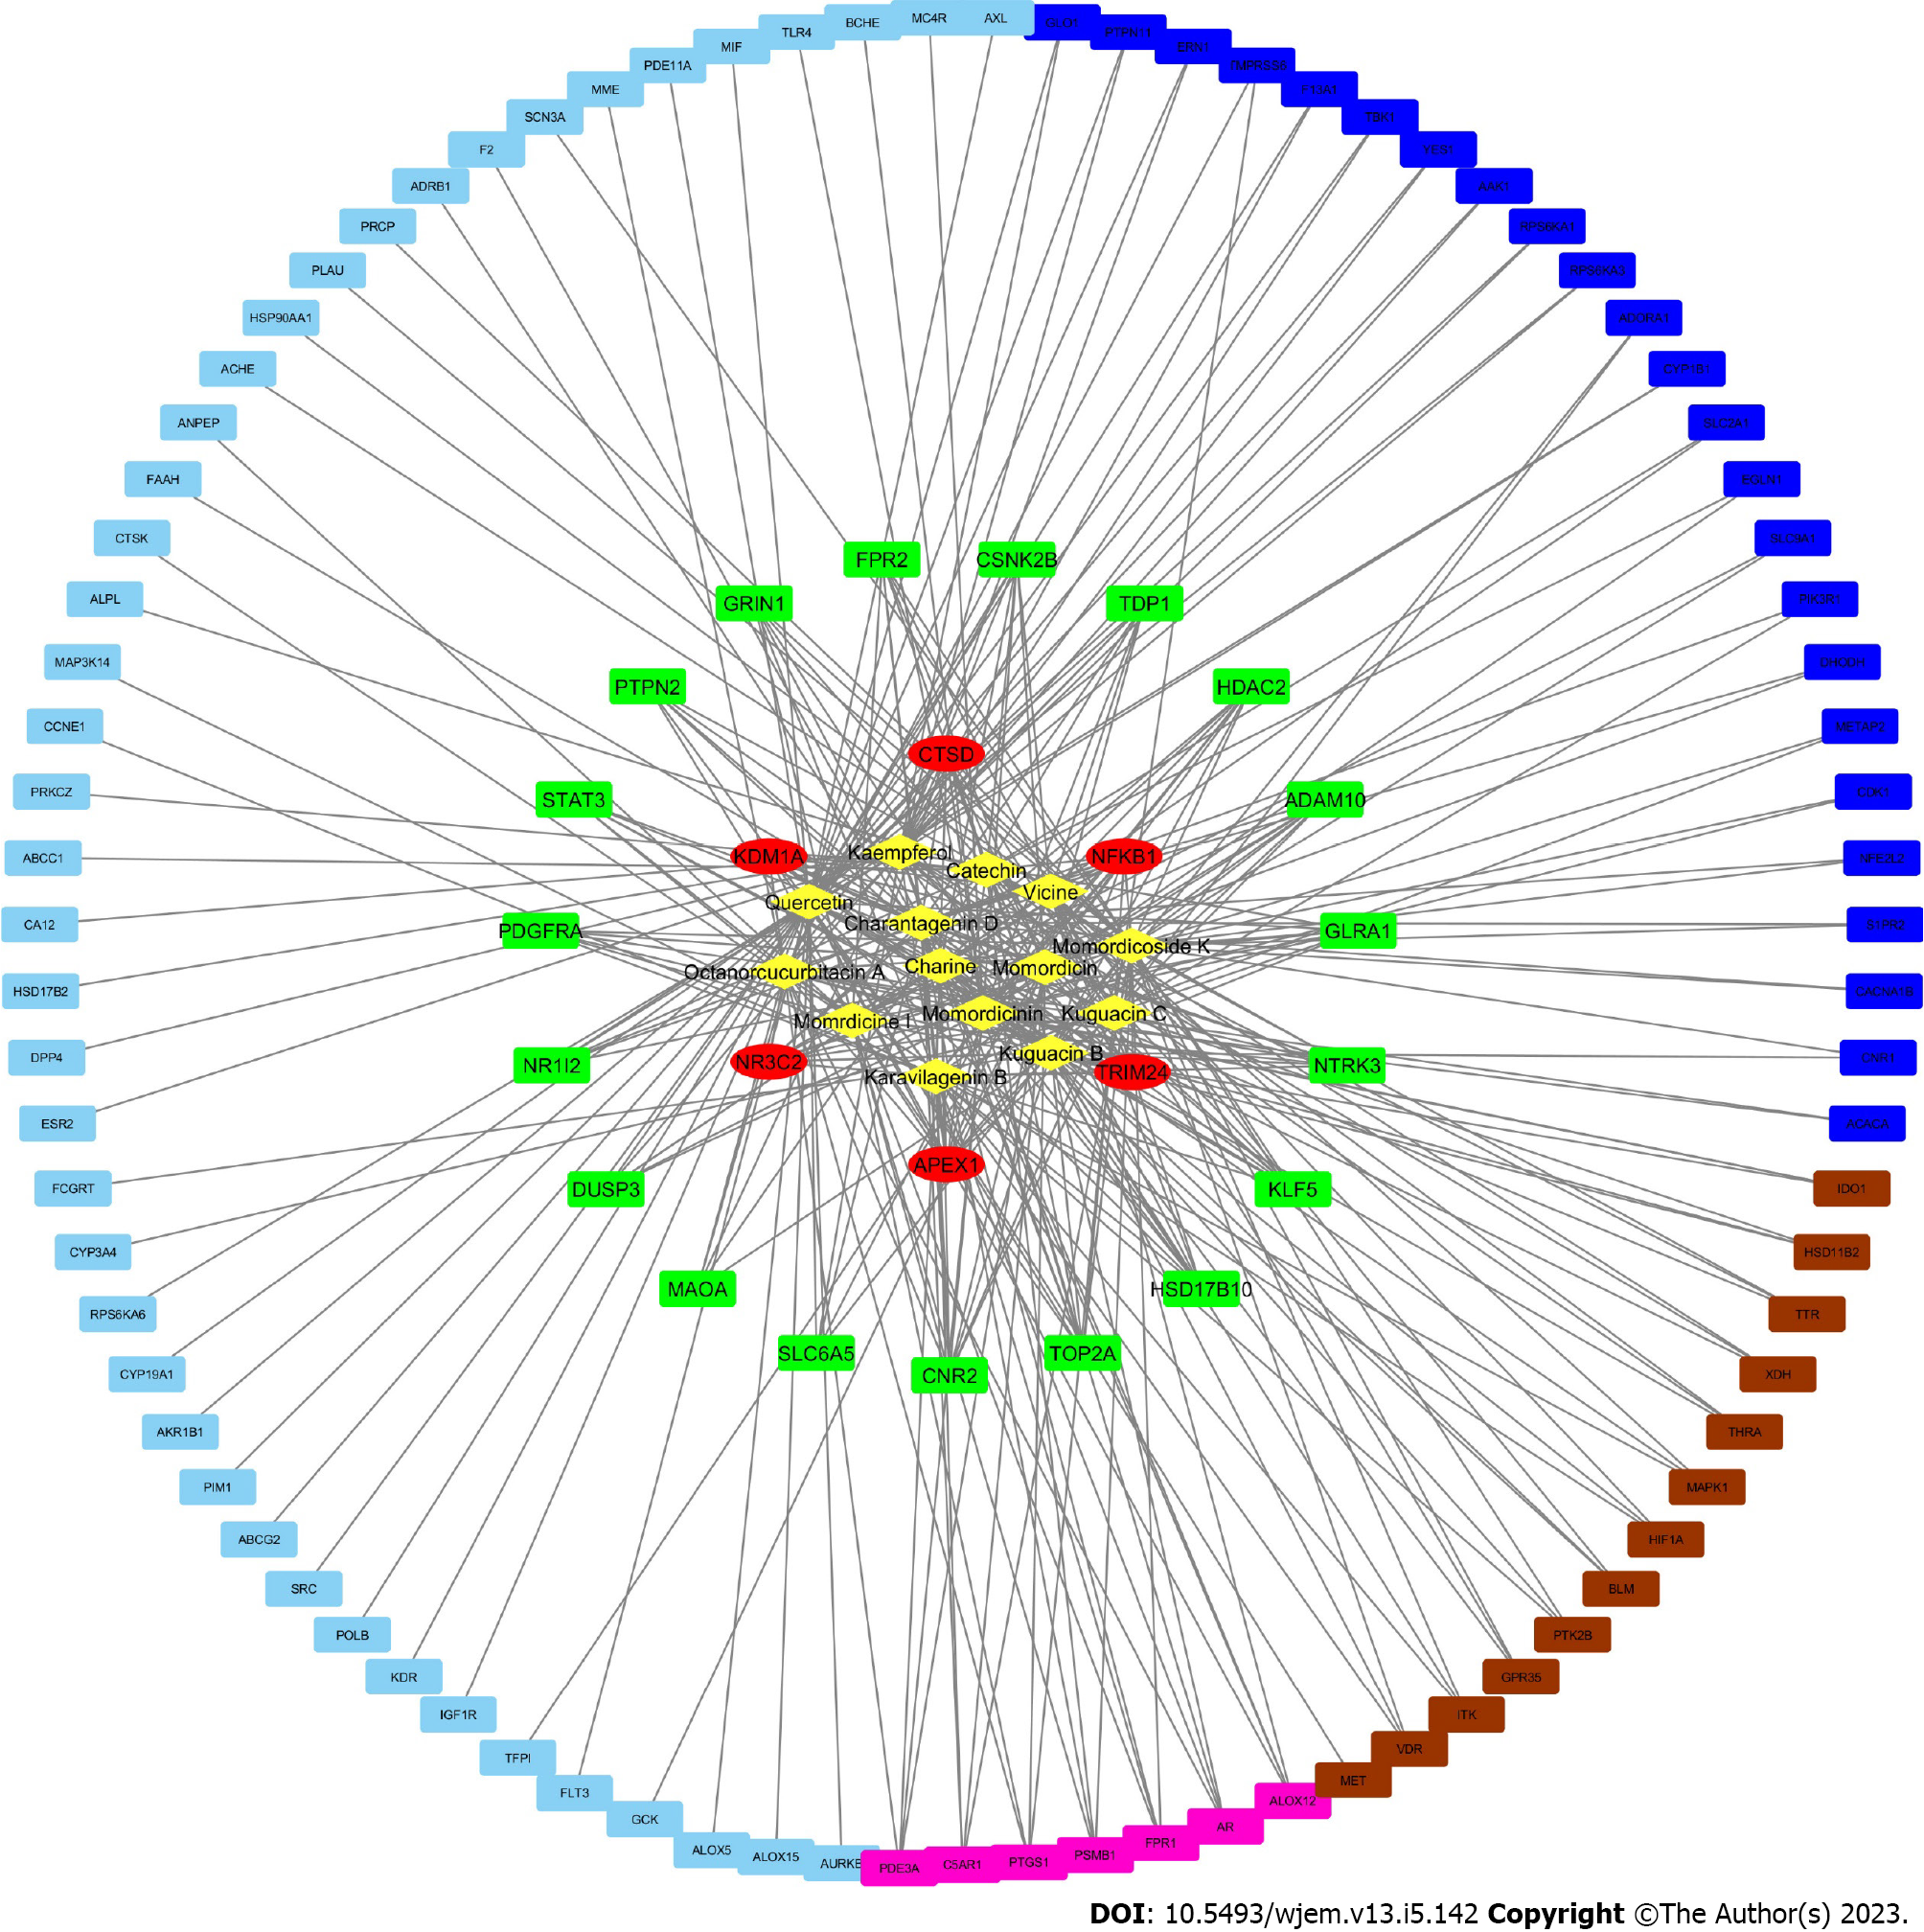
Figure 4 Active ingredient-anti-breast cancer target network of bitter melon.
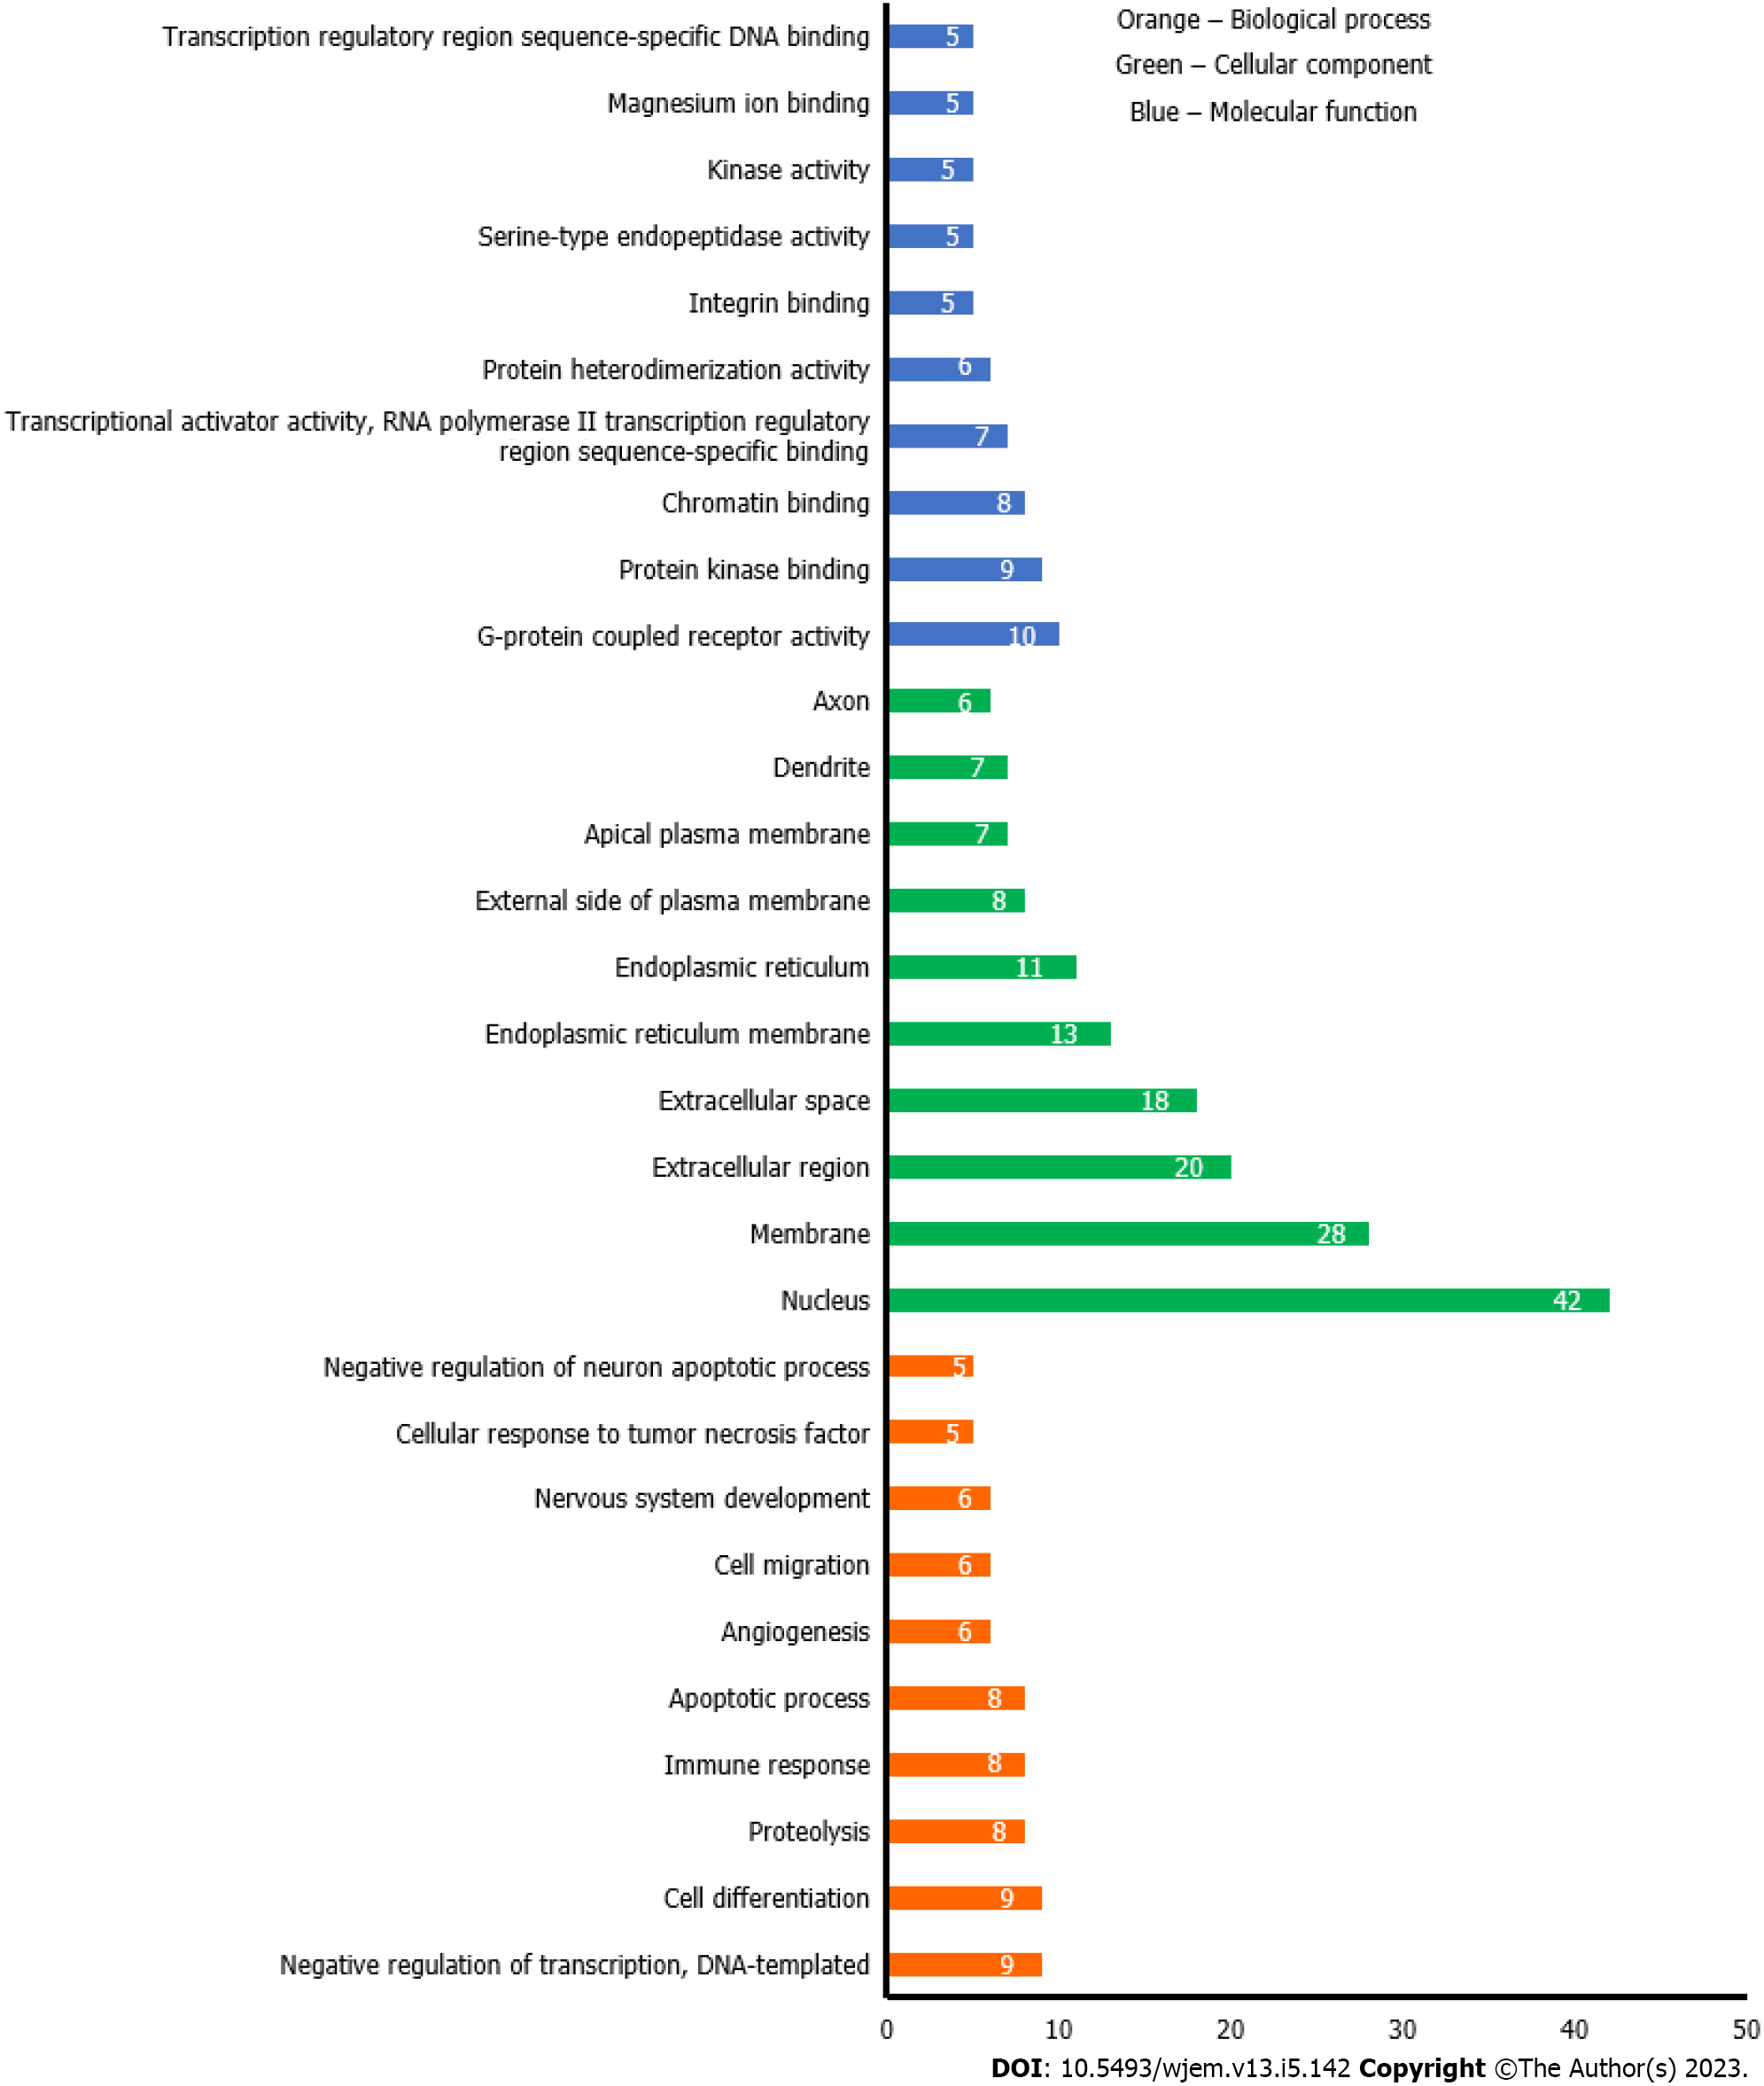
Figure 5 Gene ontology analysis of anti-breast cancer targets of bitter melon where Y-axis is the number of the targets involved in the gene ontology analysis, and the X-axis is the molecular function, biological process, or cellular component.
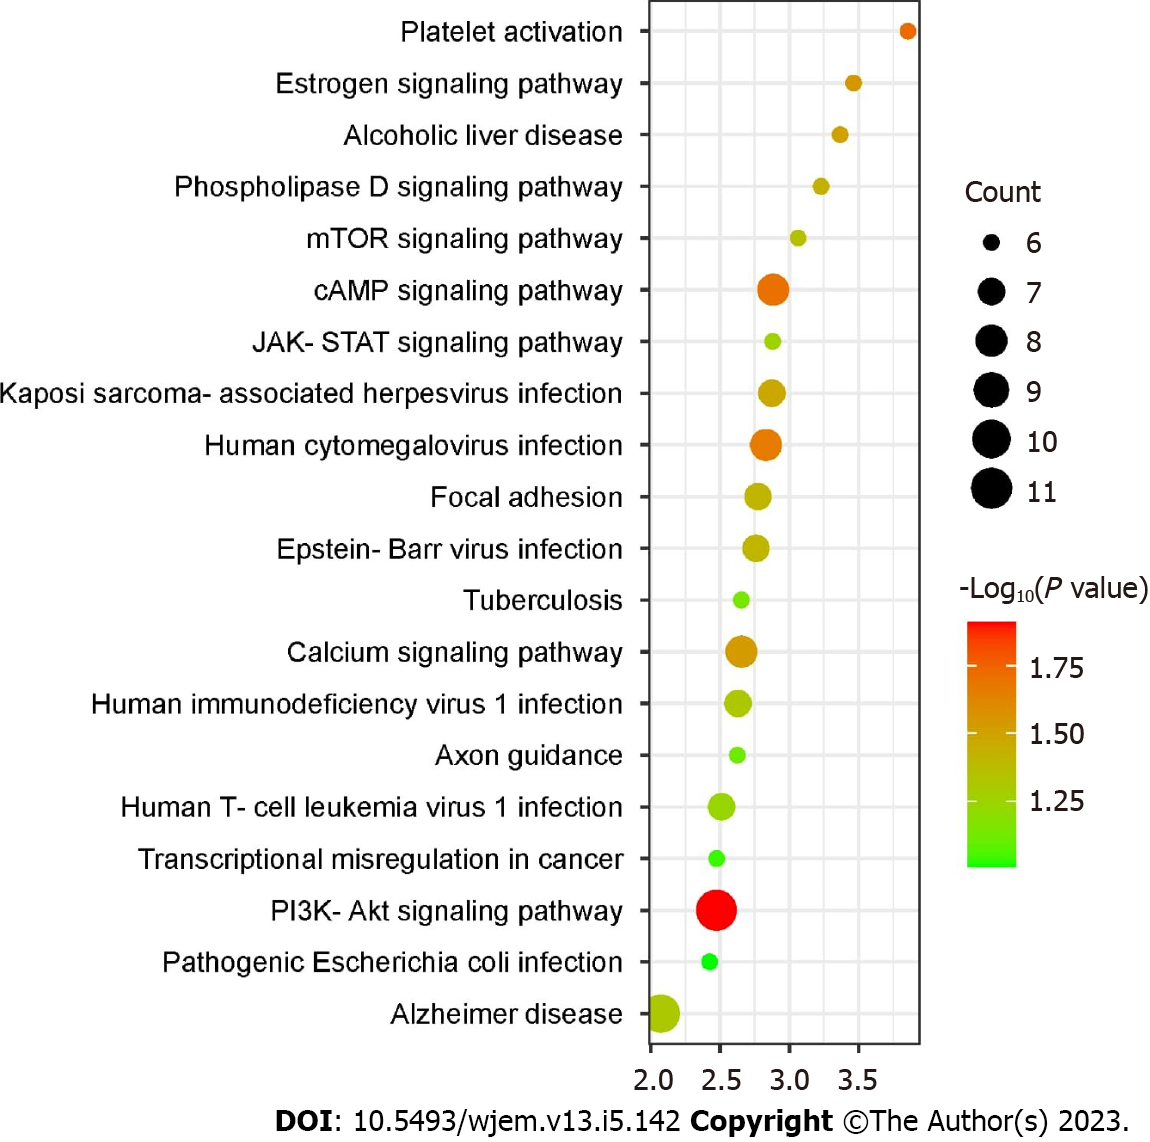
Figure 6 Kyoto encyclopedia of genes and genomes enrichment analysis (top 20) where X-axis is the enrichment gene count, and the Y-axis is the kyoto encyclopedia of genes and genomes pathway.
Bubble size represents the number of genes involved in the kyoto encyclopedia of genes and genomes enrichment while color represents -log 10 (P value). PIK3-Akt: Phosphatidylinositol 3-kinase/protein kinase B; JAK-STAT: Janus kinase-signal transducer and activator of transcription; mTOR: Mammalian target of rapamycin.
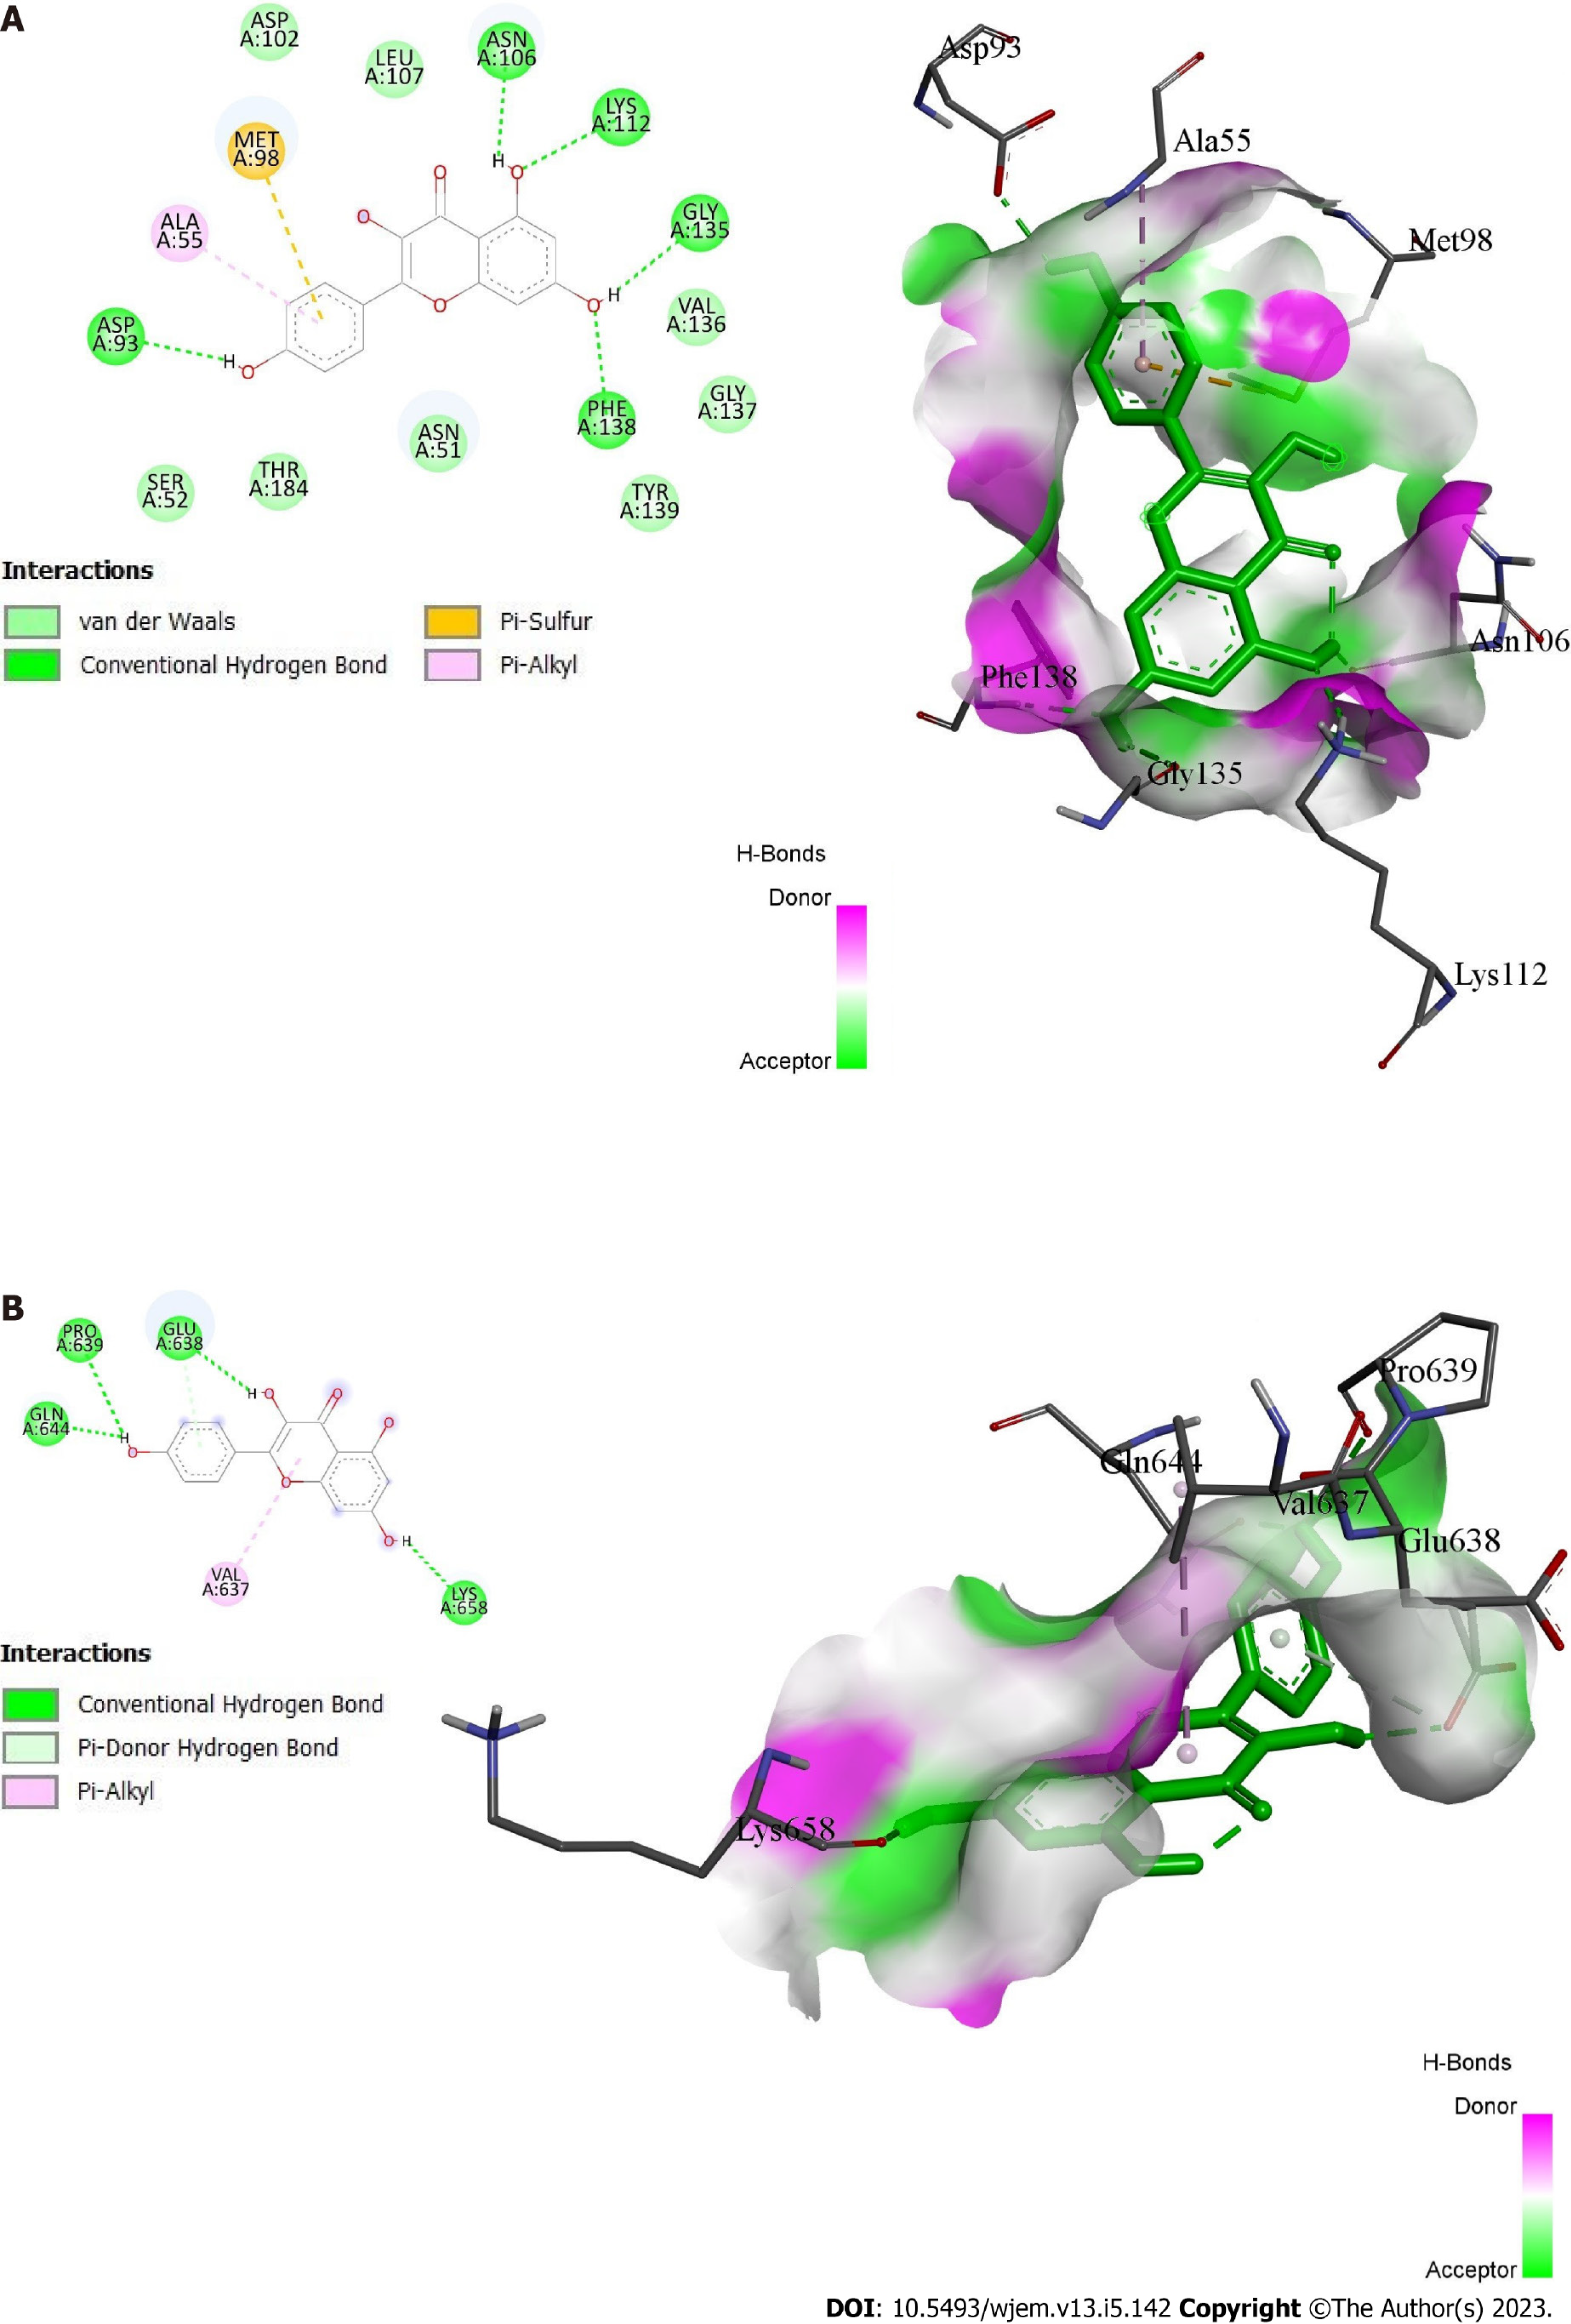
Figure 7 Docking interactions of kaempferol.
A: With protein 1OSF; B: With protein 6NJS.
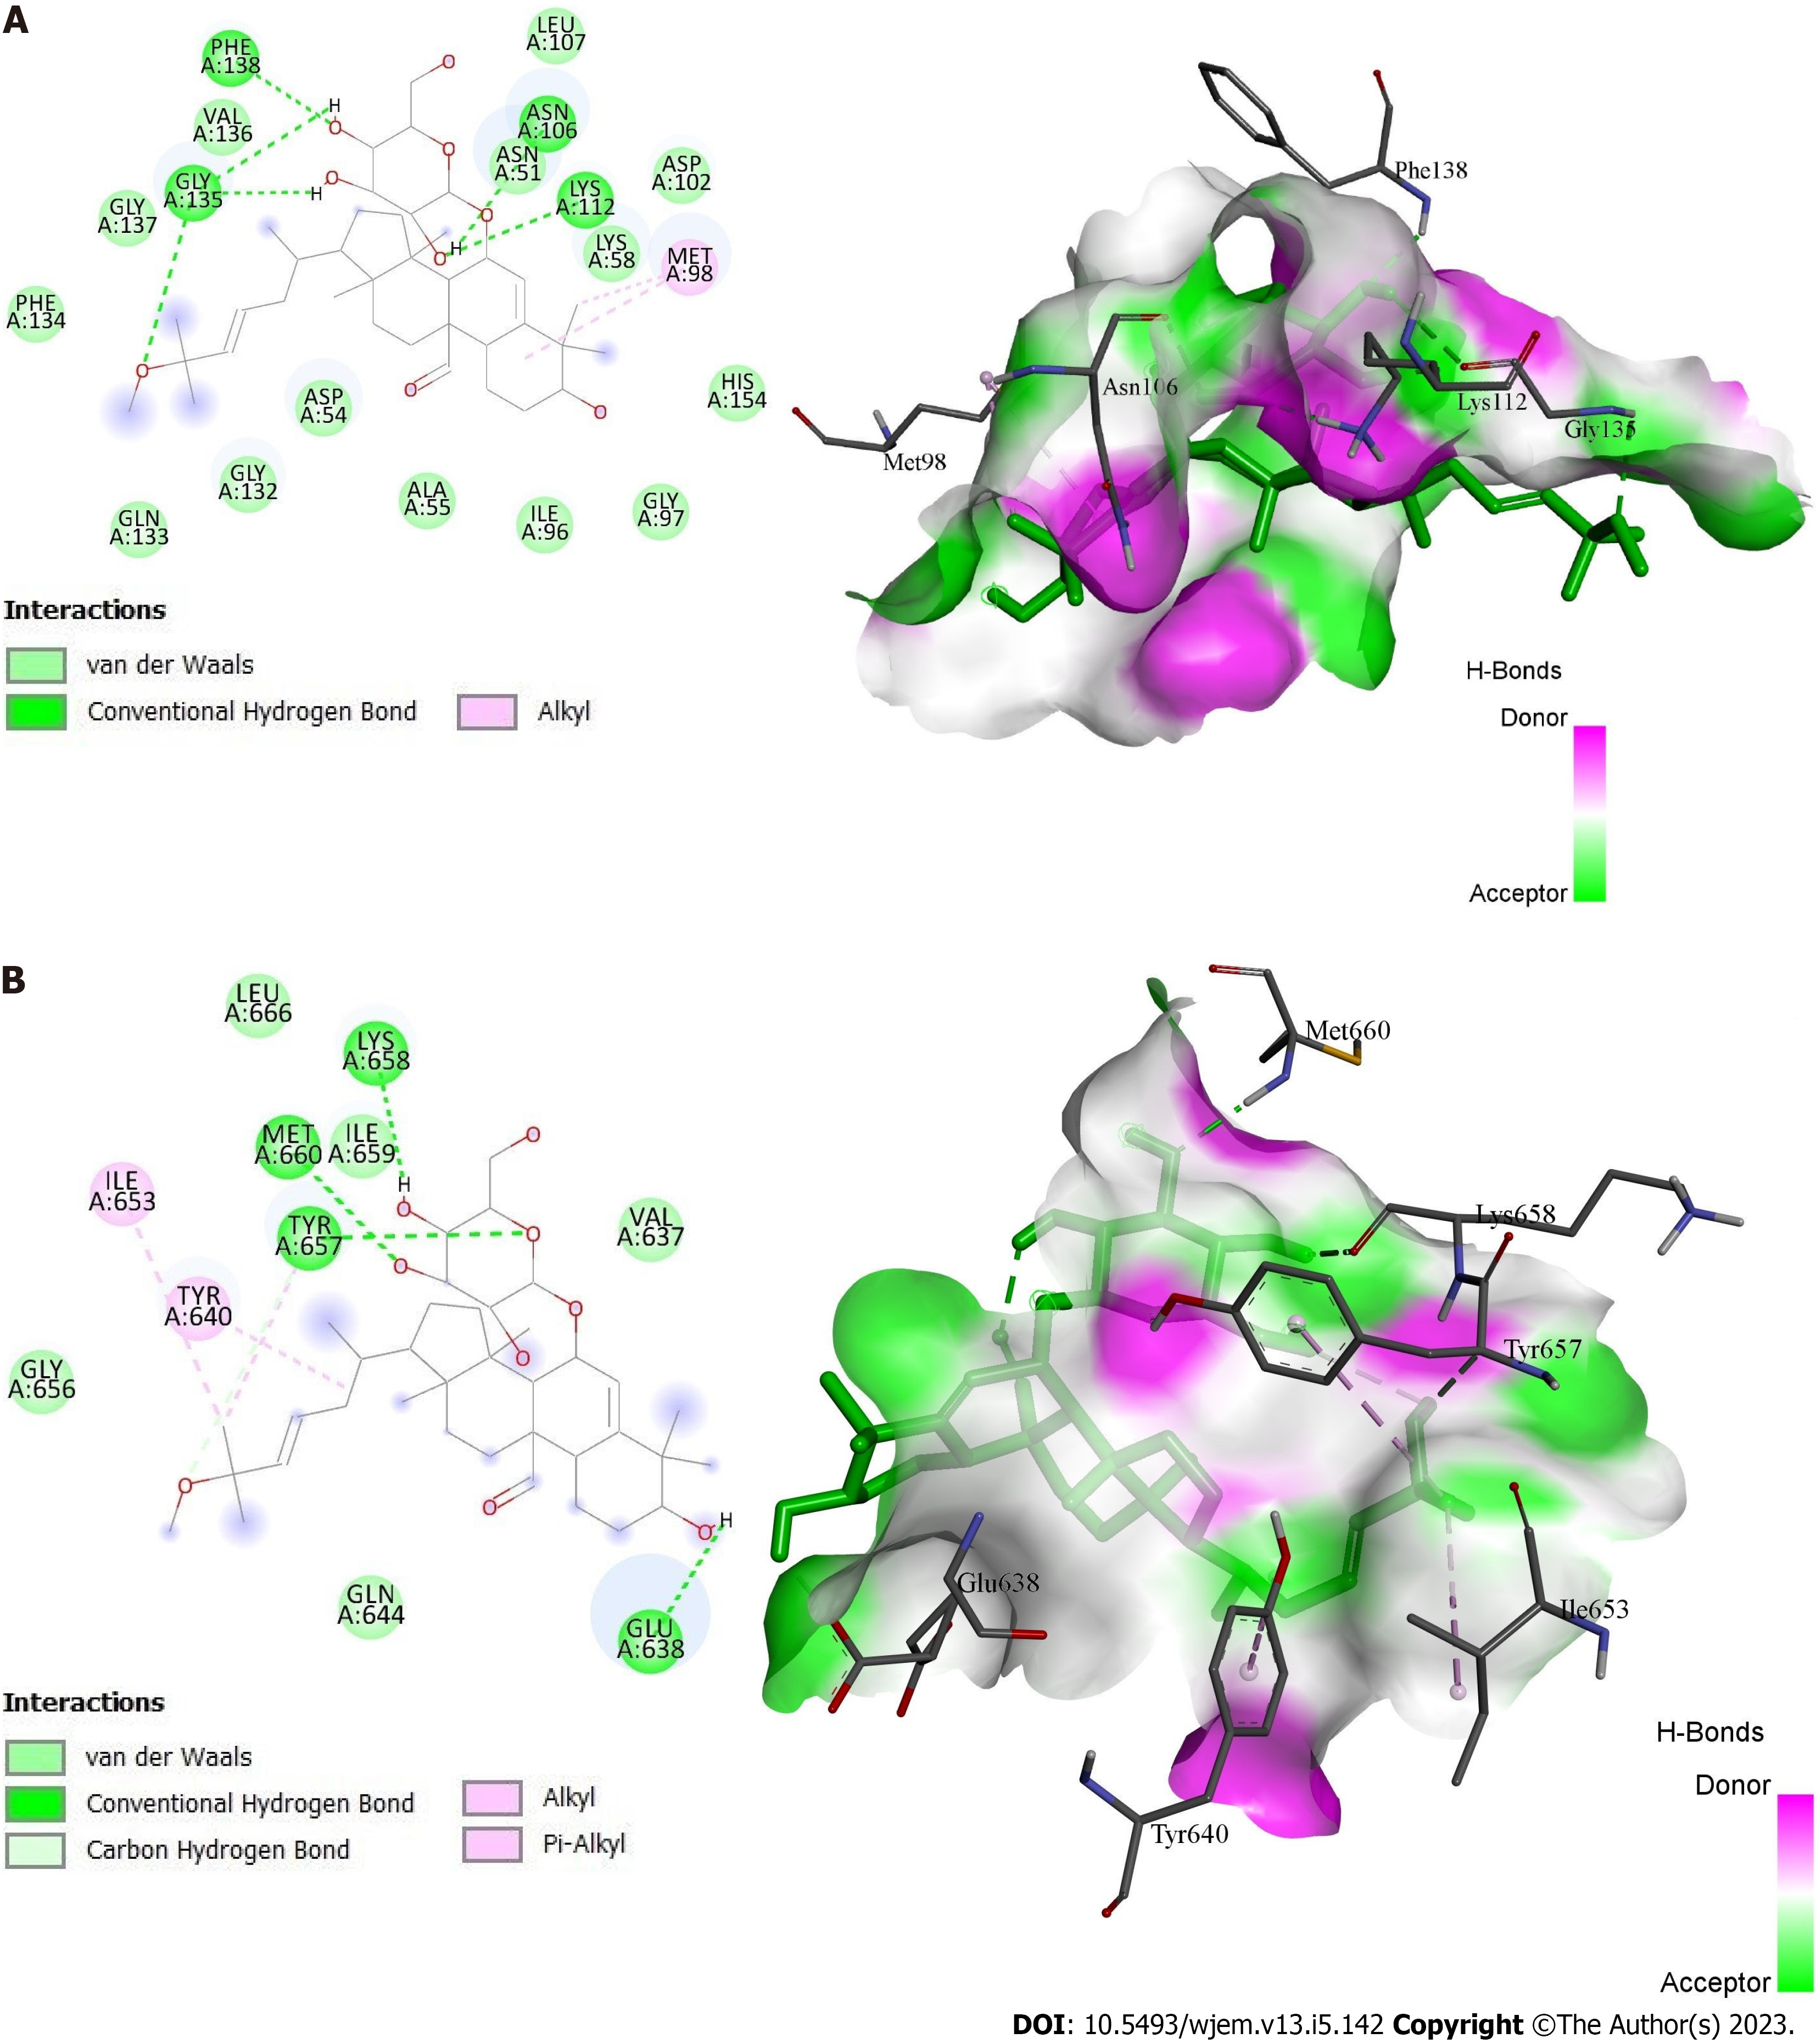
Figure 8 Docking interactions of momordicoside K.
A: With protein 1OSF; B: With protein 6NJS.
- Citation: Panchal K, Nihalani B, Oza U, Panchal A, Shah B. Exploring the mechanism of action bitter melon in the treatment of breast cancer by network pharmacology. World J Exp Med 2023; 13(5): 142-155
- URL: https://www.wjgnet.com/2220-315X/full/v13/i5/142.htm
- DOI: https://dx.doi.org/10.5493/wjem.v13.i5.142


