Copyright
©The Author(s) 2023.
World J Exp Med. Dec 20, 2023; 13(5): 102-114
Published online Dec 20, 2023. doi: 10.5493/wjem.v13.i5.102
Published online Dec 20, 2023. doi: 10.5493/wjem.v13.i5.102
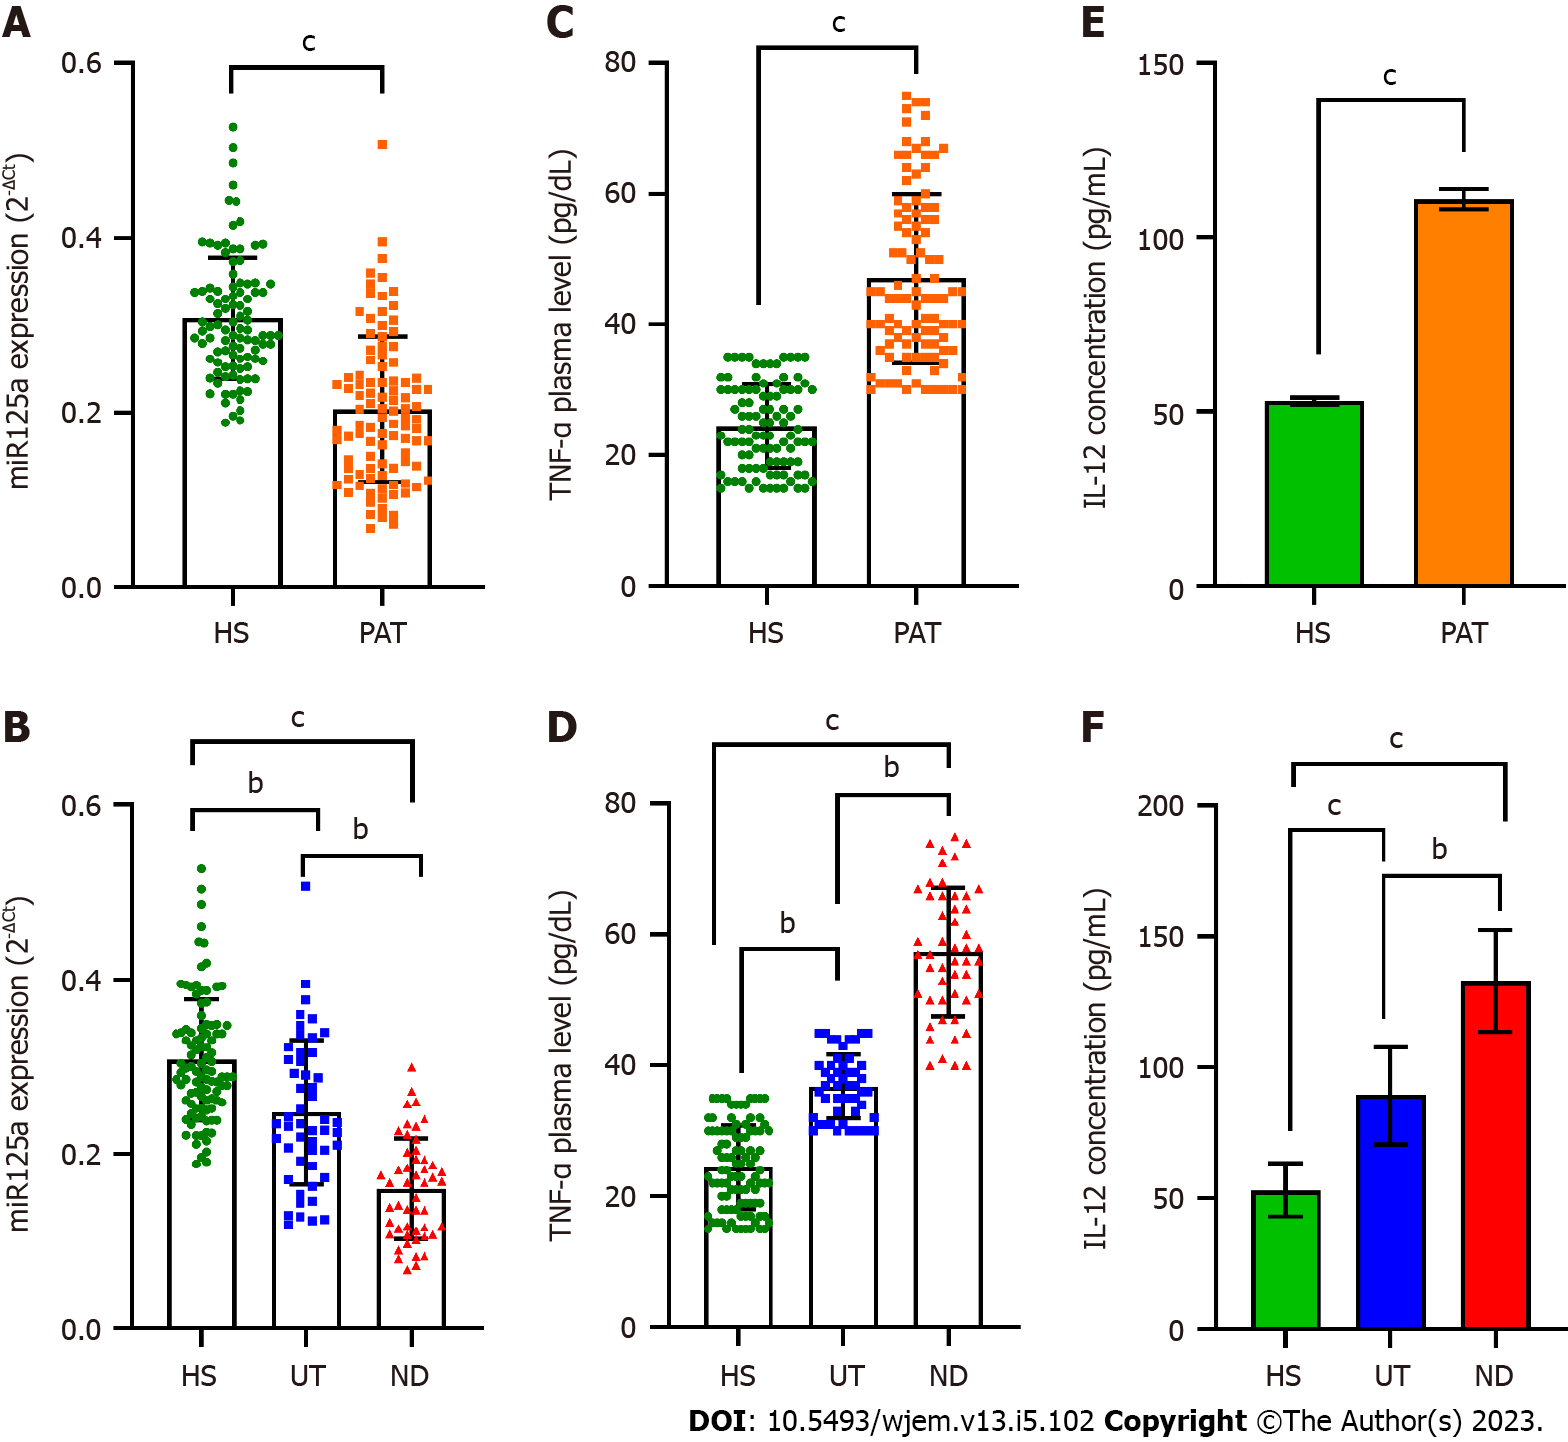
Figure 1 The expression levels of microRNA-125a, tumor necrosis factor-alpha, and interleukin 12 in systemic lupus erythematosus patients and normal subjects.
This study examined the expression levels of microRNA-125a (miR-125a), tumor necrosis factor-alpha (TNF-α), and interleukin 12 (IL-12) in systemic lupus erythematosus (SLE) patients and normal subjects. A: The findings revealed that miR-125a expression was significantly lower in SLE patients compared to normal subjects; B: With the lowest levels observed in newly diagnosed patients; C: TNF-α expression was higher in SLE patients compared to normal subjects; D: Its levels were highest in newly diagnosed patients; E: Similarly, the expression of IL-12 was significantly elevated in SLE patients compared to normal subjects; F: It was highest in newly diagnosed patients. The Independent Samples t-test or Mann-Whitney U test were employed for comparing two groups, while one-way ANOVA with Tukey’s post-test or Kruskal-Wallis with Dunn-Bonferroni post-test were used for comparing more than two groups. The error bars represent means ± SD. Significance levels are denoted as bP < 0.01 and cP < 0.0001. HS: Humic subjects; PAT: Patients; UT: Under-treatment; ND: Newly diagnosed.
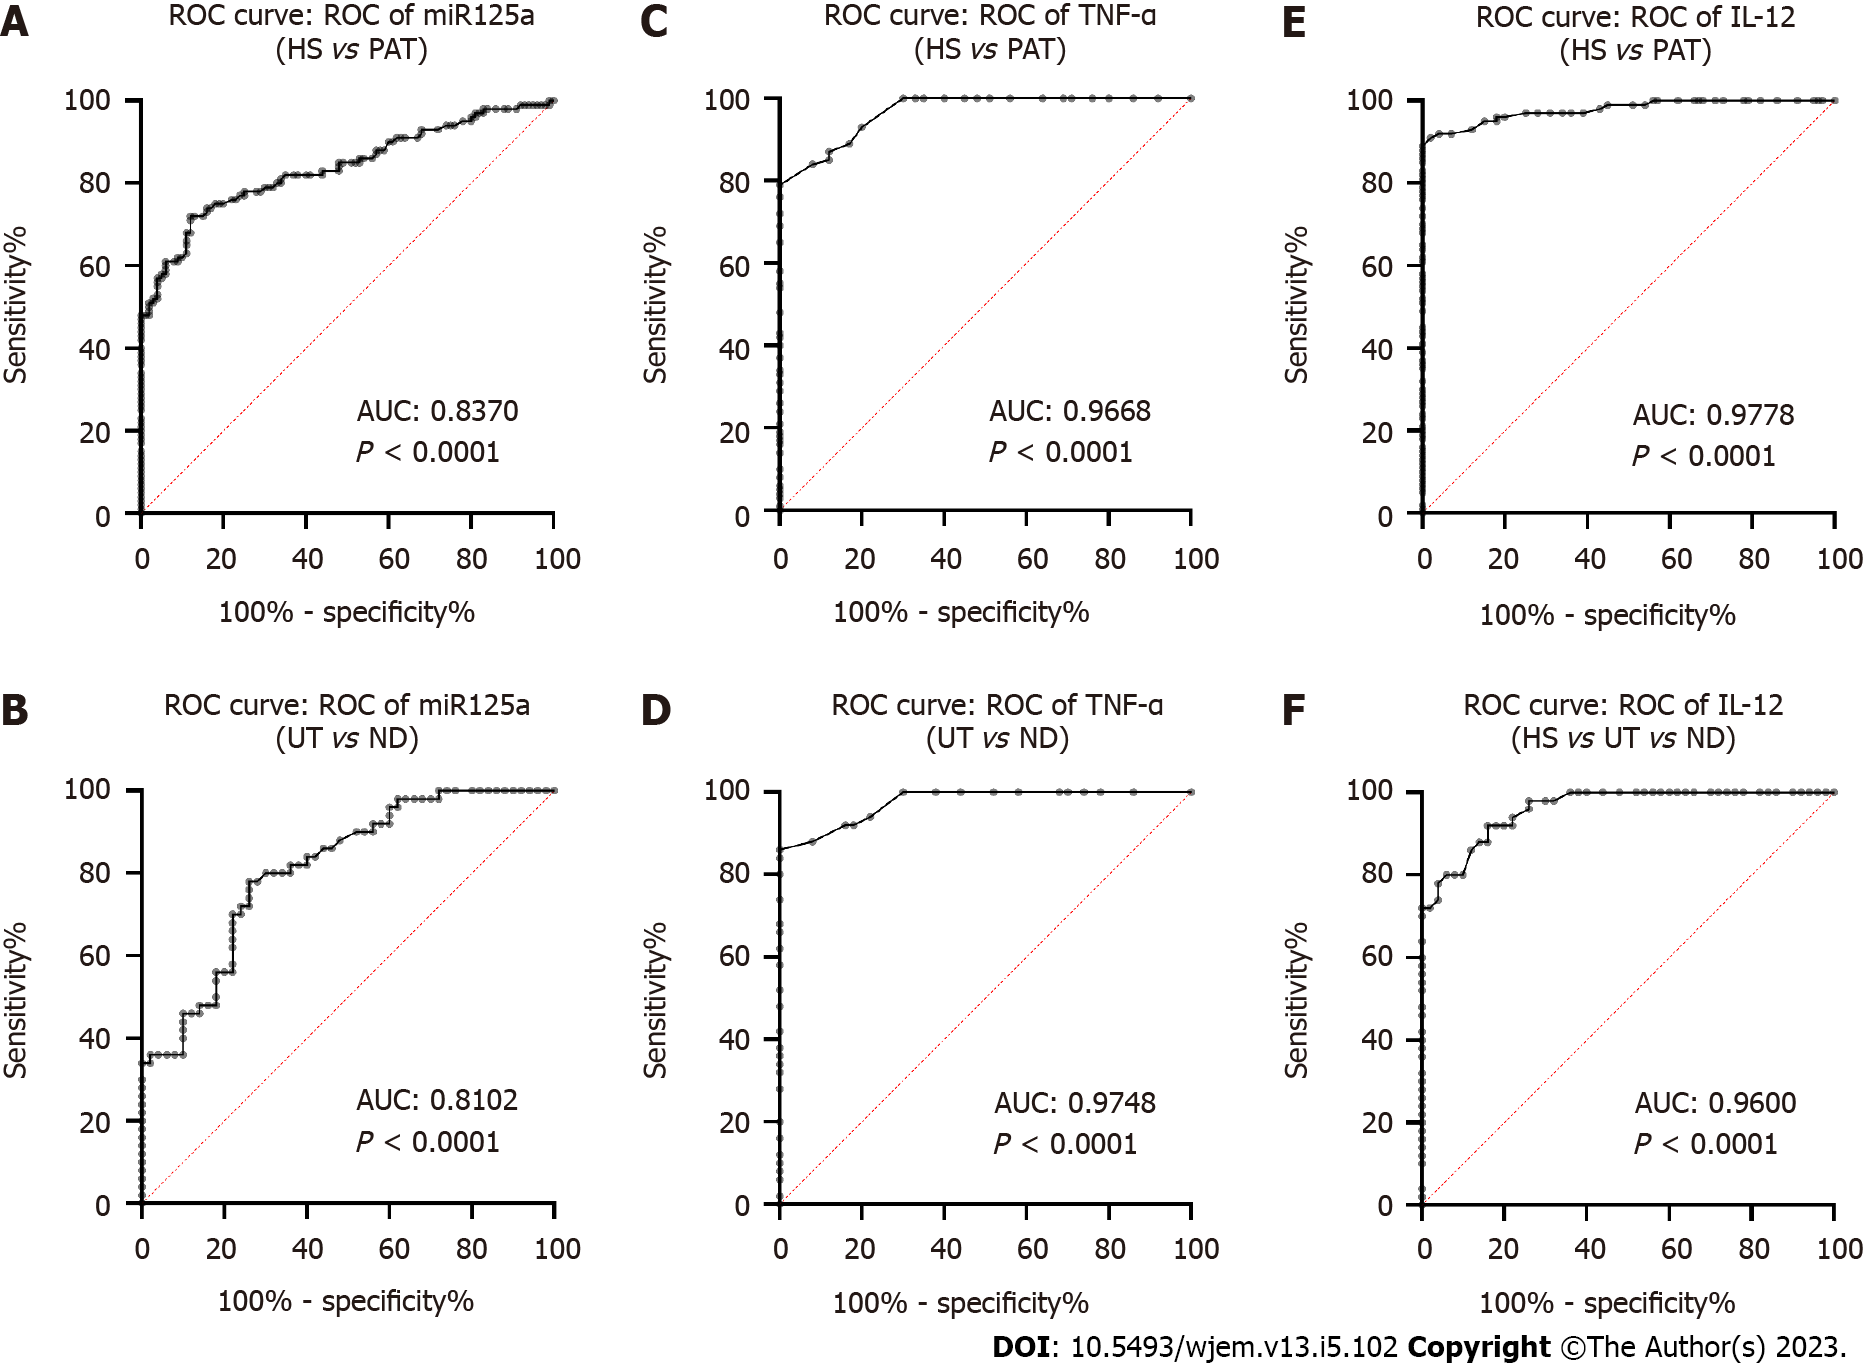
Figure 2 Diagnostic utilities of microRNA-125a, tumor necrosis factor-alpha, and interleukin 12 in systemic lupus erythematosus patients.
Receiver operating characteristic curve analysis was performed to assess the diagnostic accuracy of microRNA-125a (miR-125a), tumor necrosis factor-alpha (TNF-α), and interleukin 12 (IL-12) in distinguishing systemic lupus erythematosus (SLE) patients from normal subjects and newly diagnosed SLE patients from those under treatment. A: The area under the curve (AUC) values for miR-125a were 0.8370 (95%CI: 0.7803 to 0.8936; P < 0.0001) in SLE patients vs normal subjects; B: 0.8102 (95%CI: 0.7279 to 0.8925; P < 0.0001) in newly diagnosed vs under treatment SLE patients; C: For TNF-α, the AUC values were 0.9668 (95%CI: 0.9476 to 0.9860; P < 0.0001) in SLE patients vs normal subjects; D: 0.9748 (95%CI: 0.9513 to 0.9983; P < 0.0001) in newly diagnosed vs. under treatment SLE patients; E: Regarding IL-12, the AUC values were 0.9778 (95%CI: 0.9599 to 0.9957; P < 0.0001) in SLE patients vs normal subjects; F: 0.9600 (95%CI: 0.9289 to 0.9911; P < 0.0001) in newly diagnosed vs under treatment SLE patients. HS: Humic subjects; PAT: Patients; UT: Under-treatment; ND: Newly diagnosed.
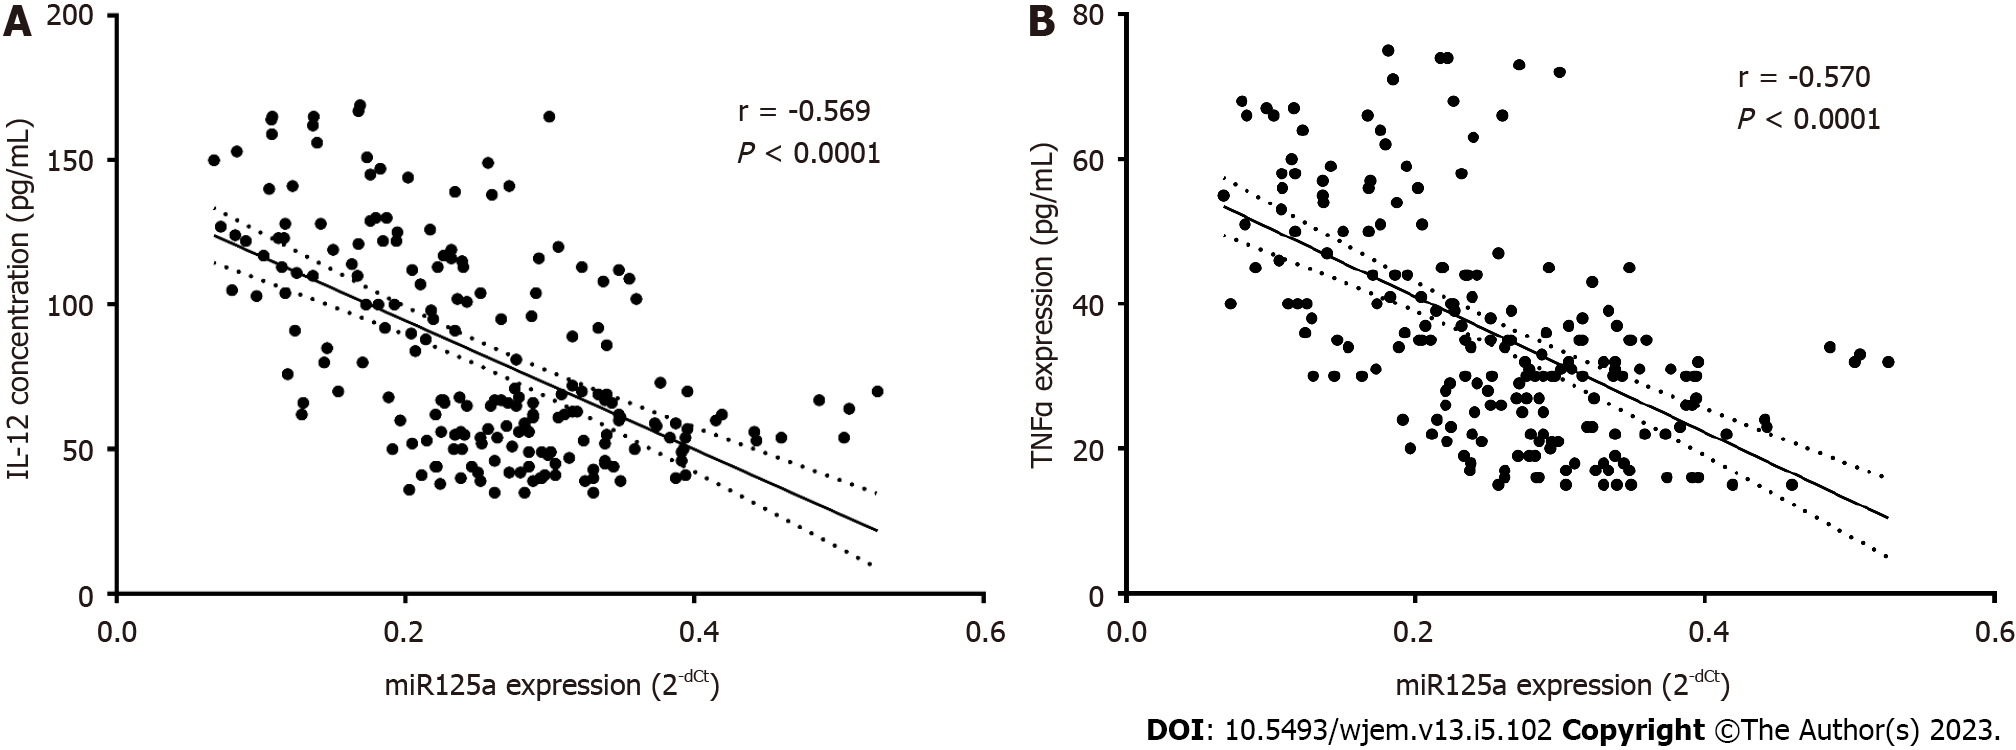
Figure 3 The correlations of microRNA-125a with tumor necrosis factor-alpha and tumor necrosis factor-alpha.
A: The relationship between plasma levels of microRNA-125a (miR-125a) and interleukin 12 was assessed, revealing a significant negative correlation (r = -0.569, P < 0.0001) as demonstrated by Pearson correlation analysis; B: Similarly, the plasma levels of miR-125a and tumor necrosis factor-alpha showed a significant negative correlation (r = -0.570, P < 0.0001) based on the Pearson correlation study.
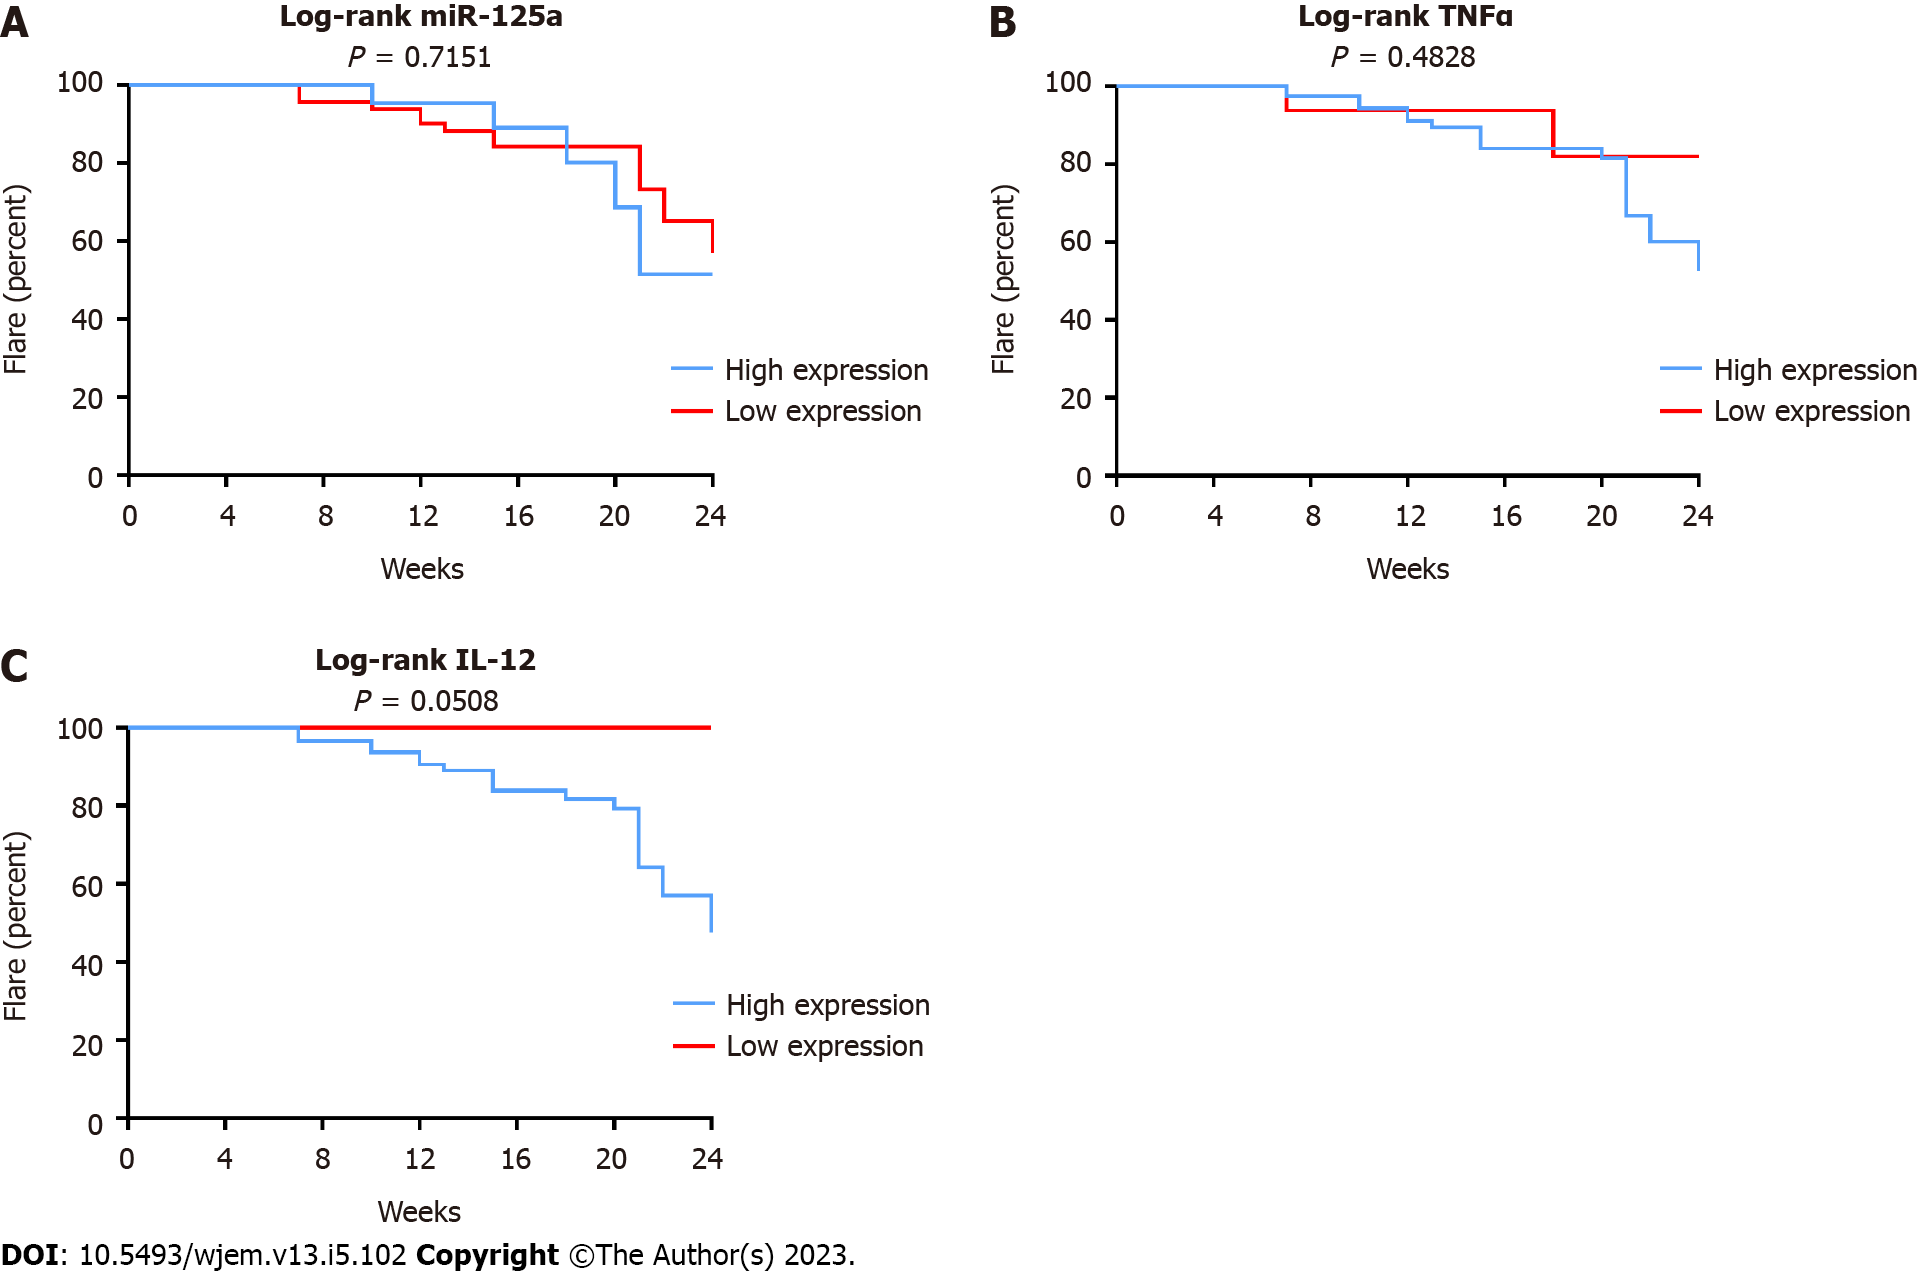
Figure 4 The prognostic utilities of microRNA-125a, tumor necrosis factor-alpha, and interleukin 12 to predict flare in systemic lupus erythematosus patients.
Based on the optimal cut-off points obtained from receiver operating characteristic curve analyses, the levels of microRNA-125a (miR-125a), tumor necrosis factor-alpha (TNF-α), and interleukin 12 (IL-12) were categorized as low or high. The predictive ability of these biomarkers for the outcome (Flare) in systemic lupus erythematosus (SLE) patients was assessed using the log-rank test. A: The results showed that miR-125a was not significantly predictive of the outcome (P < 0.7151); B: TNF-α showed a potential for predicting the outcome, but the association was not statistically significant (P = 0.4828); C: In contrast, IL-12 demonstrated a significant predictive capability for the outcome in SLE patients (P = 0.0508) based on the log-rank test results.
- Citation: Alsbihawi TQ, Zare Ebrahimabad M, Seyedhosseini FS, Davoodi H, Abdolahi N, Nazari A, Mohammadi S, Yazdani Y. Altered expression of miR-125a and dysregulated cytokines in systemic lupus erythematosus: Unveiling diagnostic and prognostic markers. World J Exp Med 2023; 13(5): 102-114
- URL: https://www.wjgnet.com/2220-315X/full/v13/i5/102.htm
- DOI: https://dx.doi.org/10.5493/wjem.v13.i5.102


