Copyright
©The Author(s) 2020.
World J Exp Med. Mar 30, 2020; 10(2): 10-25
Published online Mar 30, 2020. doi: 10.5493/wjem.v10.i2.10
Published online Mar 30, 2020. doi: 10.5493/wjem.v10.i2.10
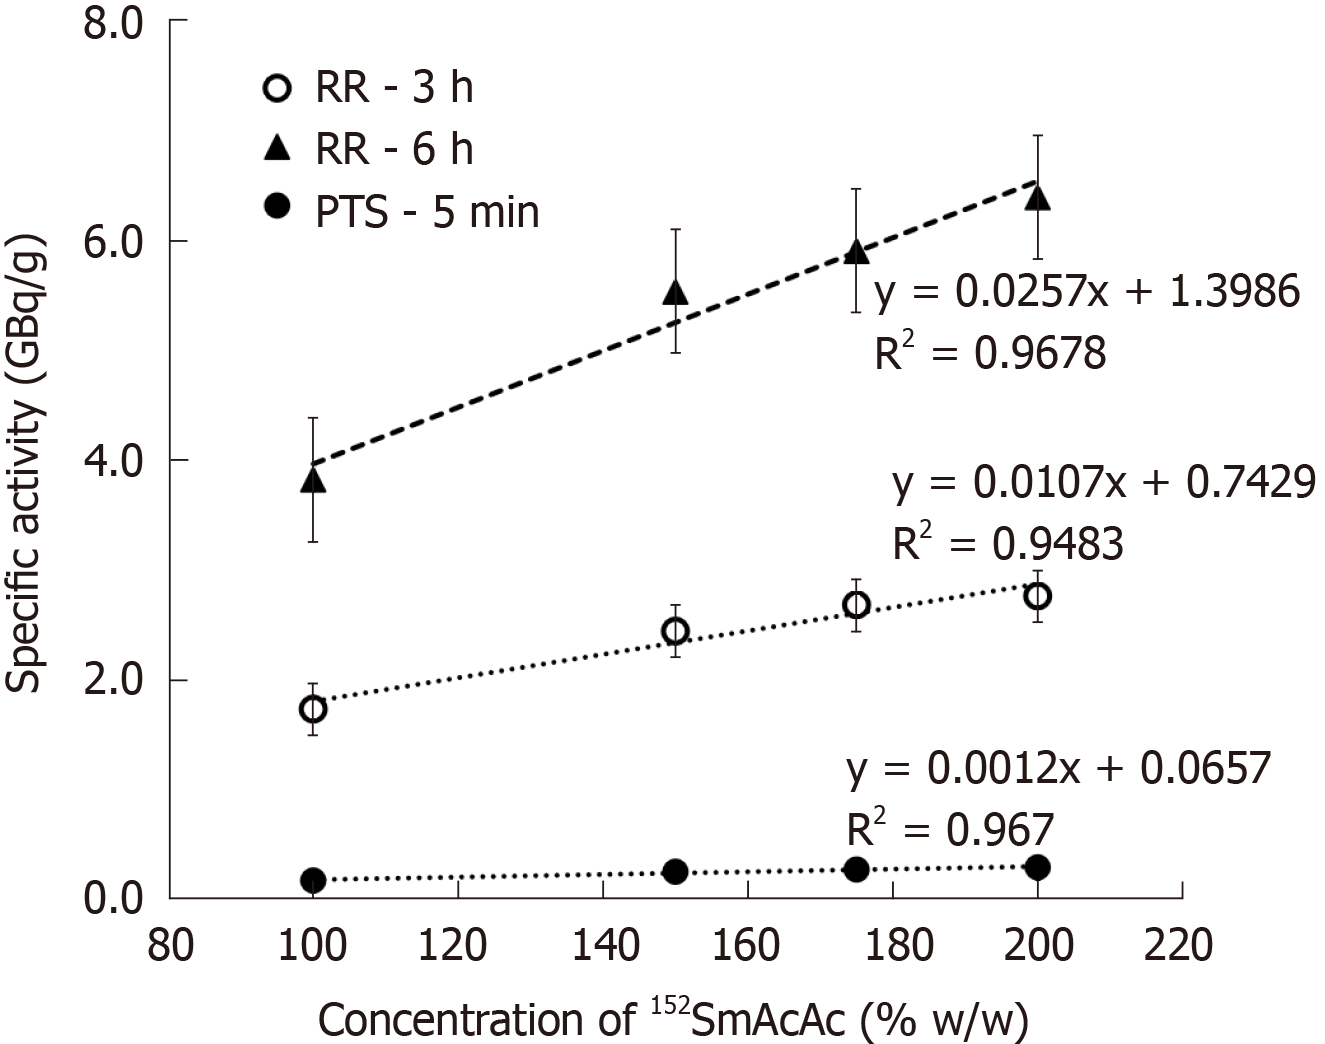
Figure 1 Specify activity of samarium acetylacetonate-poly-L-lactic acid microspheres (100%, 150%, 175% and 200%, w/w samarium acetylacetonate), neutron-activated using different neutron activation protocol and duration.
SmAcAc: Samarium acetylacetonate; RR: Rotary specimen rack; PTS: Pneumatic transfer system.
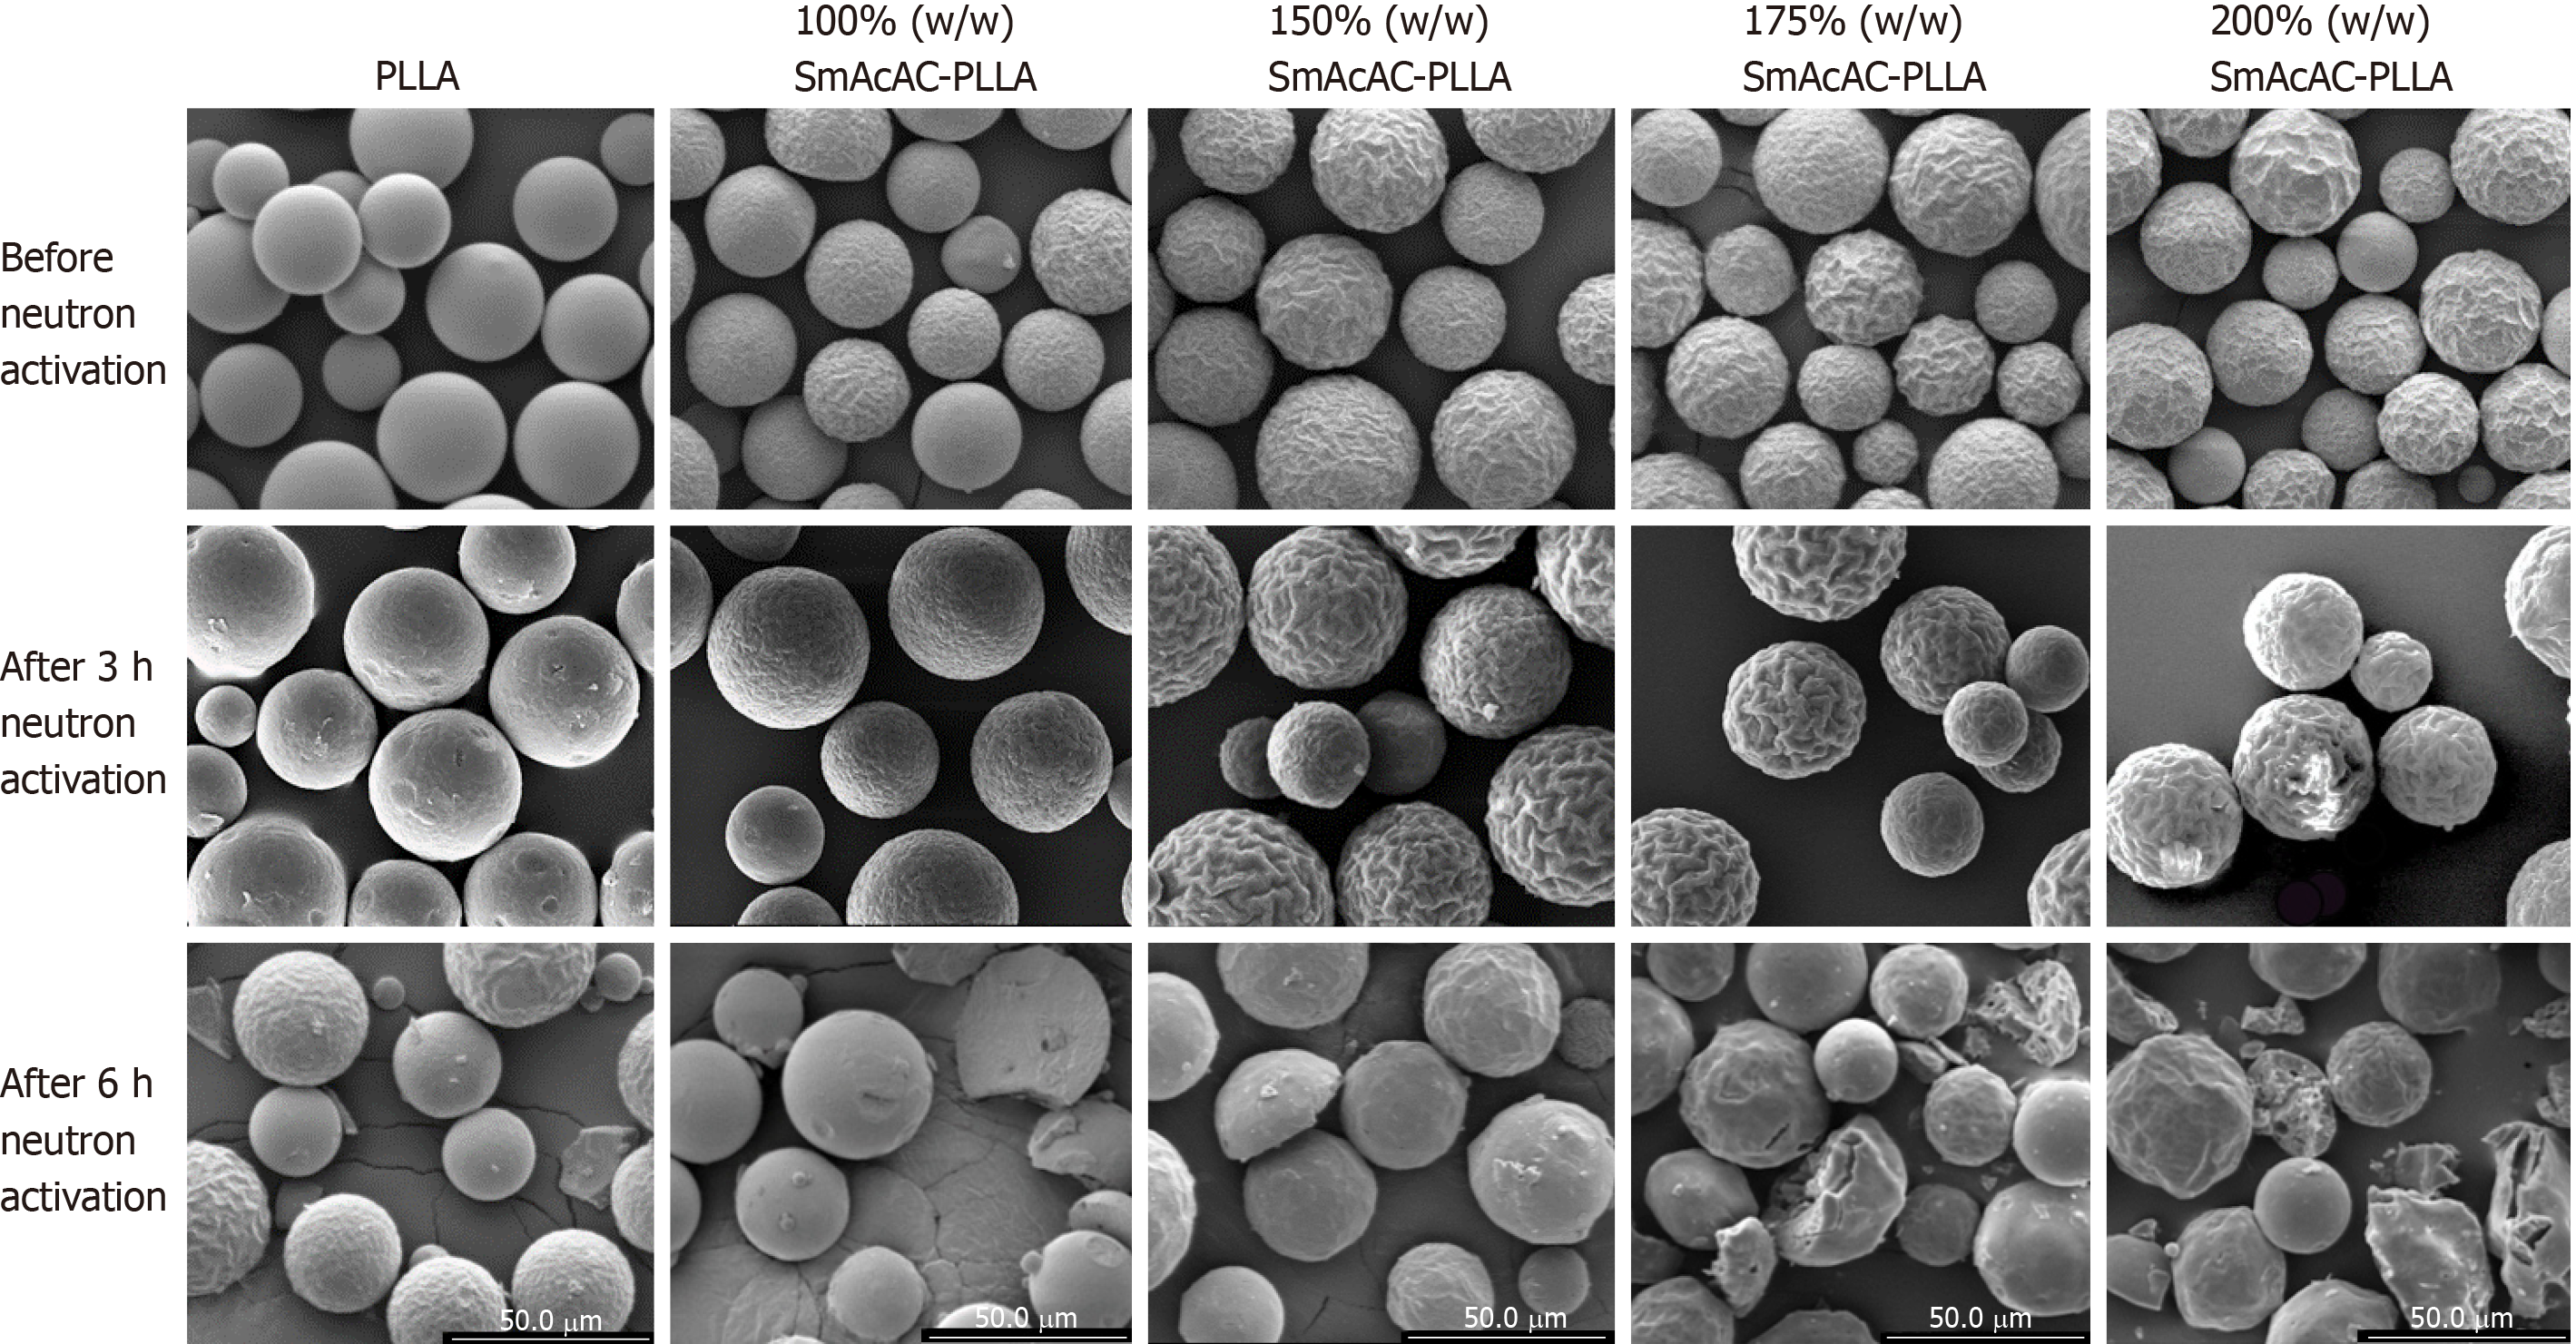
Figure 2 Scanning electron microscopy images of the poly-L-lactic acid and samarium acetylacetonate-poly-L-lactic acid microspheres before and after 3 h and 6 h neutron activation.
Scale bars are 50.0 μm. PLLA: Poly-L-lactic acid; SmAcAc: Samarium acetylacetonate.
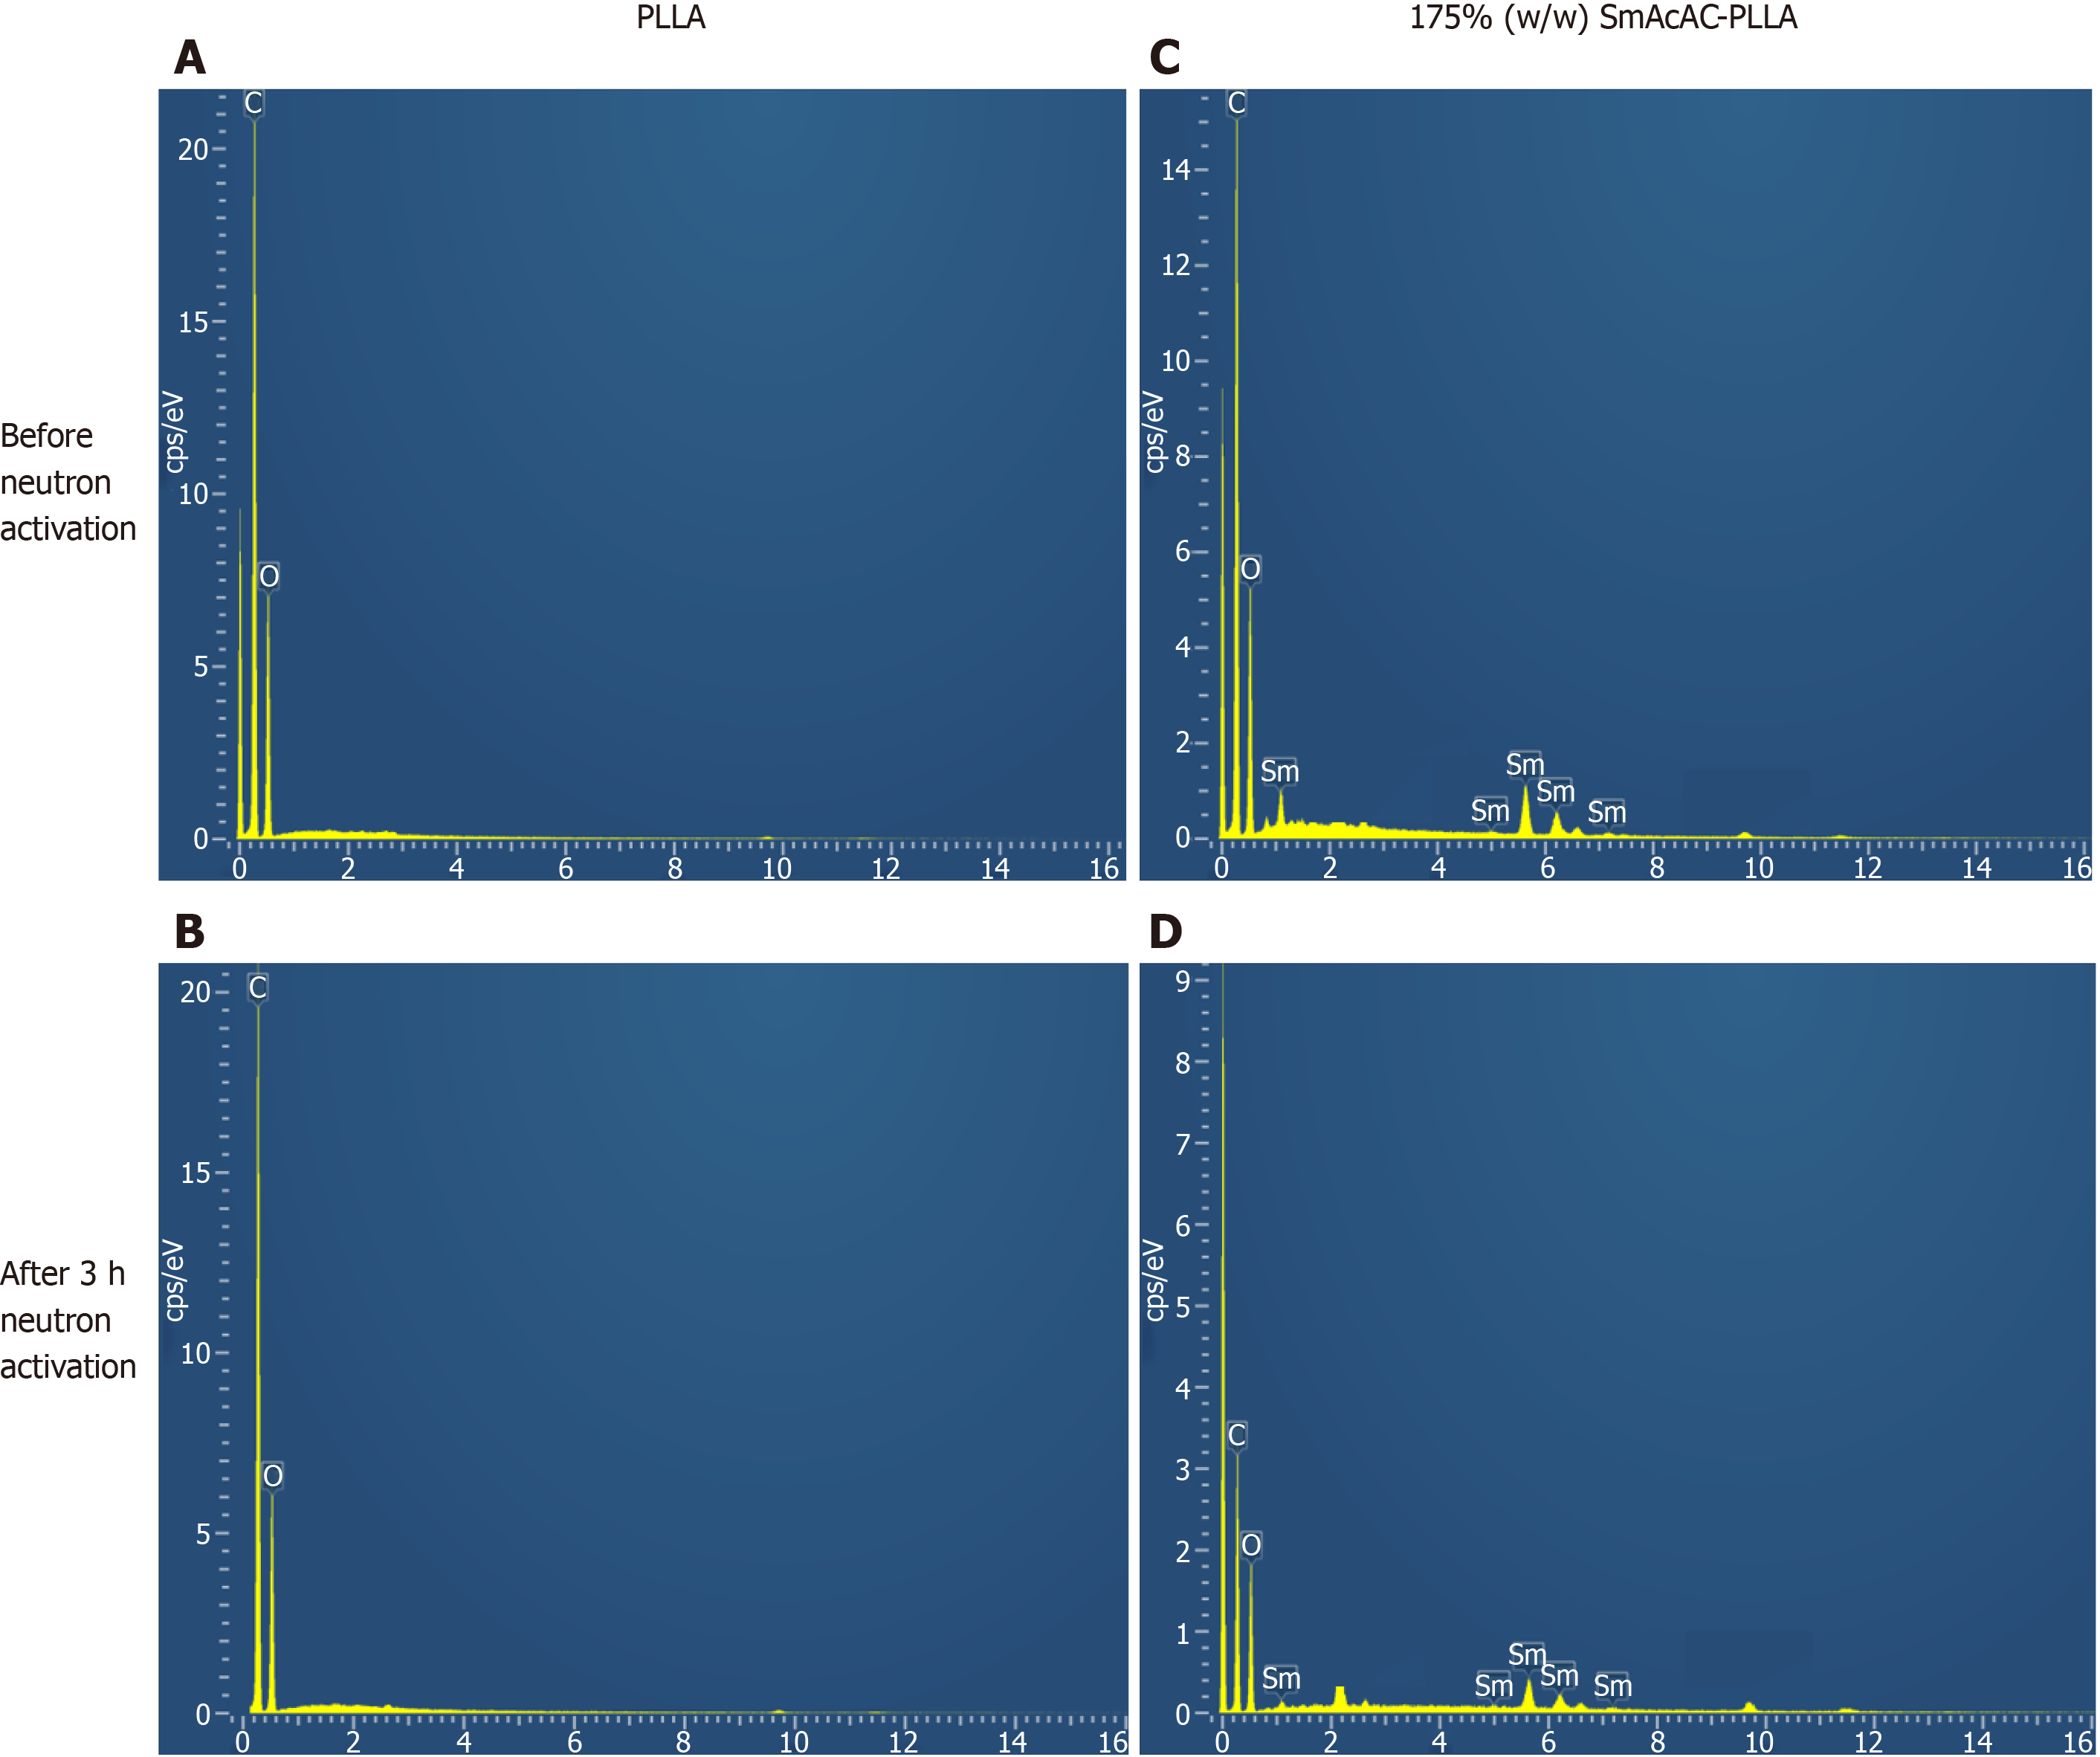
Figure 3 The energy dispersive X-ray spectrum of the poly-L-lactic acid microspheres and samarium acetylacetonate-poly-L-lactic acid microspheres before and after 3 h neutron activation.
A and B: Energy dispersive X-ray spectrum of the poly-L-lactic acid (PLLA) microspheres; C and D: samarium acetylacetonate (SmAcAc)-PLLA microspheres. Energy dispersive X-ray spectrum of the PLLA and SmAcAc-PLLA microspheres before and after 3 h neutron activation clearly show the presence of carbon and oxygen in the PLLA microspheres; and carbon, oxygen and Sm in the SmAcAc-PLLA microspheres. PLLA: Poly-L-lactic acid; SmAcAc: Samarium acetylacetonate.
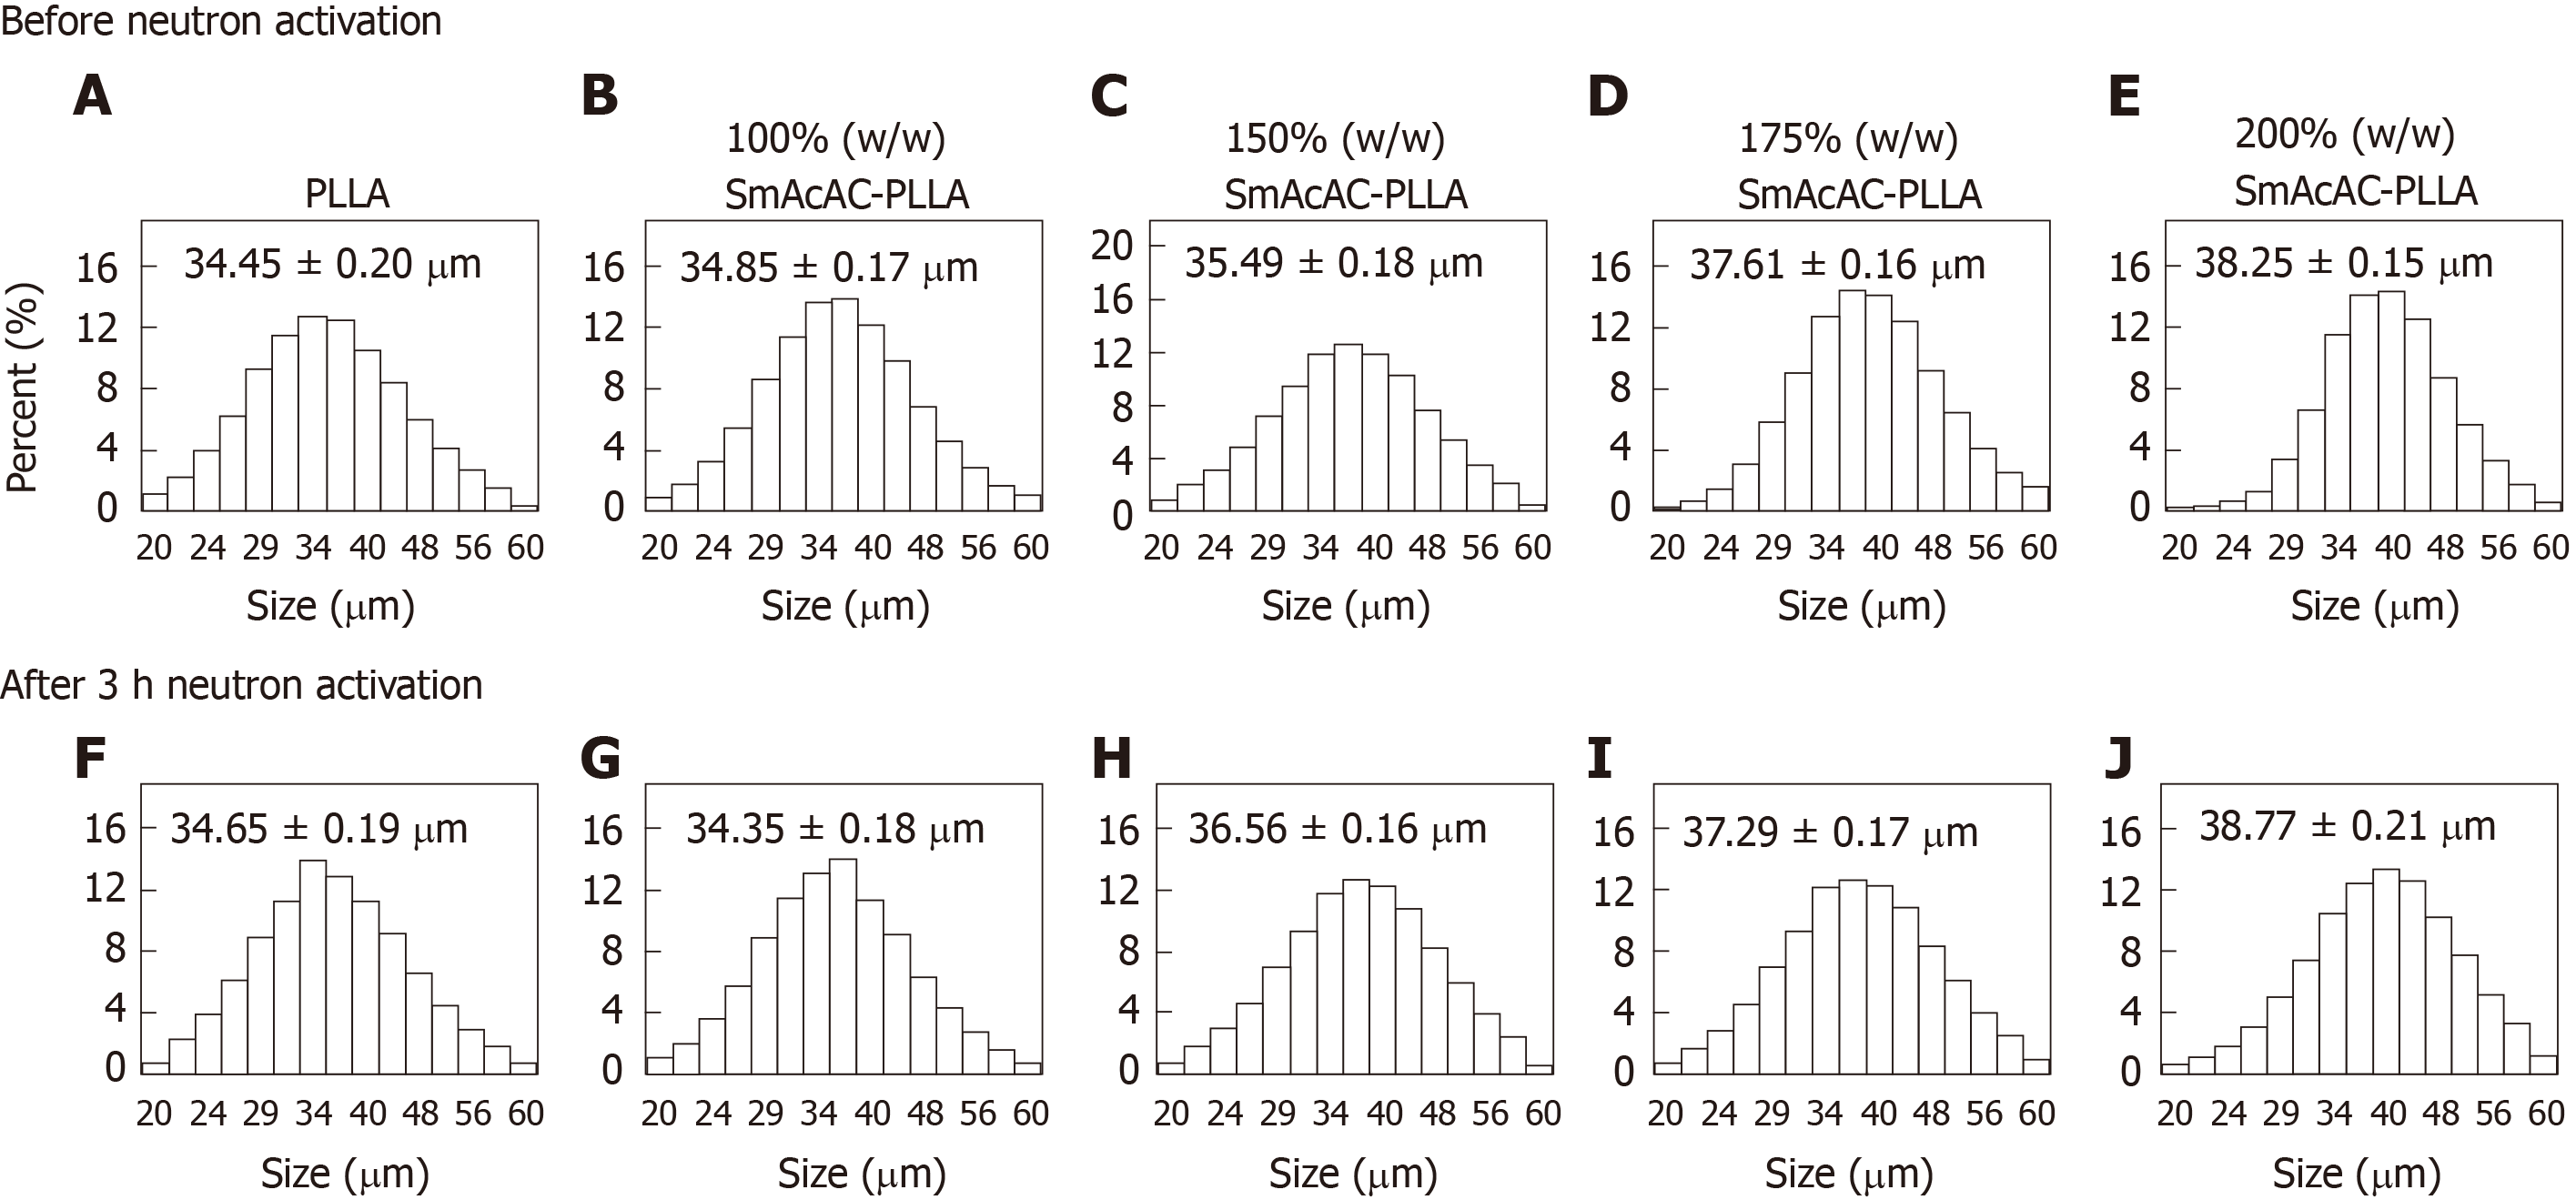
Figure 4 Particle size distribution of the poly-L-lactic acid and samarium acetylacetonate- poly-L-lactic acid microspheres before and after 3 h neutron activation.
A-E: Before neutron activation; F-J: After 3 h neutron activation. PLLA: Poly-L-lactic acid; SmAcAc: Samarium acetylacetonate.
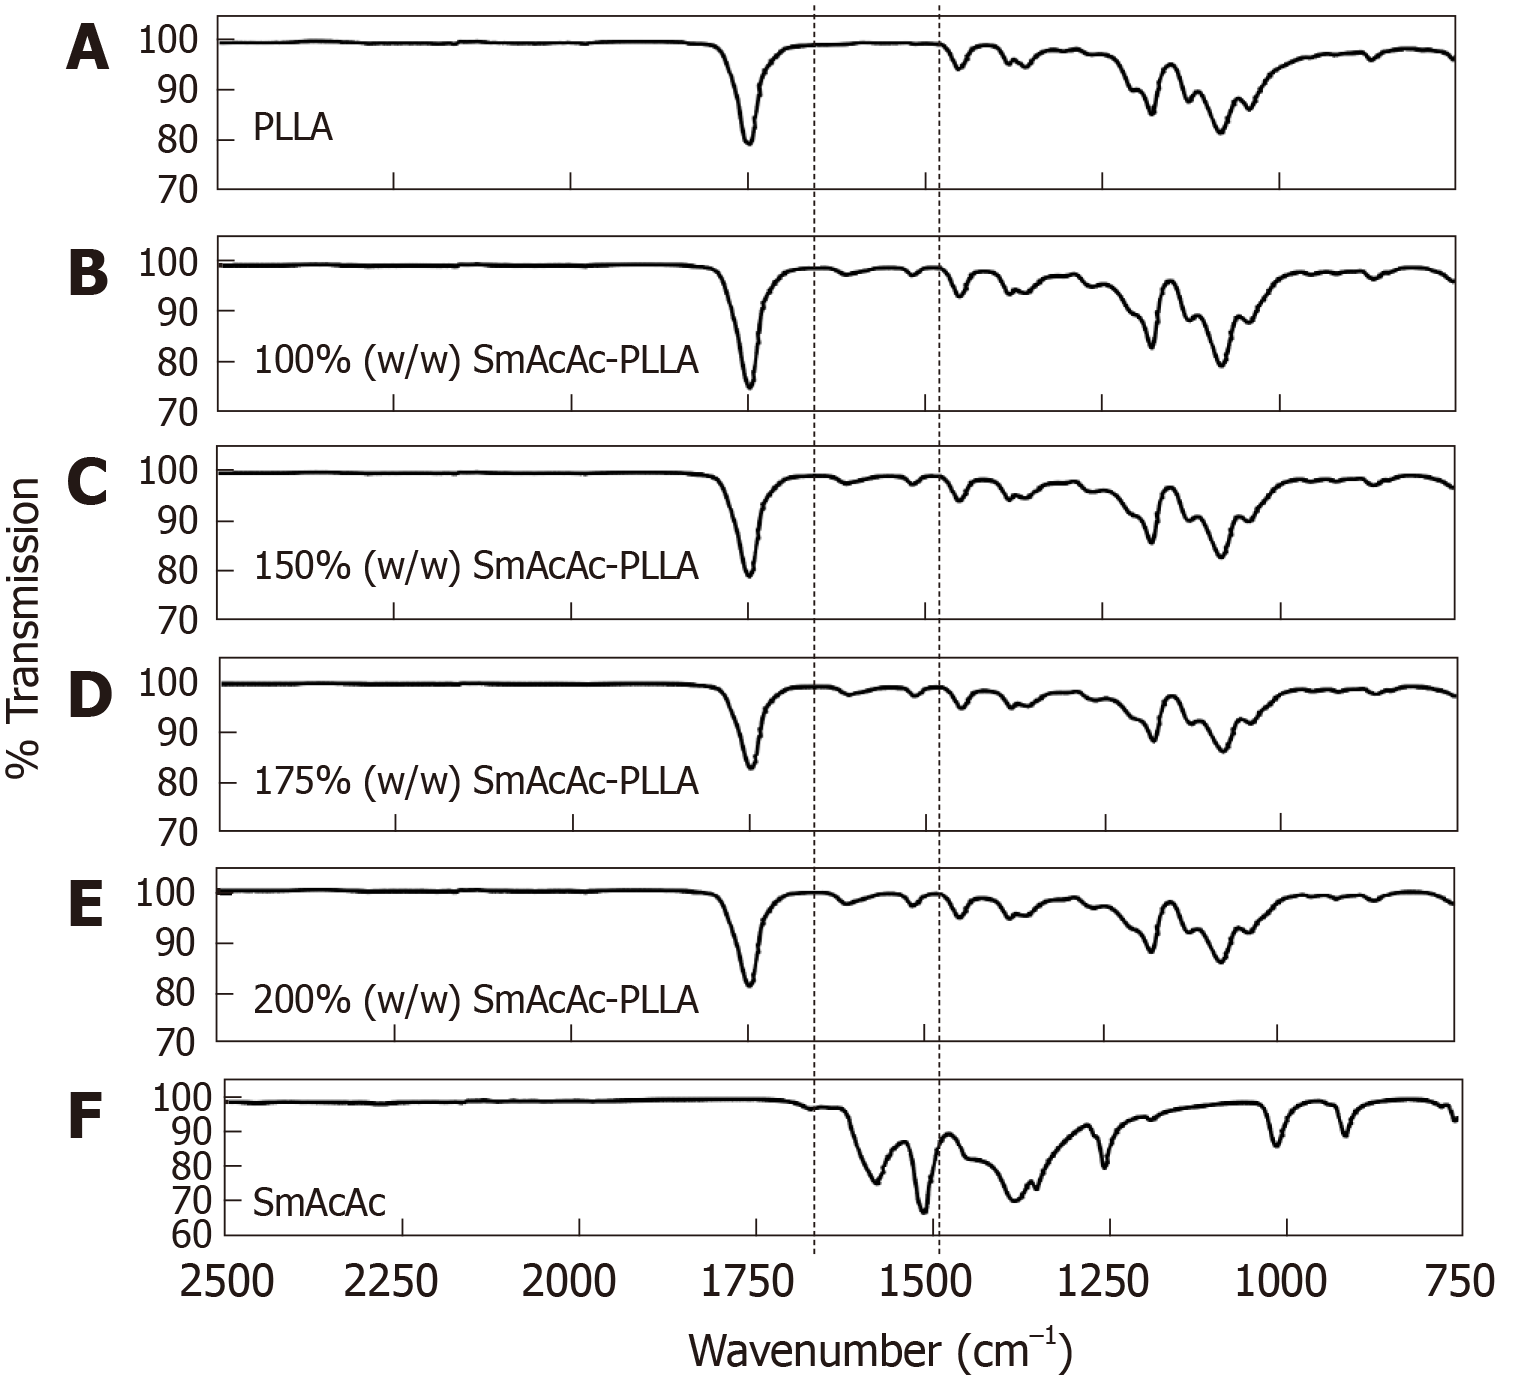
Figure 5 Fourier transform infrared spectroscopy spectrum of the poly-L-lactic acid, samarium acetylacetonate-poly-L-lactic acid microspheres, and samarium-152 acetylacetonate crystal.
A: Fourier transform infrared spectroscopy (FTIR) spectrum of the poly-L-lactic acid; B-E: FTIR spectrum of the samarium acetylacetonate-poly-L-lactic acid microspheres; F: FTIR spectrum of the samarium-152 acetylacetonate crystal. PLLA: Poly-L-lactic acid; SmAcAc: Samarium acetylacetonate.
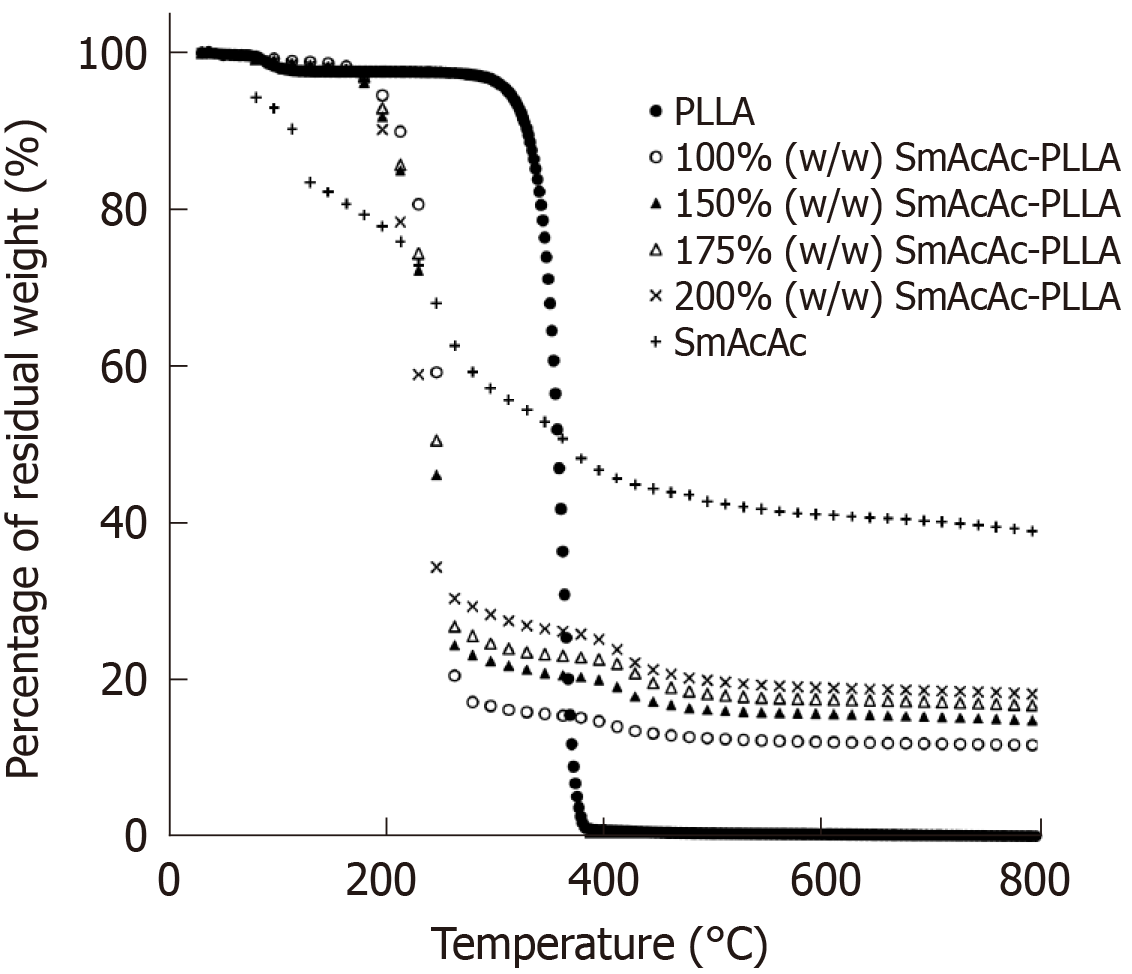
Figure 6 Thermo-gravimetric analysis profiles of poly-L-lactic acid, samarium-152 acetylacetonate, and samarium-152 acetylacetonate-poly-L-lactic acid microspheres.
PLLA: Poly-L-lactic acid; SmAcAc: Samarium acetylacetonate.
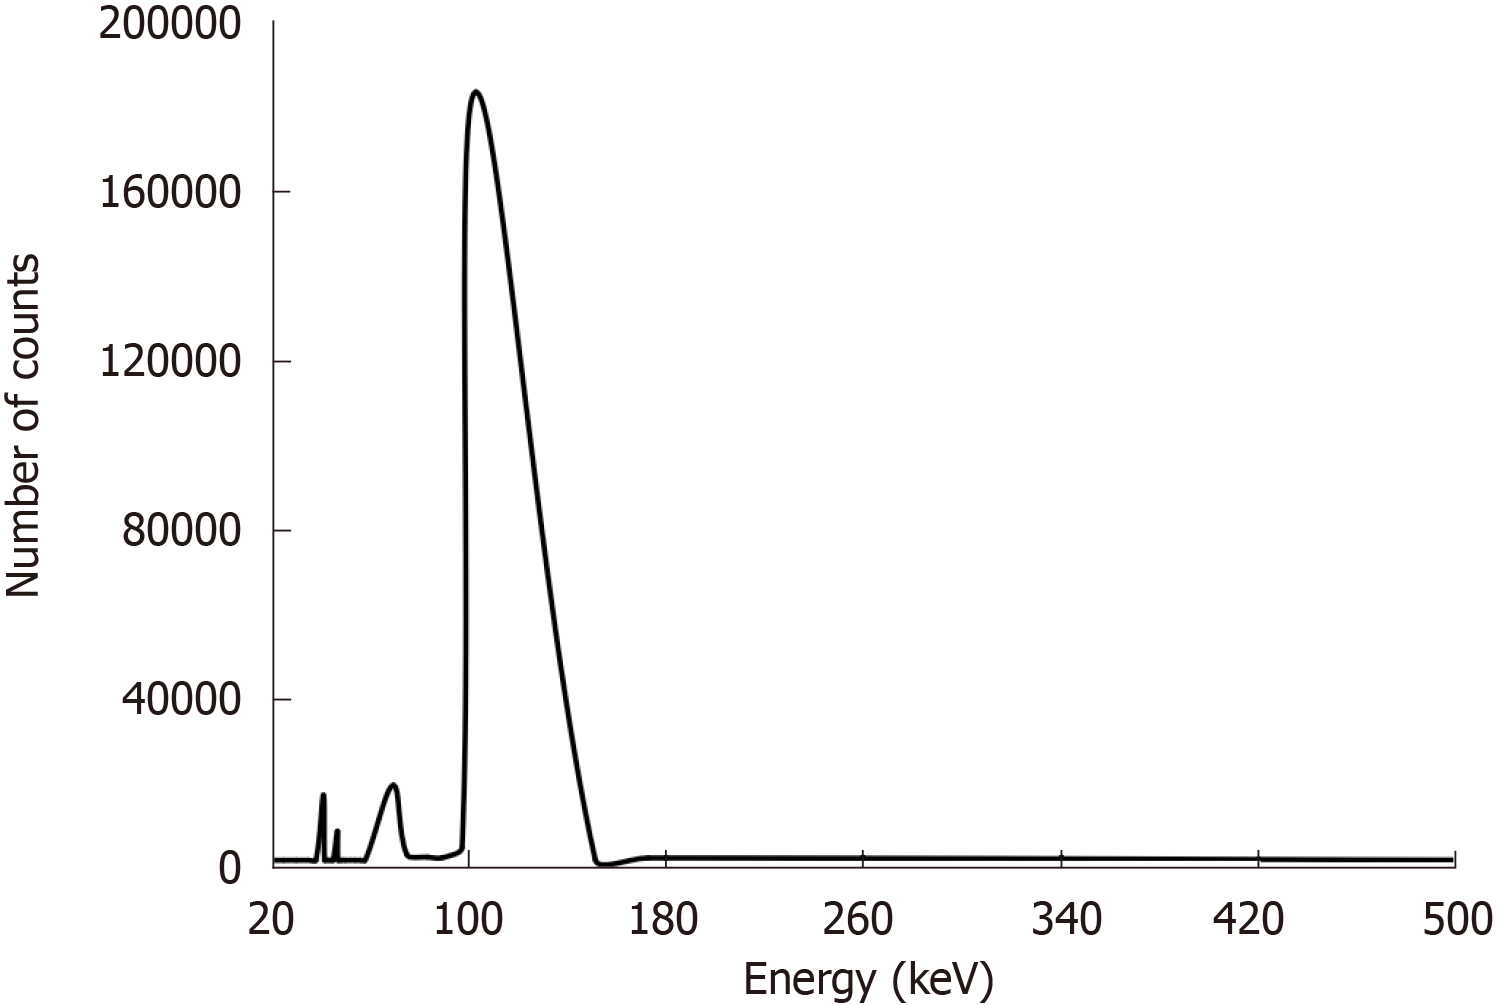
Figure 7 Gamma spectrum of samarium-153 acetylacetonate-poly-L-lactic acid microspheres at 24 h post neutron activation.
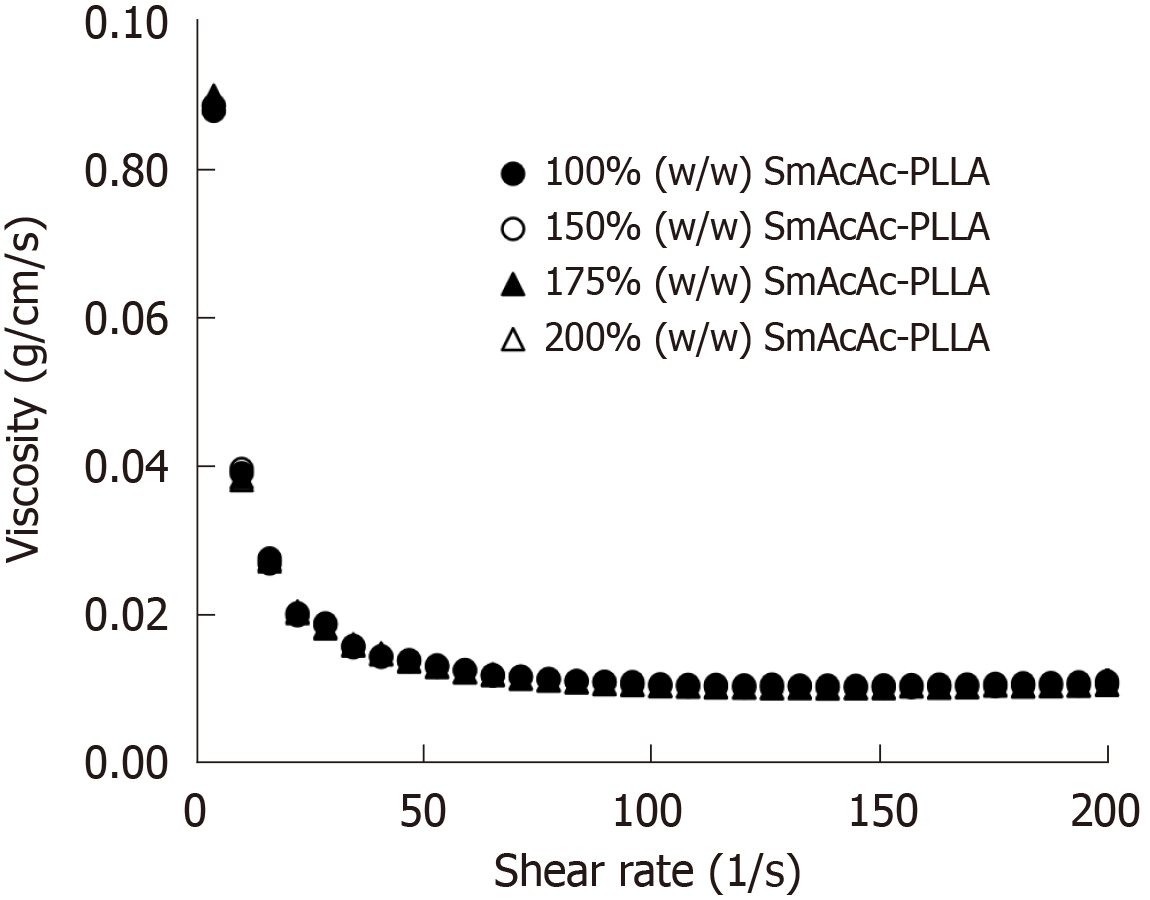
Figure 8 The viscosity of samarium acetylacetonate-poly-L-lactic acid microspheres suspension at various shear rate.
The microspheres suspension (2.5% w/v) were prepared in 0.9% sodium chloride solution at 37 °C. PLLA: Poly-L-lactic acid; SmAcAc: Samarium acetylacetonate.
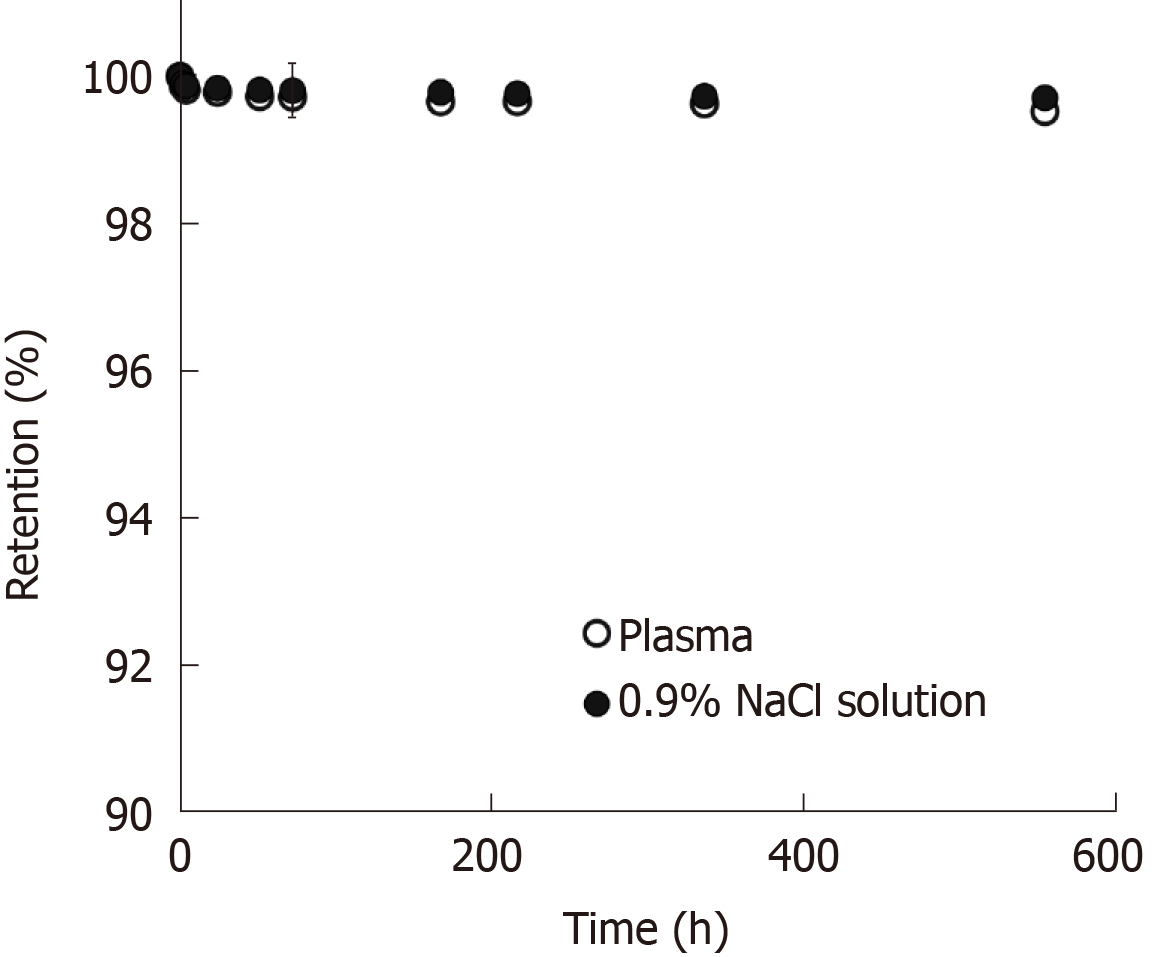
Figure 9 Retention (%) of samarium-153 in neutron-activated samarium-153 acetylacetonate-poly-L-lactic acid microspheres suspended in 0.
9% sodium chloride solution and human blood plasma over a duration of 550 h. NaCl: Sodium chloride.
- Citation: Wong YH, Tan HY, Kasbollah A, Abdullah BJJ, Acharya RU, Yeong CH. Neutron-activated biodegradable samarium-153 acetylacetonate-poly-L-lactic acid microspheres for intraarterial radioembolization of hepatic tumors. World J Exp Med 2020; 10(2): 10-25
- URL: https://www.wjgnet.com/2220-315X/full/v10/i2/10.htm
- DOI: https://dx.doi.org/10.5493/wjem.v10.i2.10


