Copyright
©The Author(s) 2019.
World J Crit Care Med. Nov 19, 2019; 8(7): 106-119
Published online Nov 19, 2019. doi: 10.5492/wjccm.v8.i7.106
Published online Nov 19, 2019. doi: 10.5492/wjccm.v8.i7.106
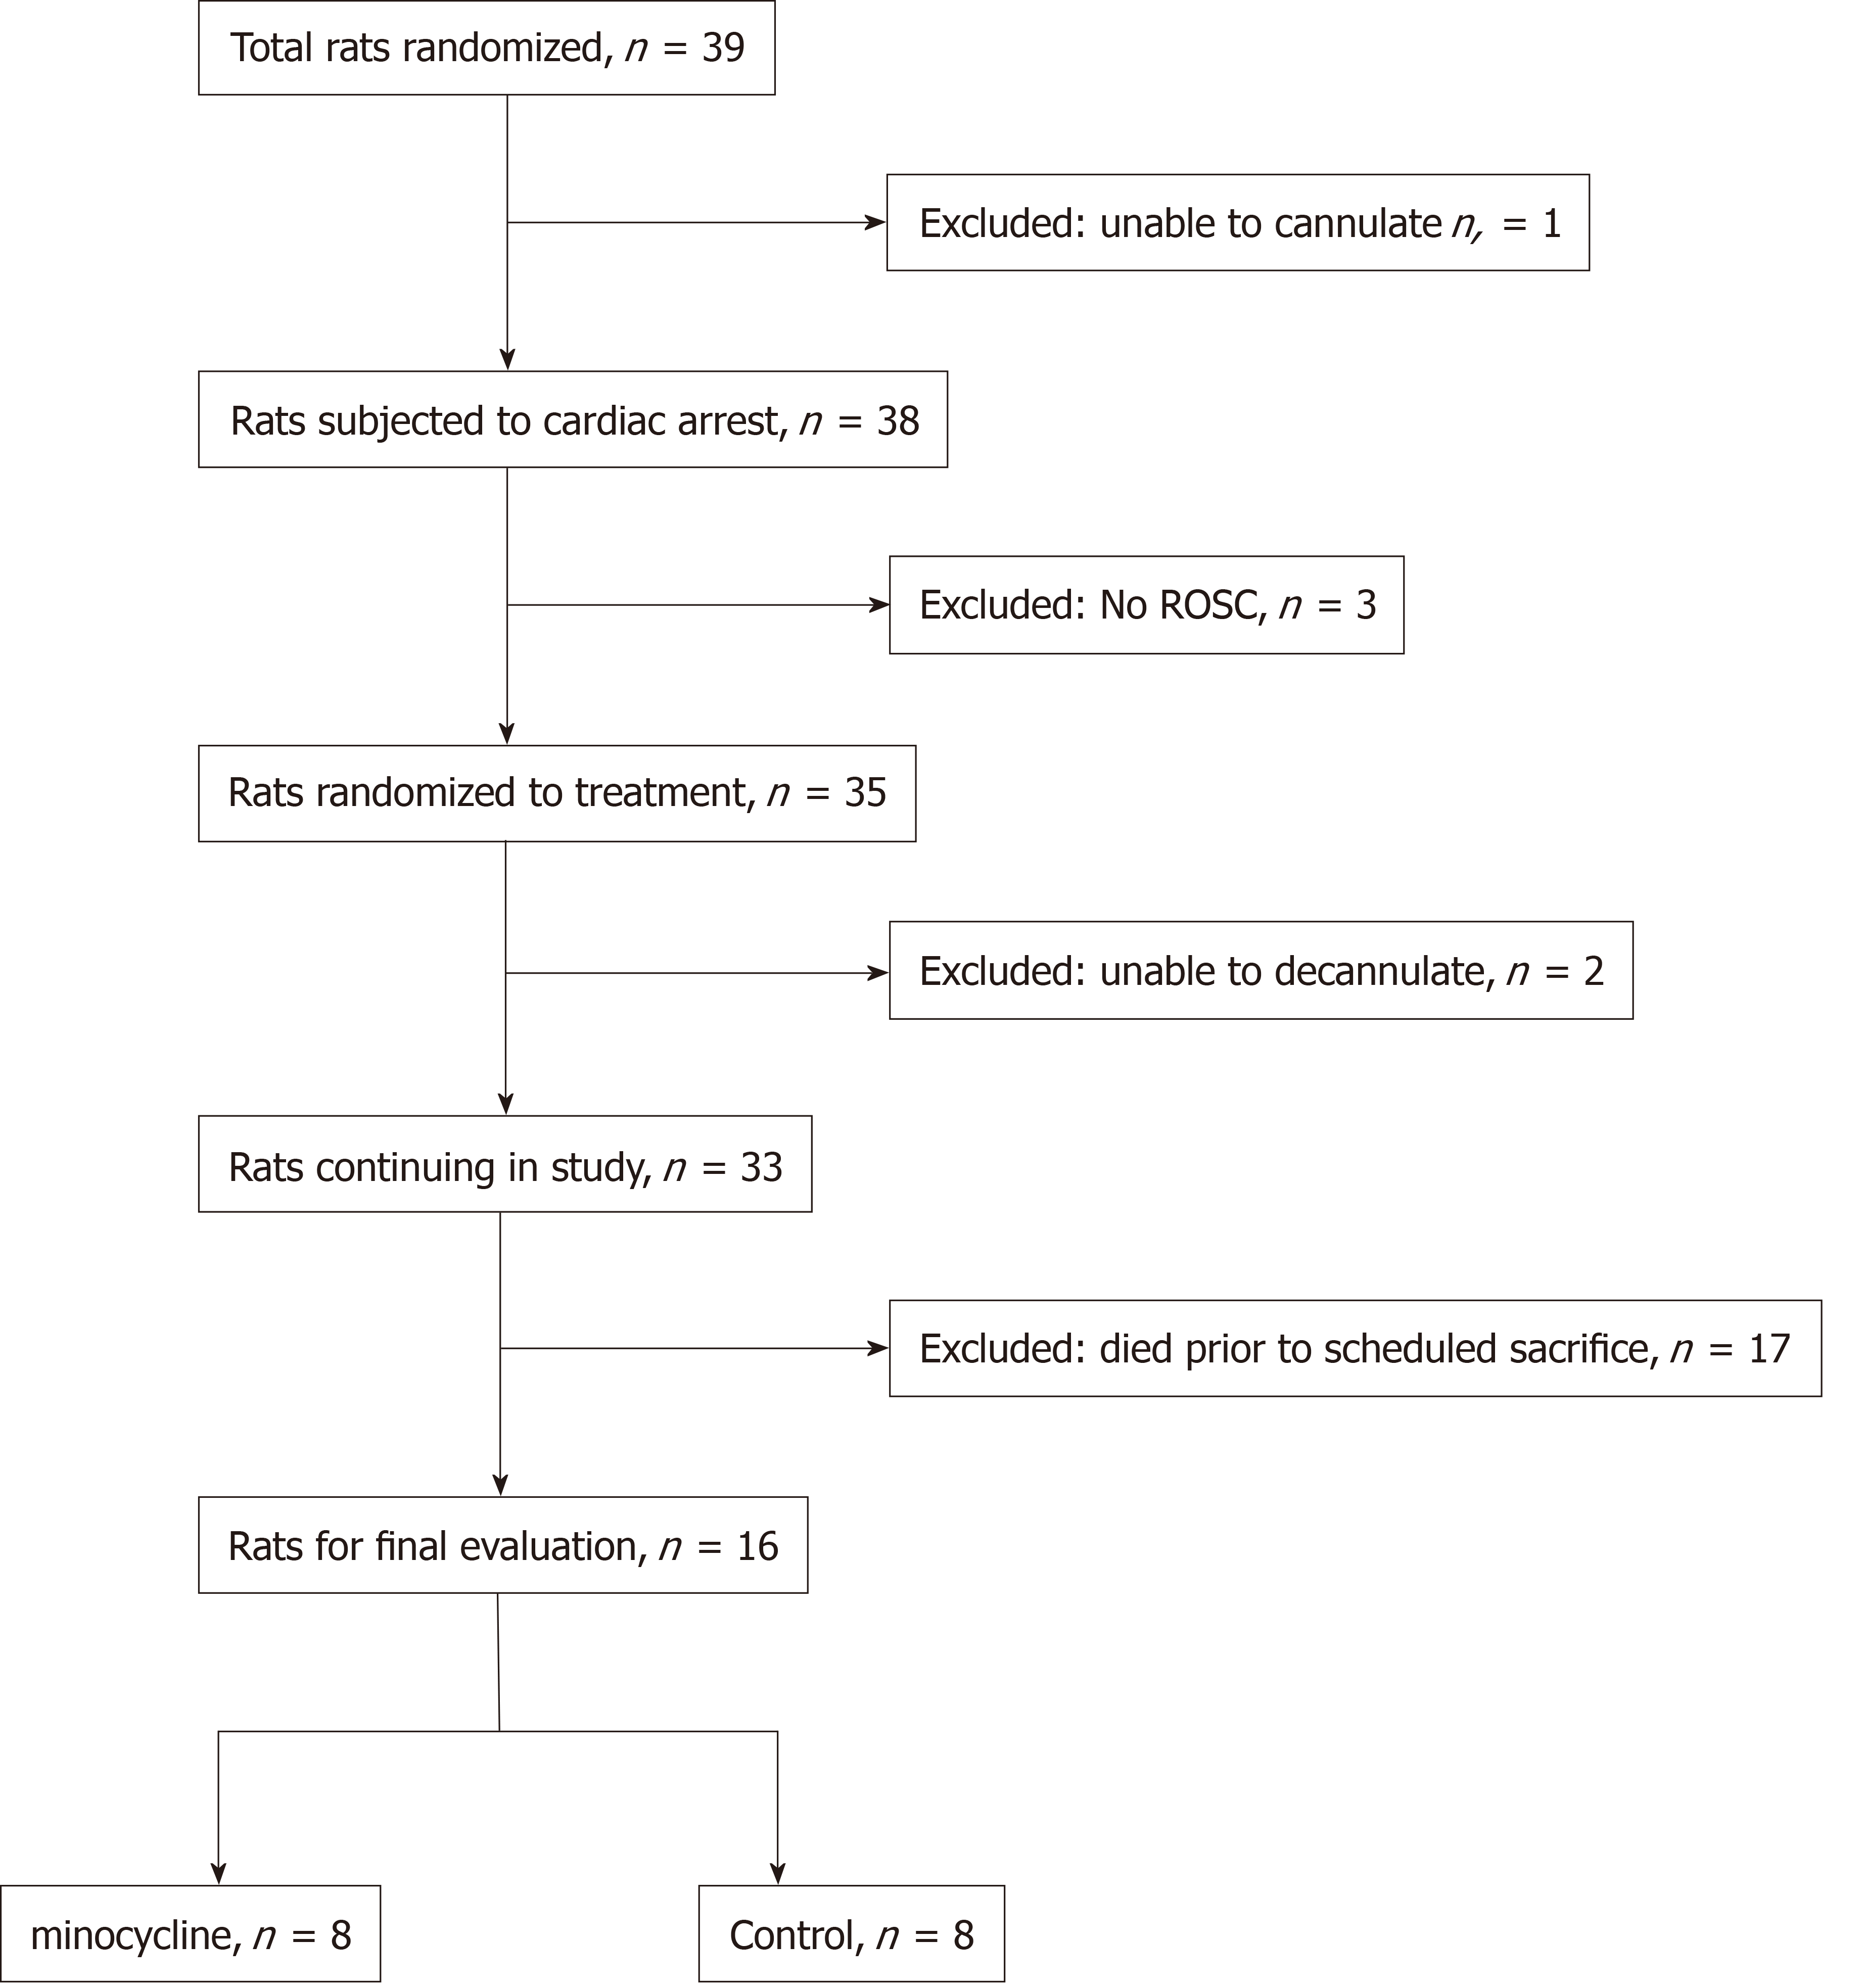
Figure 1 A flow-chart of the study.
Please refer to the text for details on randomization protocol. ROSC: Return of spontaneous circulation.
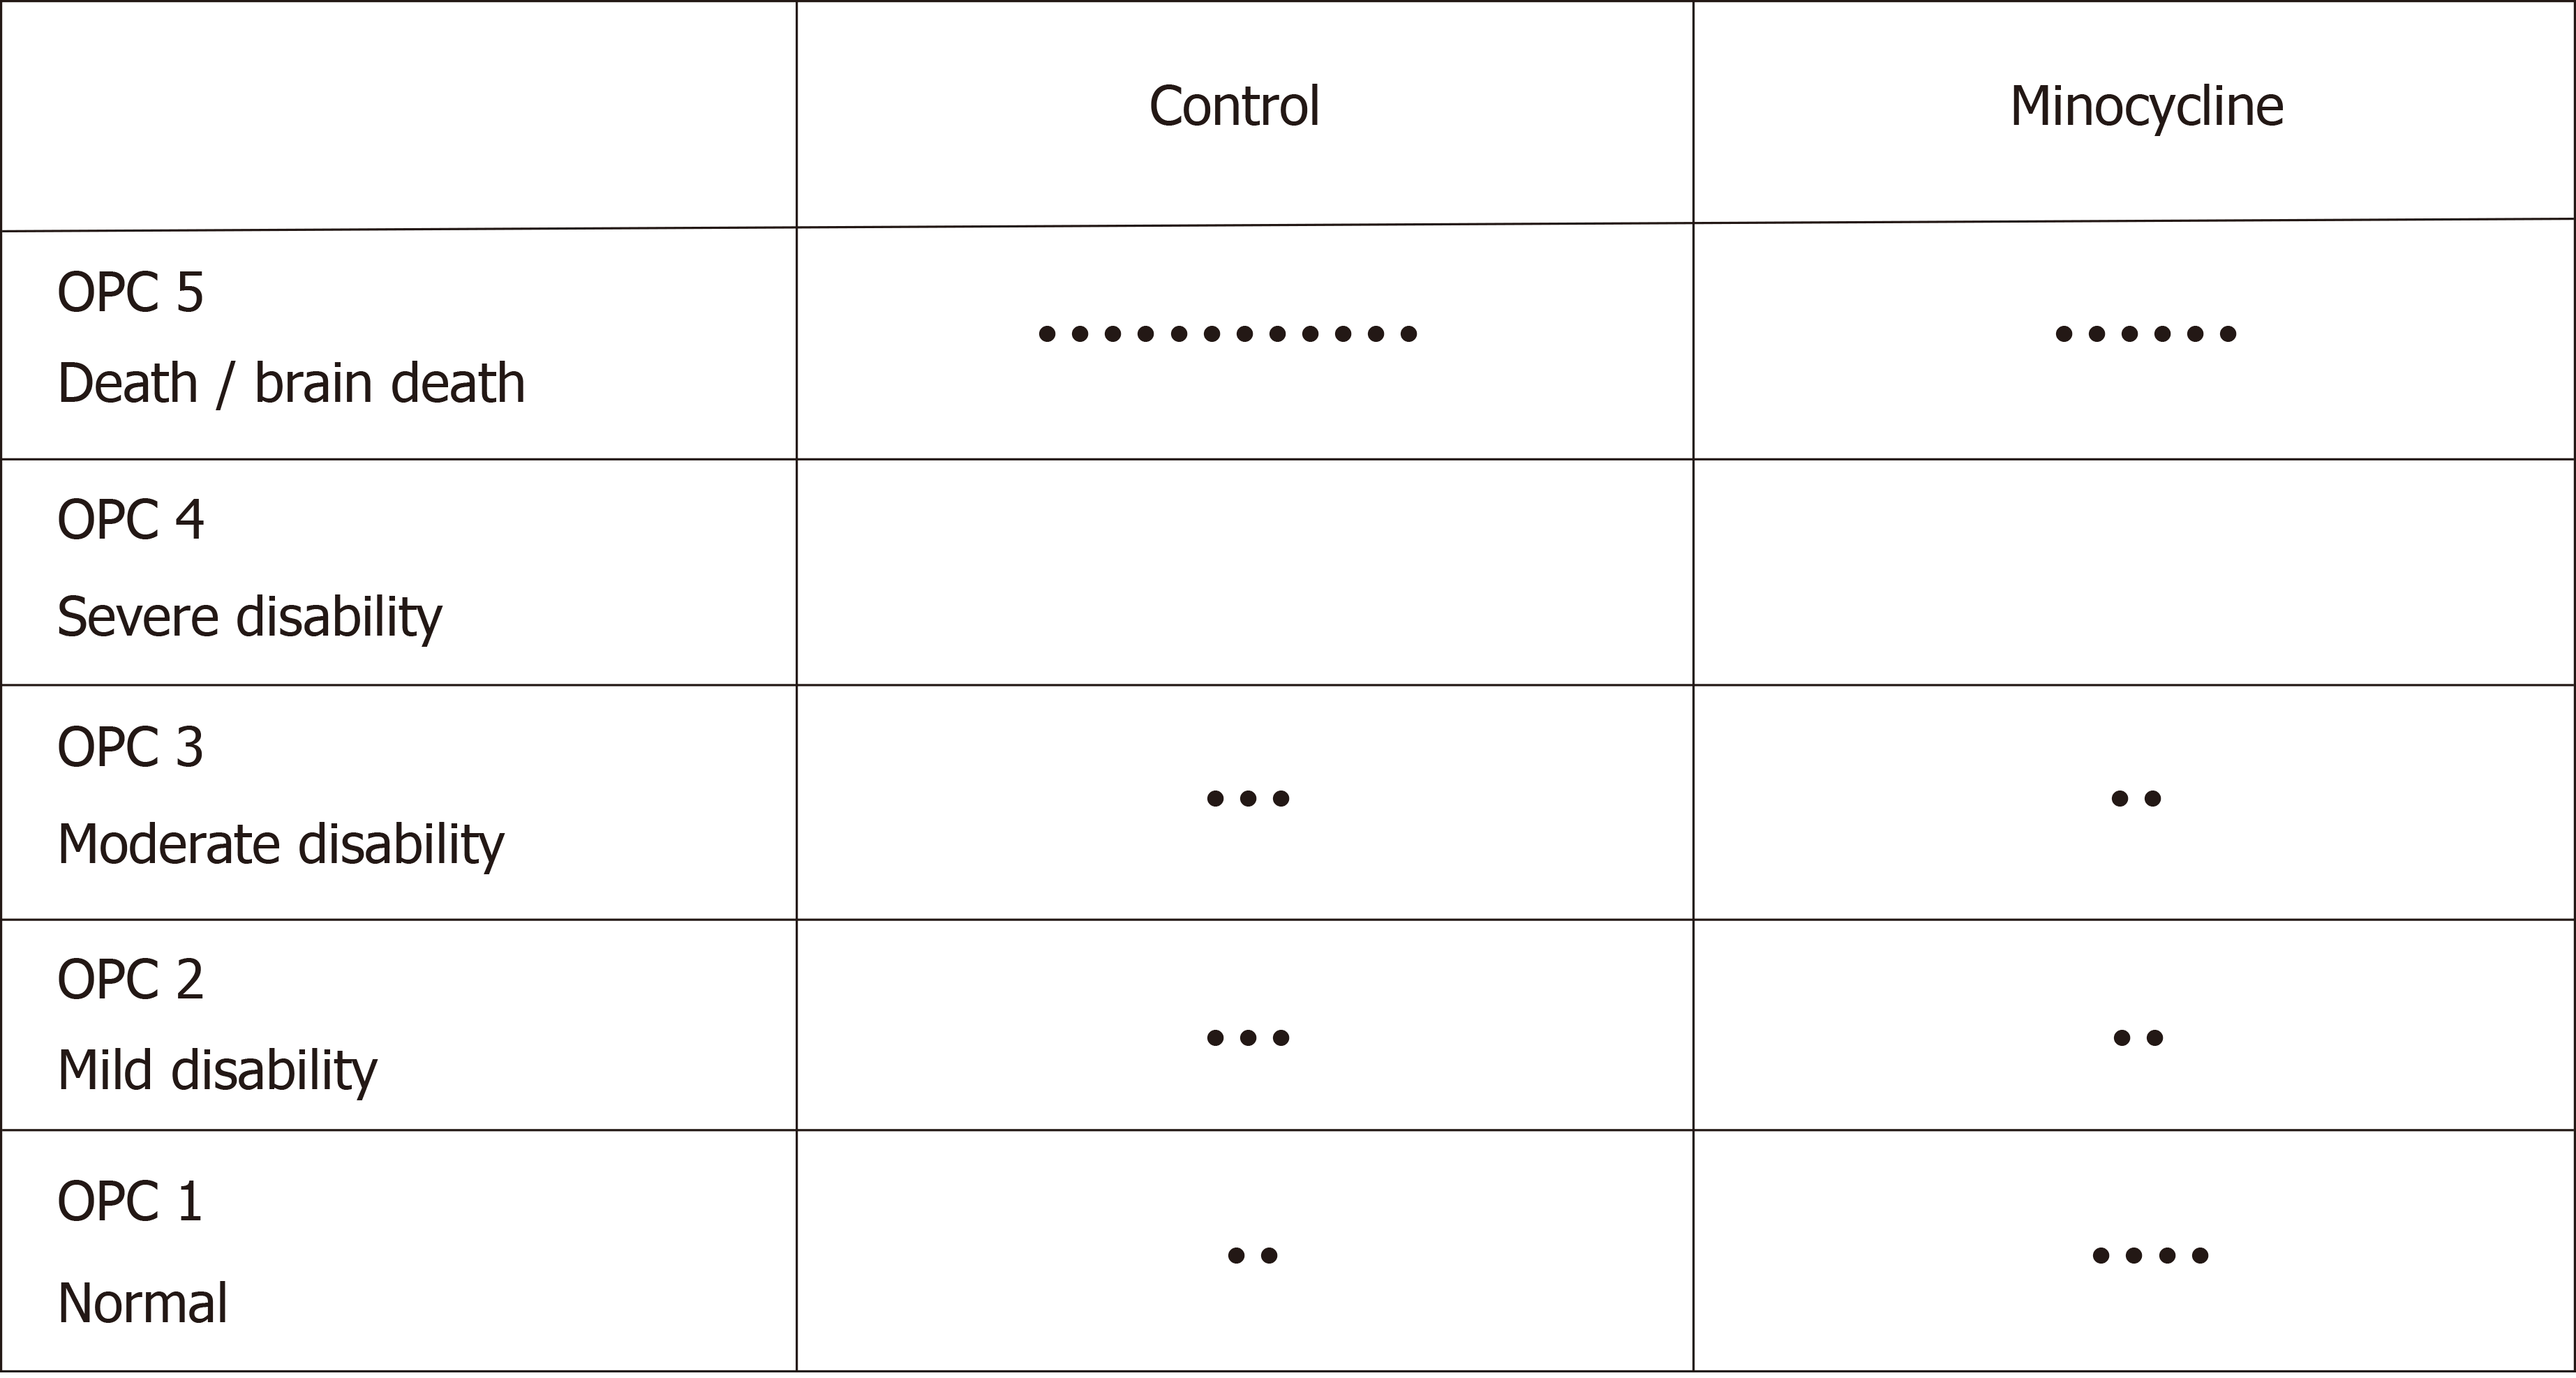
Figure 2 Overall performance categories after cardiac arrest.
Each dot represents one rat. No difference between groups. OPC: Overall performance category.
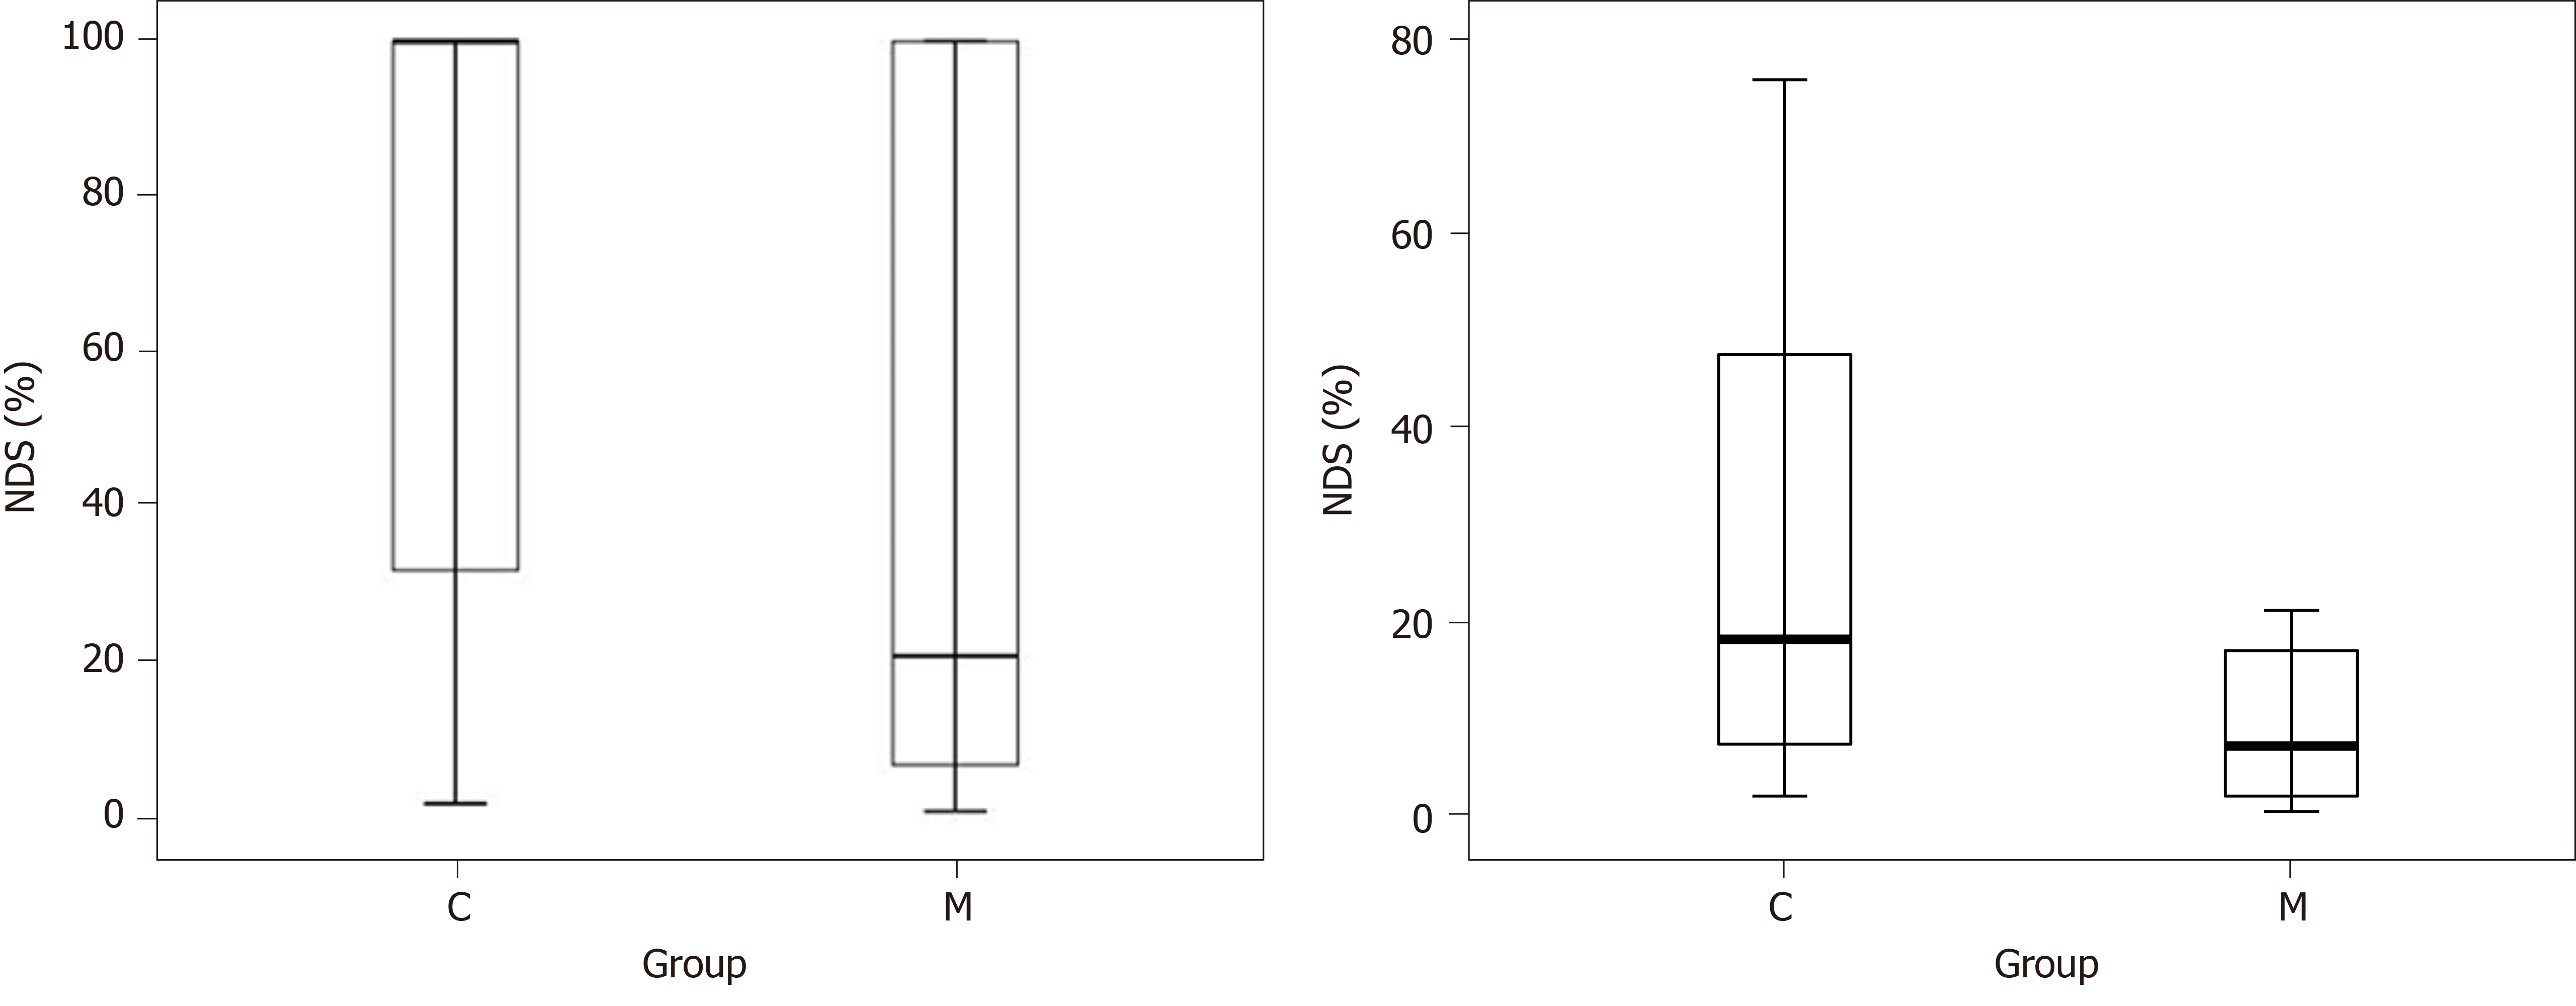
Figure 3 Neurologic deficit score at 72 h in all rats studied (left panel) and in survivors only (right panel).
Boxes represent interquartile ranges. The line across each box indicates the median, and the whiskers are the highest and lowest values. No differences between groups. C: Control group; M: Minocycline group; NDS: Neurologic deficit score.
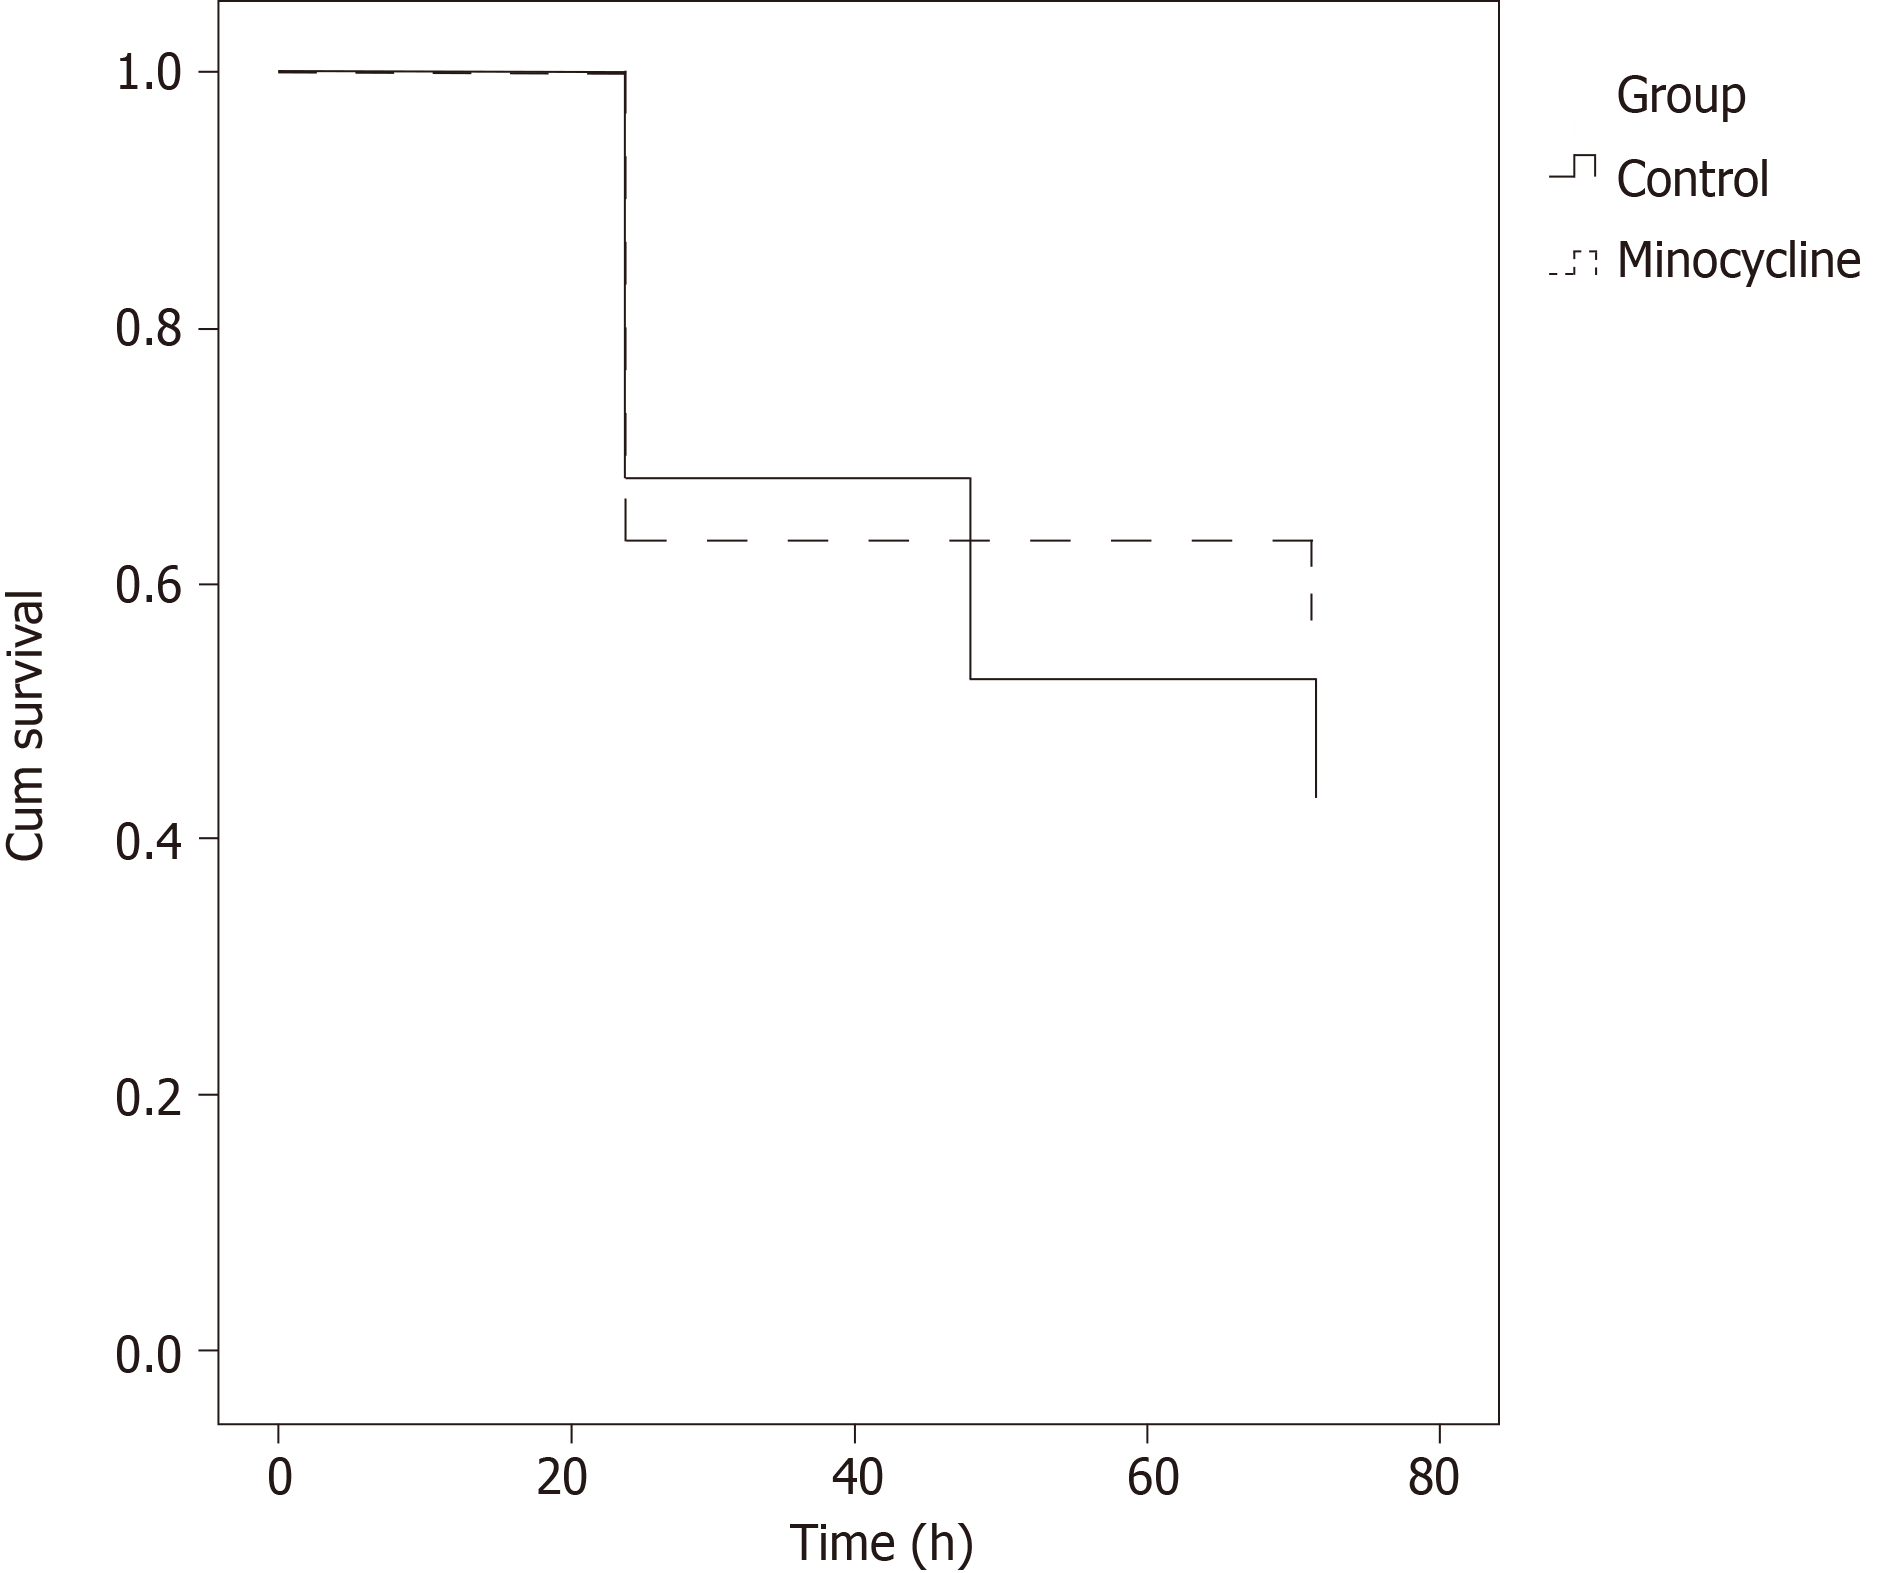
Figure 4 Kaplan-Maier survival plot.
No differences between groups.
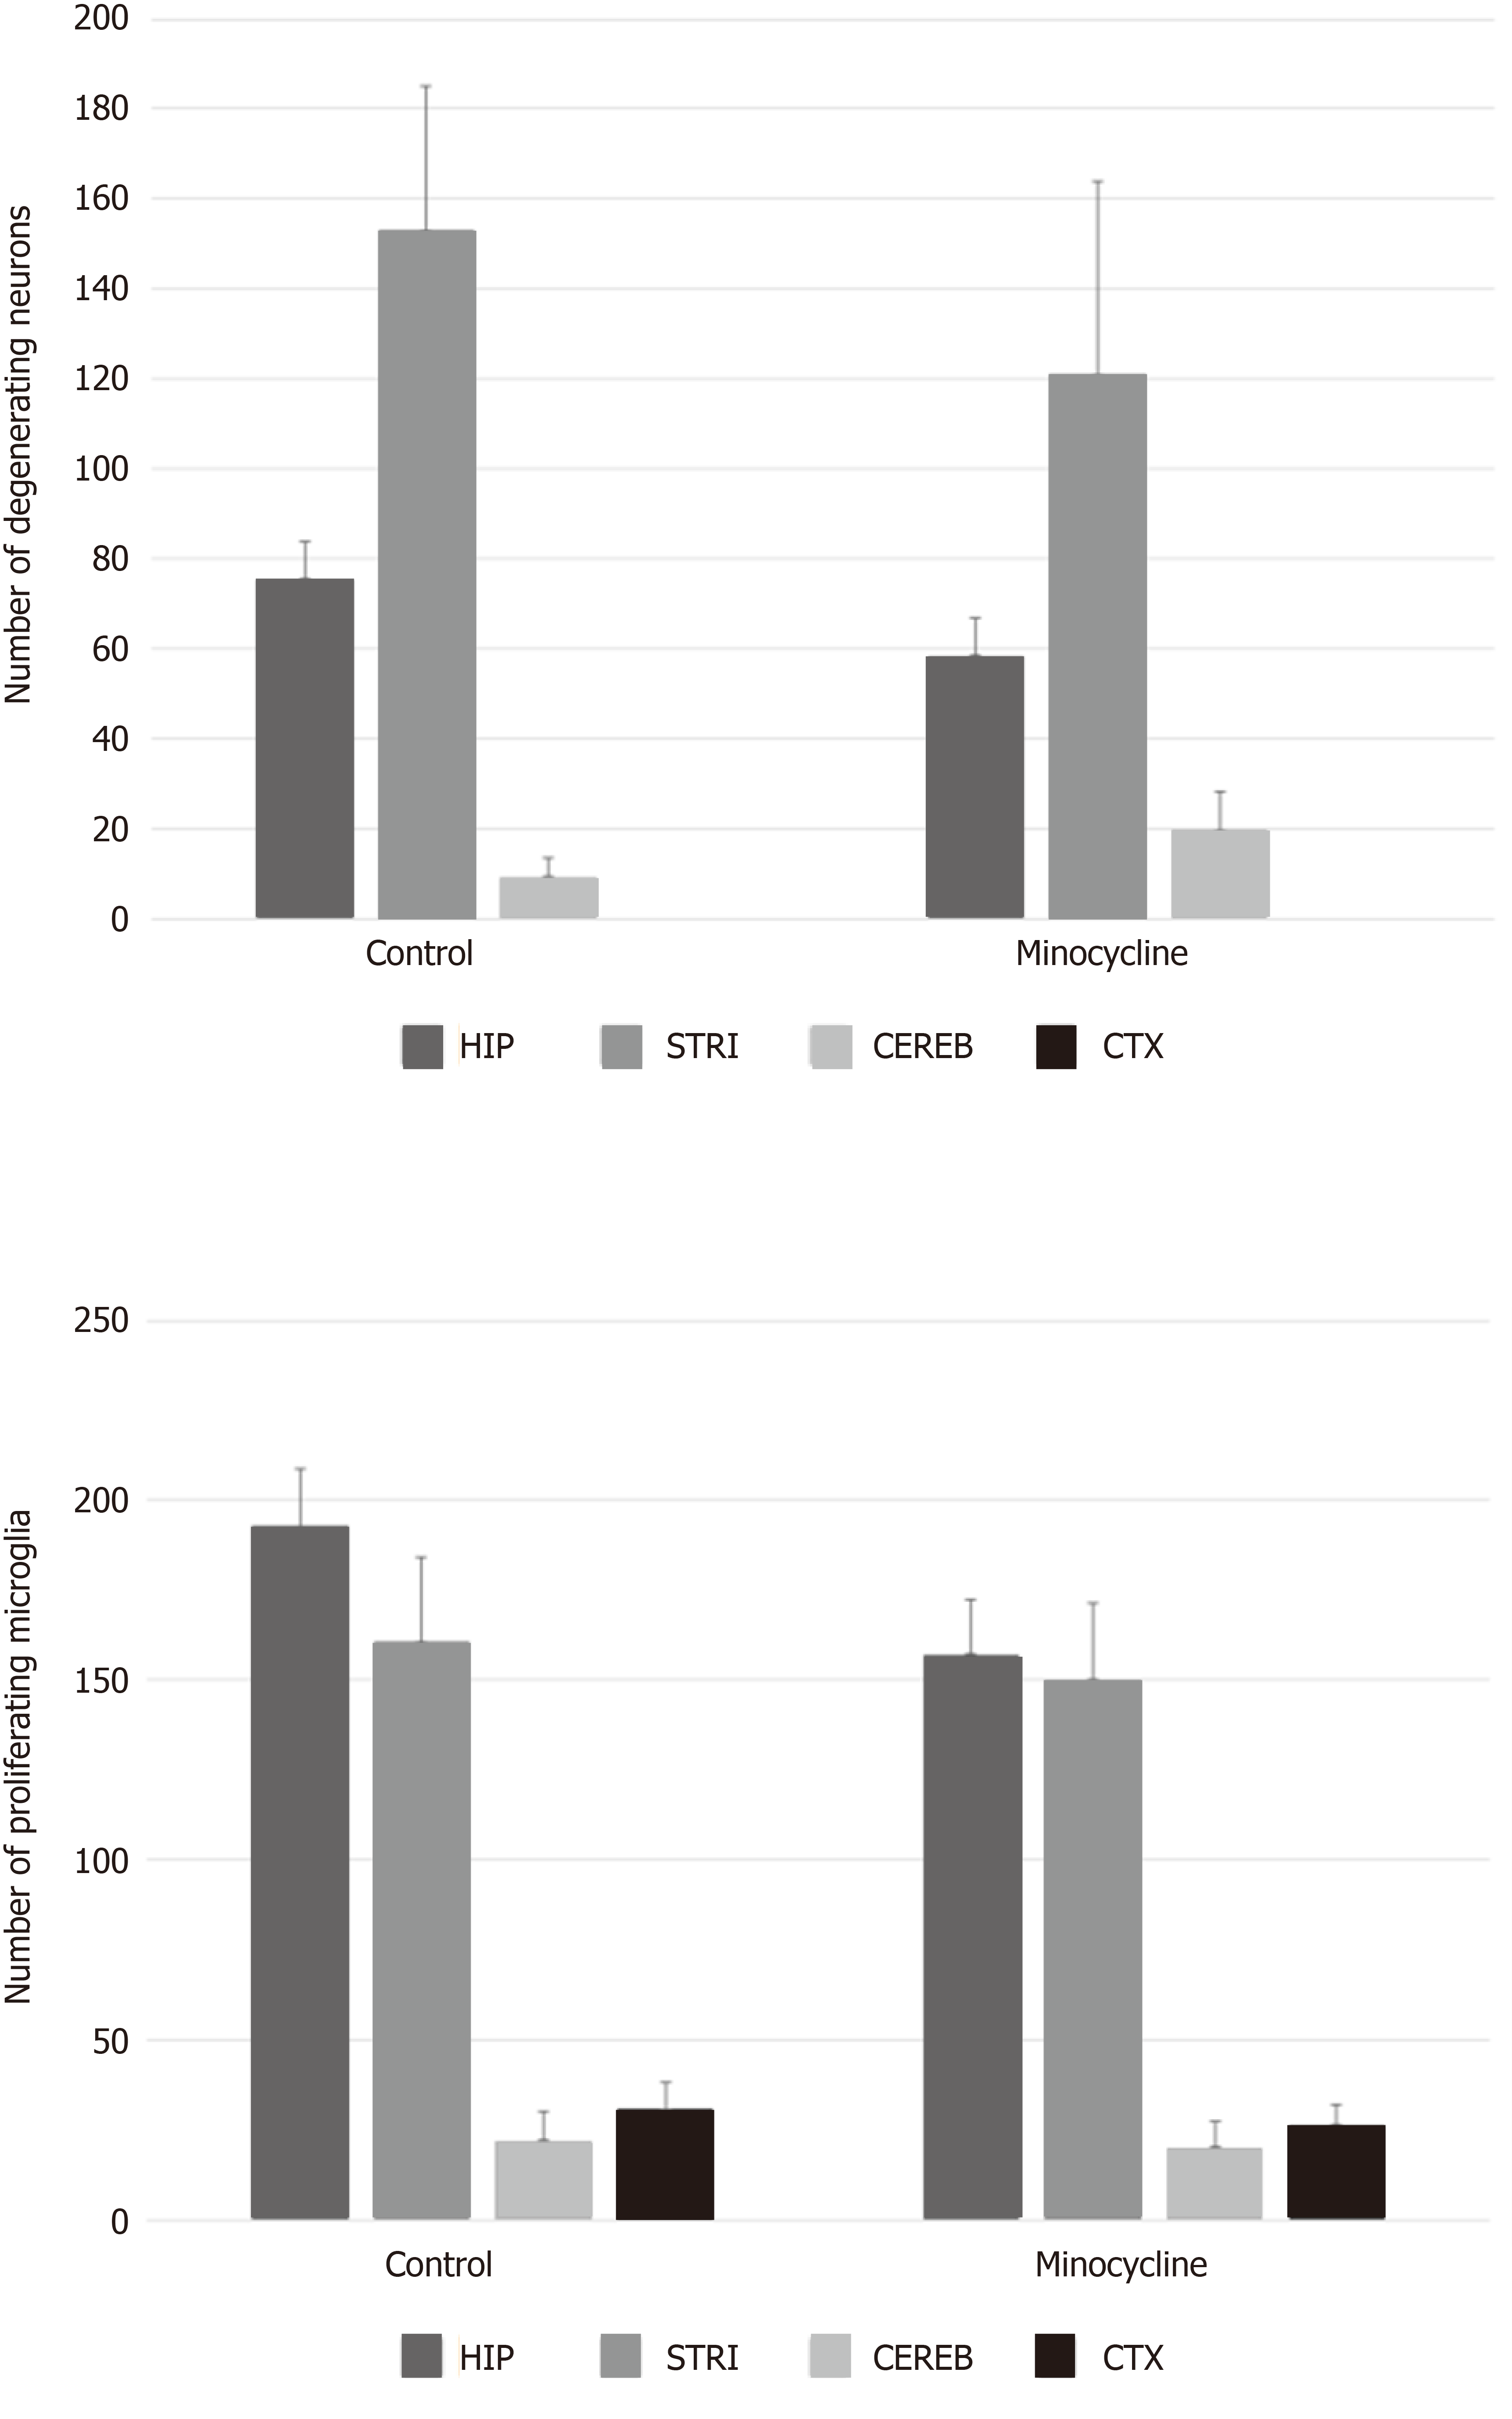
Figure 5 Regional neuronal degeneration (top) and microglial proliferation (bottom) after cardiac arrest.
Regional neuronal loss and microglial proliferation after cardiac arrest in controls and rats treated with minocycline were not different between groups in any region at 72 h. HIP: Hippocampus; STRI: Striatum; CEREB: Cerebellum; CTX: Cortex. Mean ± SEM values are displayed.
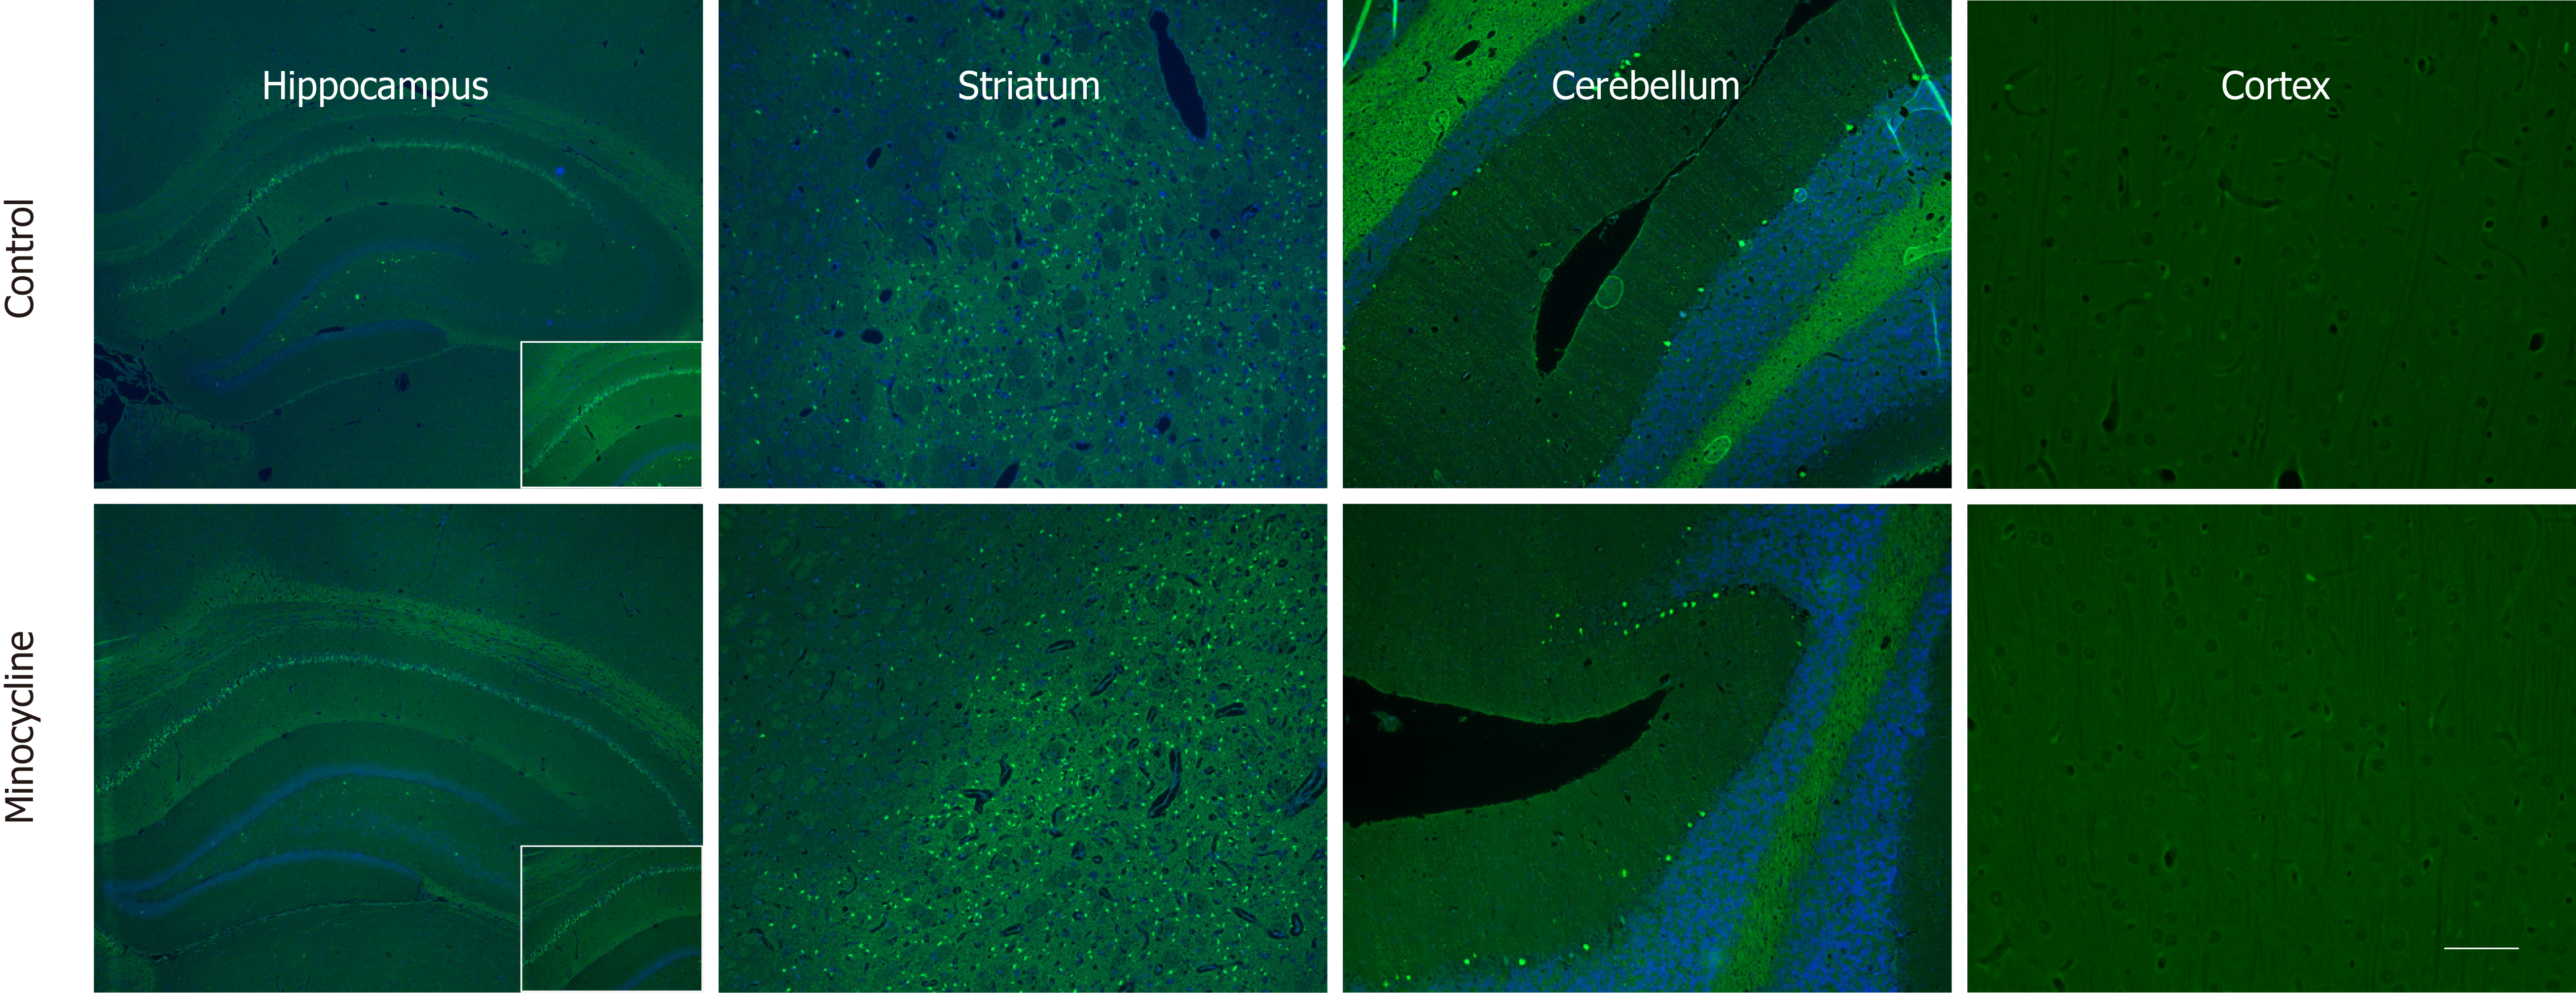
Figure 6 Representative samples of neuronal degeneration after 6 min ventricular fibrillation cardiac arrest at 72 h.
Blue staining is 4',6-diamidino-2-phenylindole, visualizing neurons, and green staining is Fluoro-Jade C, visualizing degenerating neurons. Hippocampal neuronal loss is visible in the cardiac arrest 1 sector and in hilar region of the dentate gyrus. The inset shows the mid-section of cardiac arrest 1 in closer detail. Marked neuronal degeneration of the medium spiny neurons is seen in the striatum. Selectively vulnerable neuronal loss of Purkinje neurons visualized in the cerebellum. No neurodegeneration is observed in the cortex. Magnification × 10 except the panoramic view of the hippocampus, magnification × 4. The scale bars in the far left and far right lower panels represent 10 µm.
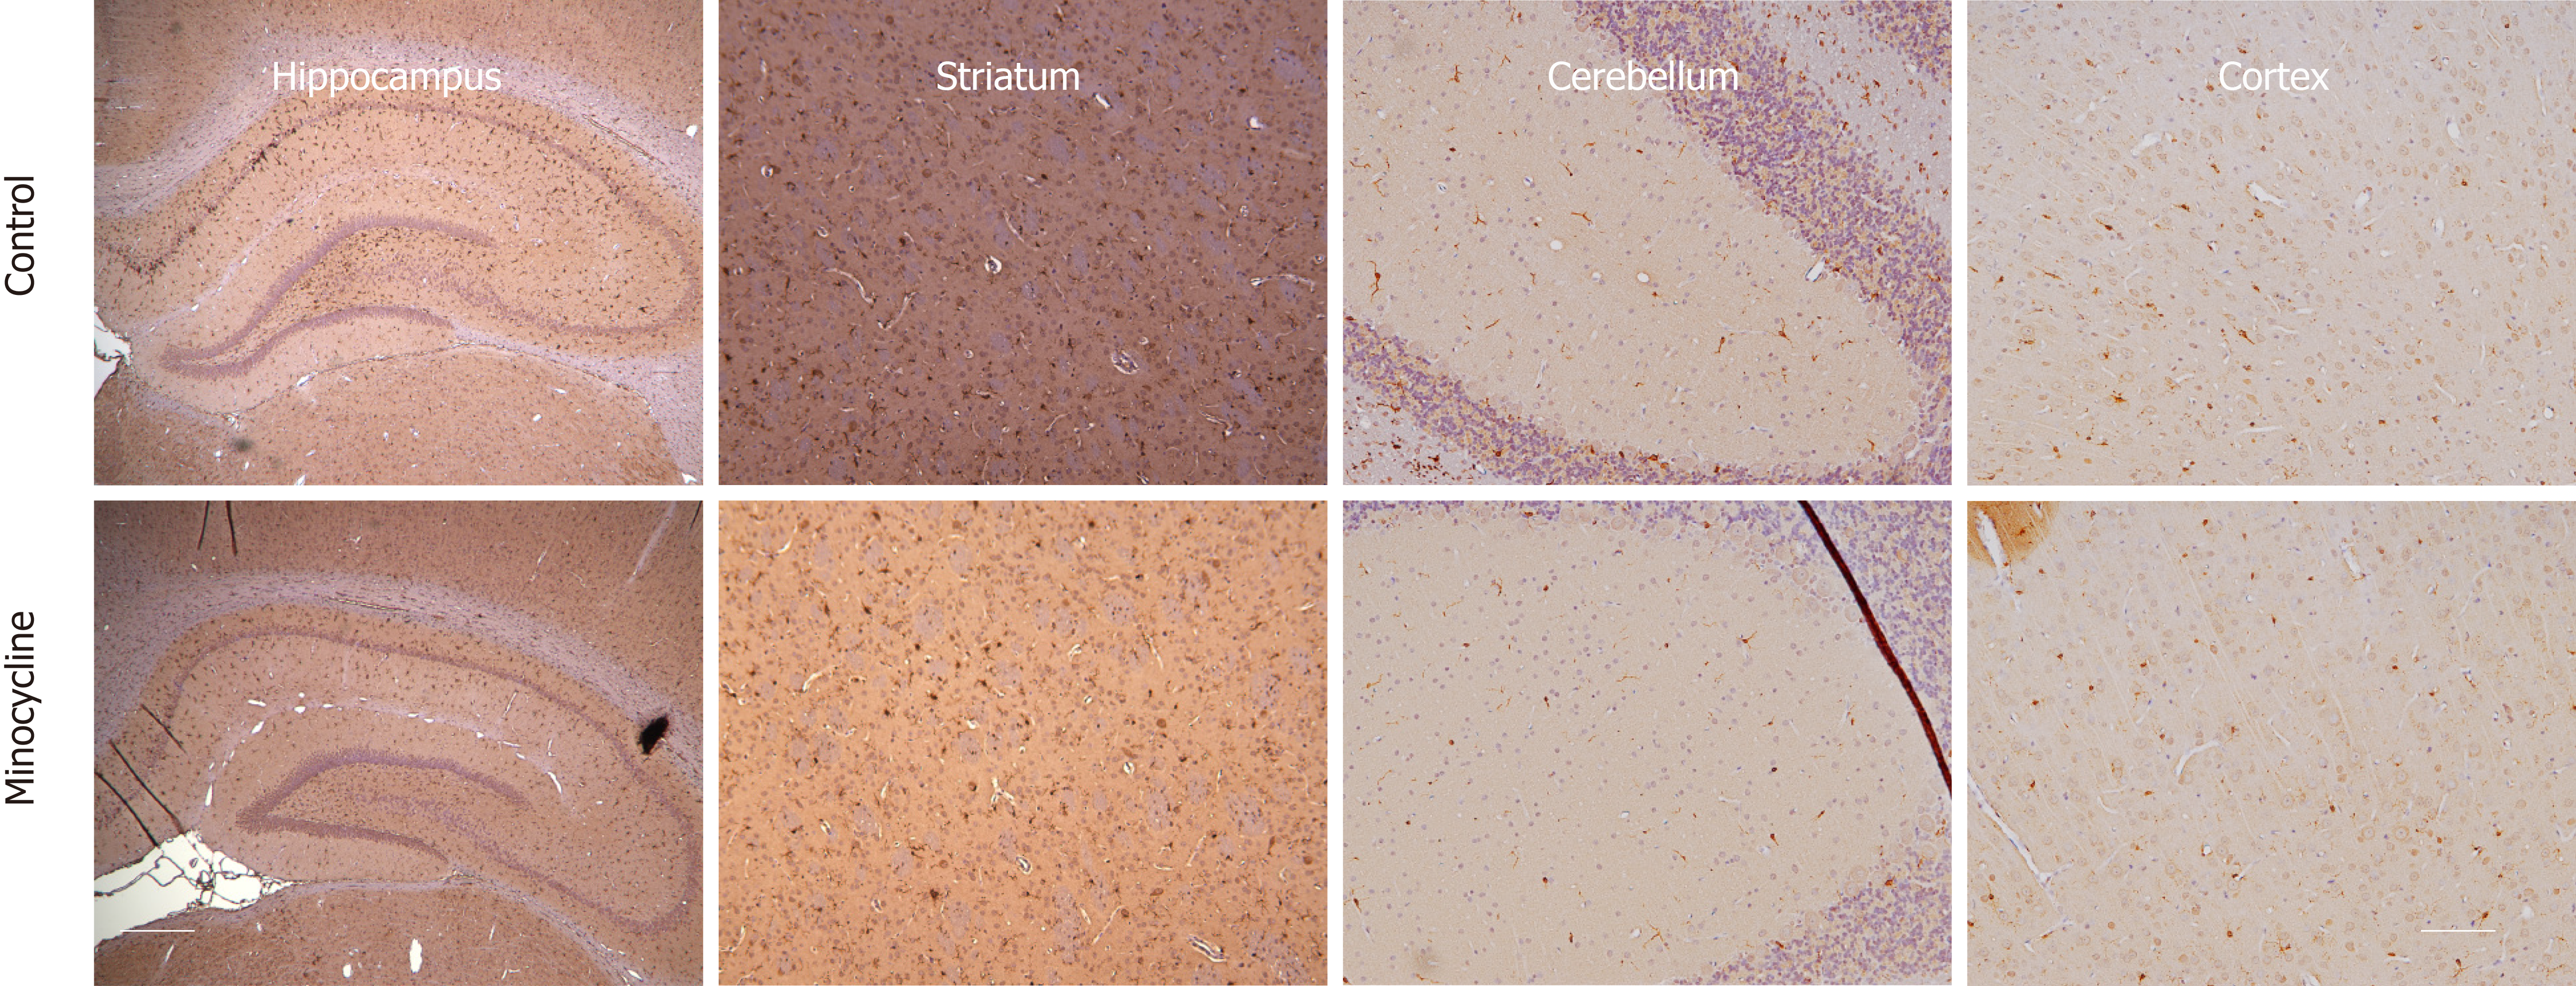
Figure 7 Representative samples of microglial activation and proliferation after 6 min ventricular fibrillation cardiac arrest at 72 h.
Sections are stained with hematoxylin. Brown staining is anti-Iba-1 staining, visualizing microglia, counterstained with diaminobenzamide. Magnification × 10. The scale bars in the far left and far right lower panels represent 10 µm.
- Citation: Janata A, Magnet IA, Schreiber KL, Wilson CD, Stezoski JP, Janesko-Feldman K, Kochanek PM, Drabek T. Minocycline fails to improve neurologic and histologic outcome after ventricular fibrillation cardiac arrest in rats. World J Crit Care Med 2019; 8(7): 106-119
- URL: https://www.wjgnet.com/2220-3141/full/v8/i7/106.htm
- DOI: https://dx.doi.org/10.5492/wjccm.v8.i7.106


