Copyright
©The Author(s) 2019.
World J Crit Care Med. Jul 31, 2019; 8(4): 36-48
Published online Jul 31, 2019. doi: 10.5492/wjccm.v8.i4.36
Published online Jul 31, 2019. doi: 10.5492/wjccm.v8.i4.36
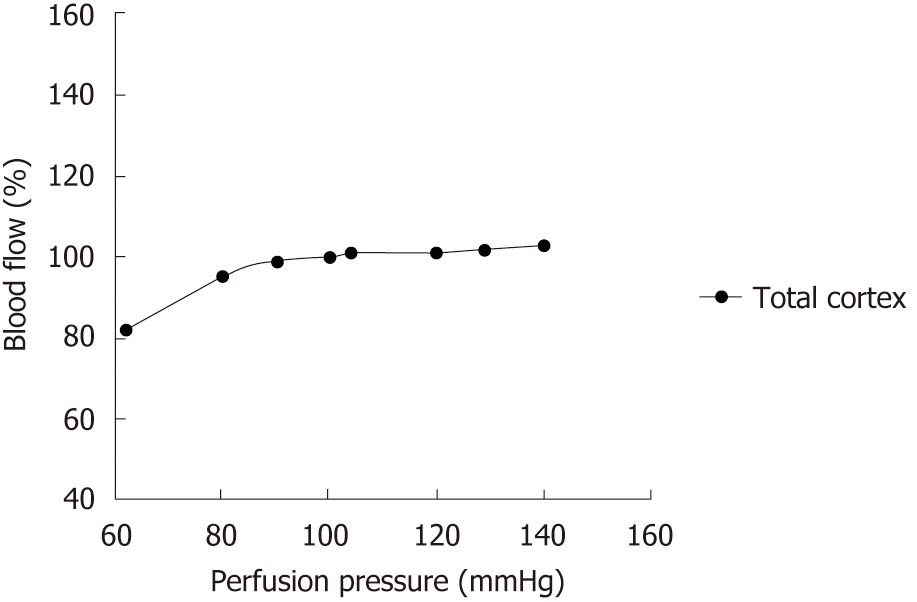
Figure 1 Renal autoregulation.
Total renal blood flow over a range of perfusion pressure. Adapted from[61].
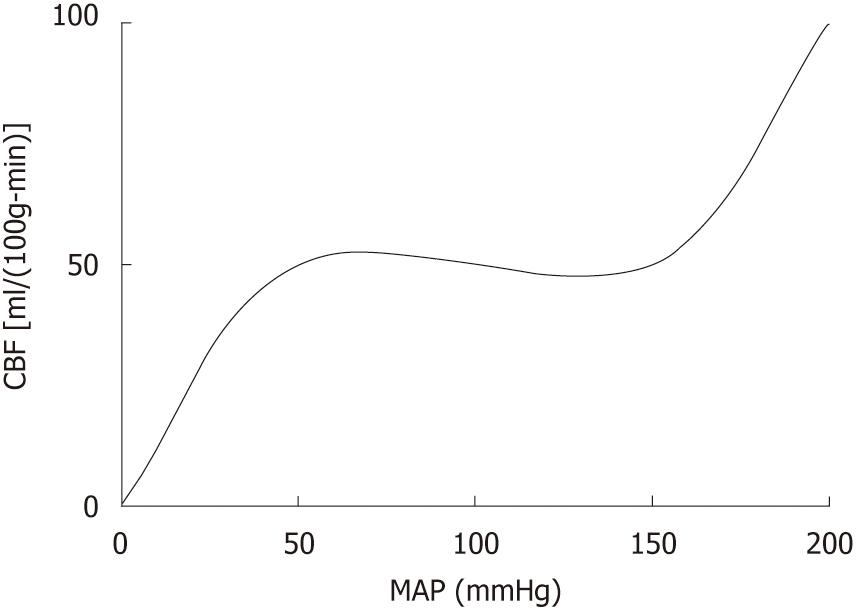
Figure 2 Cerebral autoregulation.
Blood flow over a range of perfusion pressures. Reproduced from[4] with permission of the Society of Photo Optical Instrumentation Engineers (SPIE)
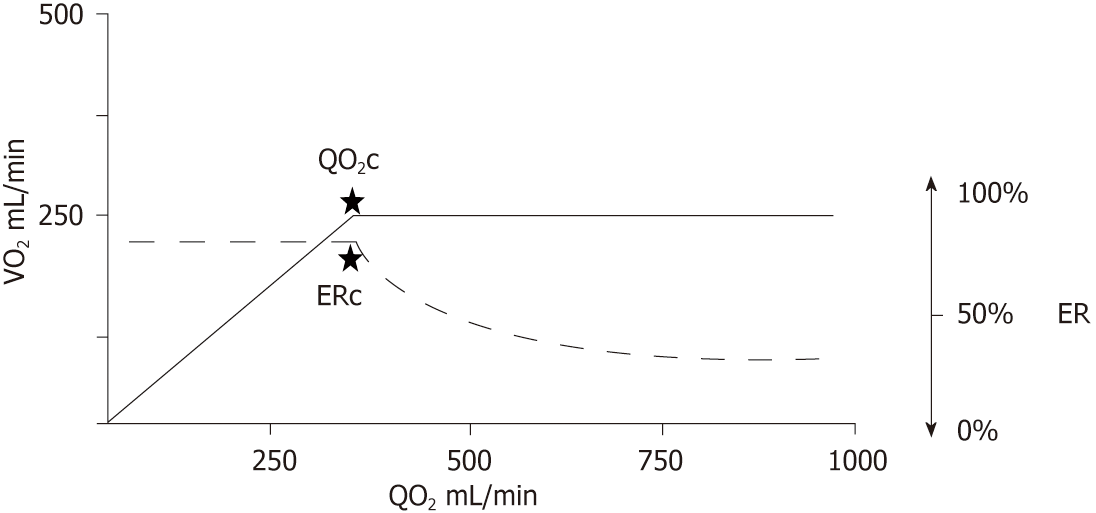
Figure 3 Relationship between oxygen delivery and venous oxygenation/oxygen consumption.
VO2: Oxygen consumption; QO2: Oxygen flow delivery; ER: Extraction ratio; ERc: Critical point of extraction; QO2c: Critical point of delivery.
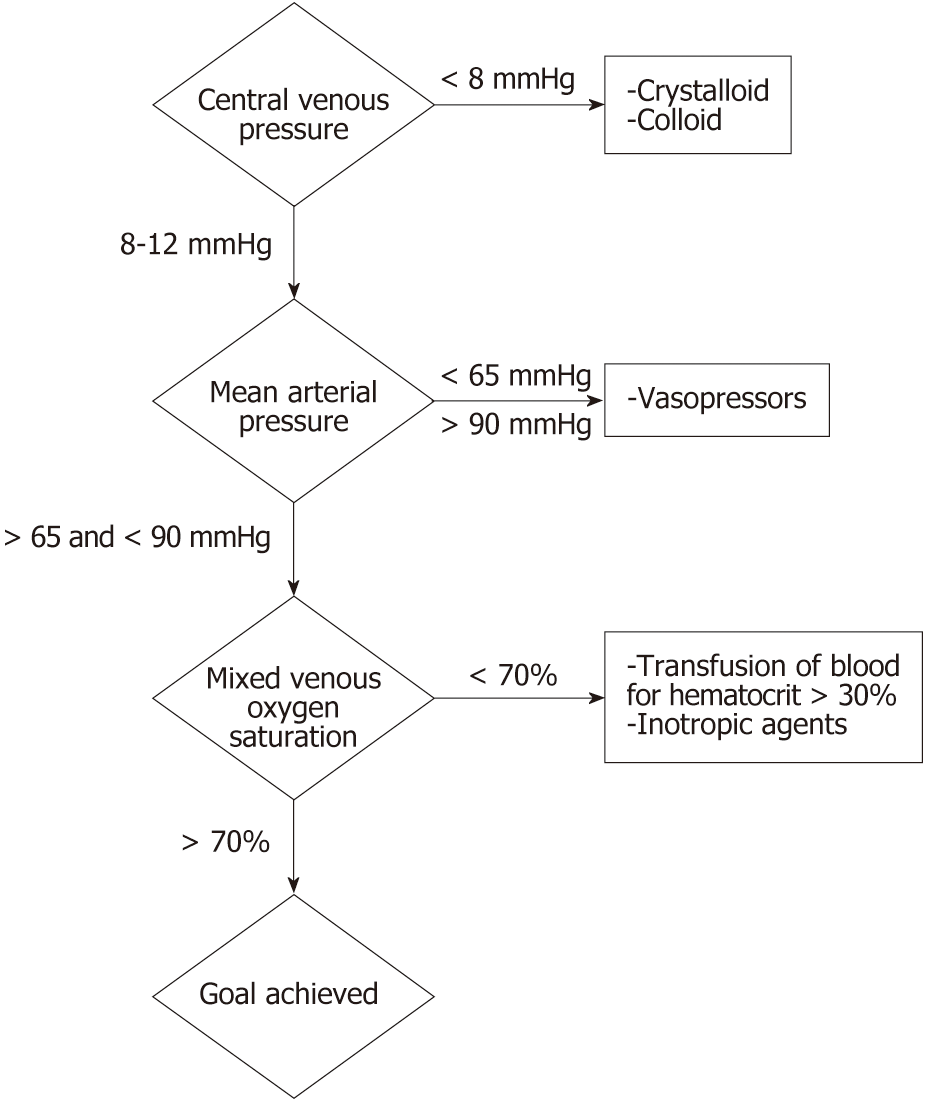
Figure 4 Protocol for early goal-directed therapy.
Adapted from[9].
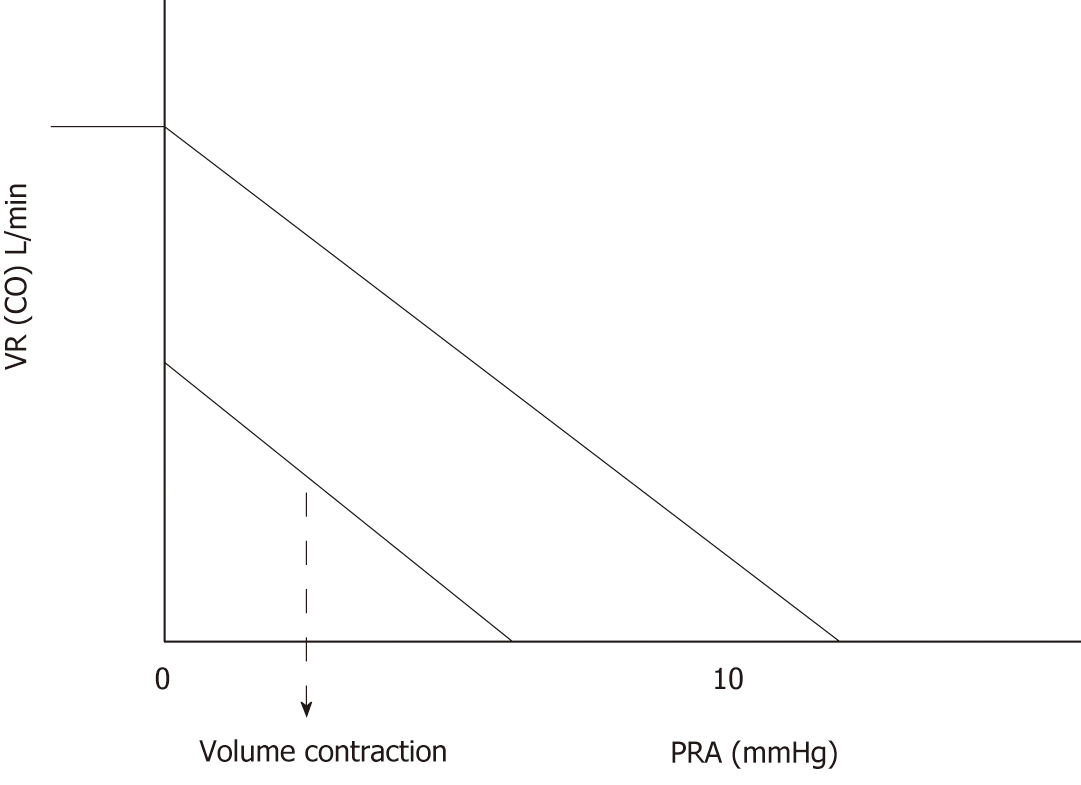
Figure 5 Guyton’s model of venous return and cardiac output in relation to the right atrial pressure.
Adapted from[62].
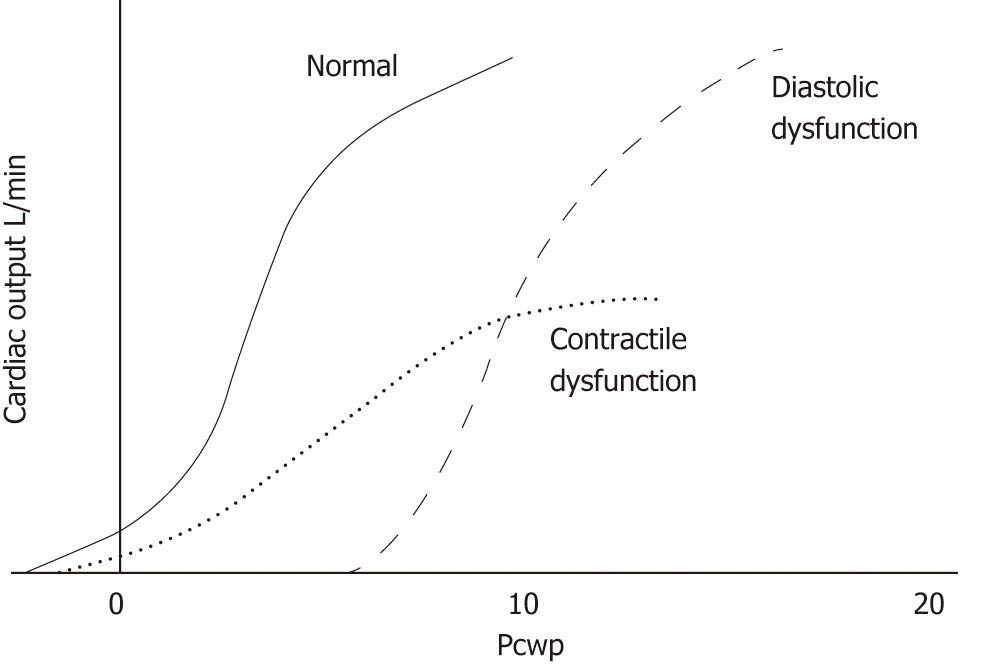
Figure 6 Frank-Starling curves representing normal contractility, diastolic dysfunction, and contractile dysfunction.
Pcwp: Pulmonary capillary wedge pressure. Adapted from[63].
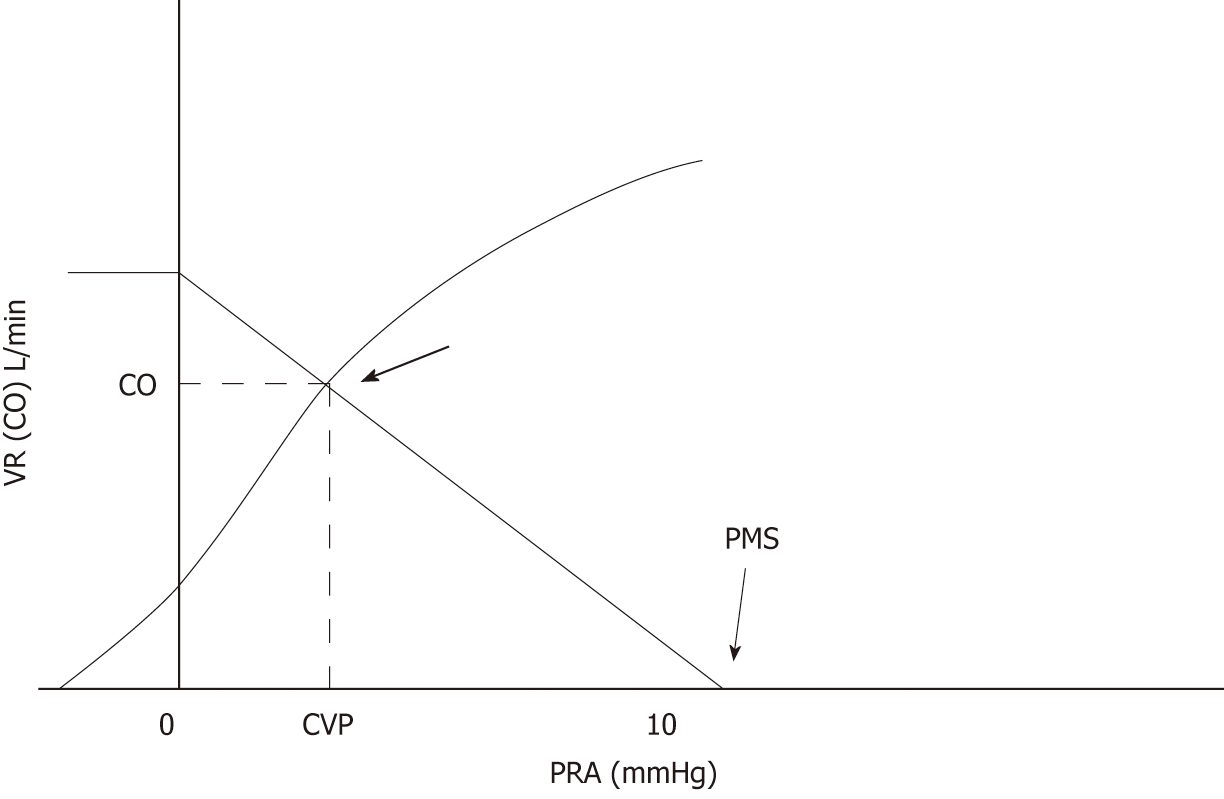
Figure 7 Modified cardiac function curve representing the central venous pressure measured in the clinical setting by superimposing Guyton’s model of venous return and Frank-Starling contractility curve.
CO: Cardiac output; CVP: Central venous pressure; PRA: Right atrial pressure; VR: Venous return; PMS: Mean systemic filling pressure. Adapted from[62].
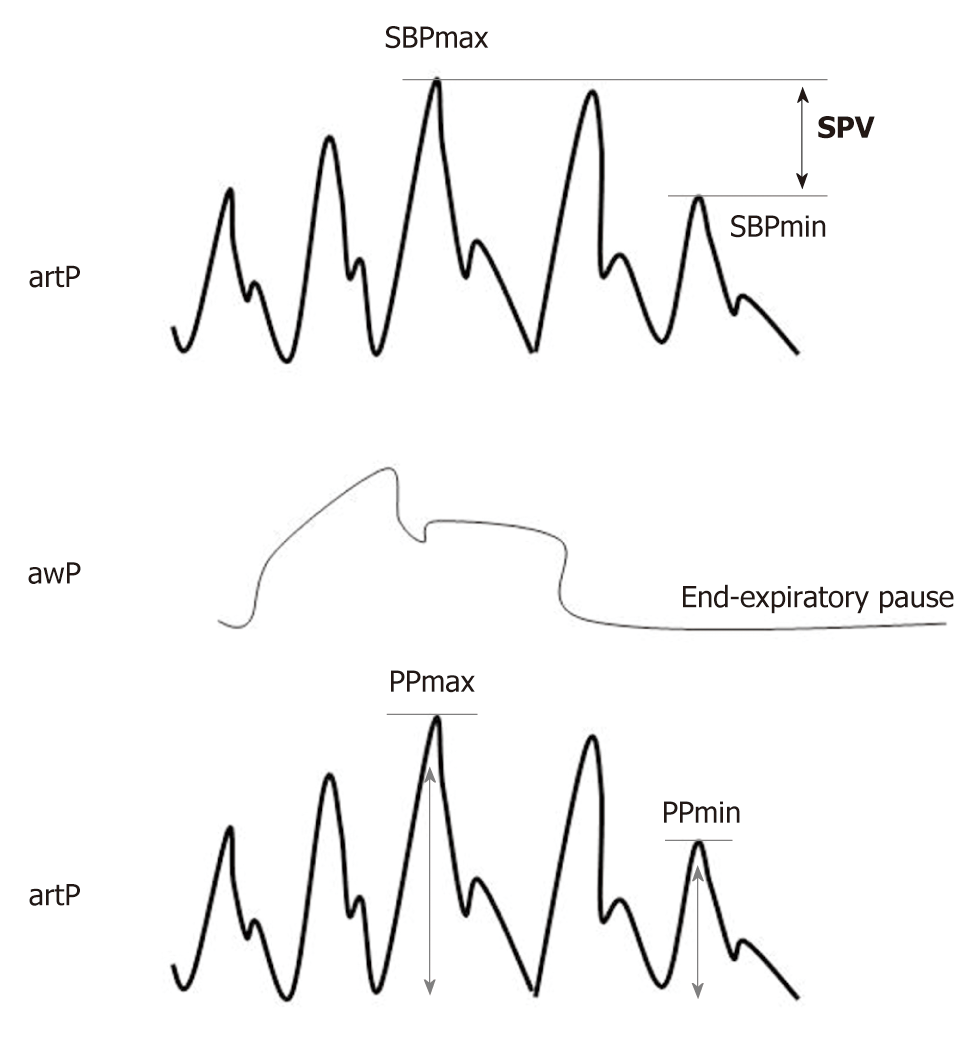
Figure 8 Description of the systolic pressure variation and pulse pressure variation during mechanical ventilation.
SPV: Systolic pressure variation; PPV: Pulse pressure variation; artP: Arterial pressure; awP: Airway pressure; SBP: Systolic pressure. PP = 100 x (PPmax – PPmin) / [(PPmax + PPmin)/2].
- Citation: Pena-Hernandez C, Nugent K. One approach to circulation and blood flow in the critical care unit. World J Crit Care Med 2019; 8(4): 36-48
- URL: https://www.wjgnet.com/2220-3141/full/v8/i4/36.htm
- DOI: https://dx.doi.org/10.5492/wjccm.v8.i4.36


