Copyright
©The Author(s) 2018.
World J Crit Care Med. Aug 4, 2018; 7(3): 39-45
Published online Aug 4, 2018. doi: 10.5492/wjccm.v7.i3.39
Published online Aug 4, 2018. doi: 10.5492/wjccm.v7.i3.39
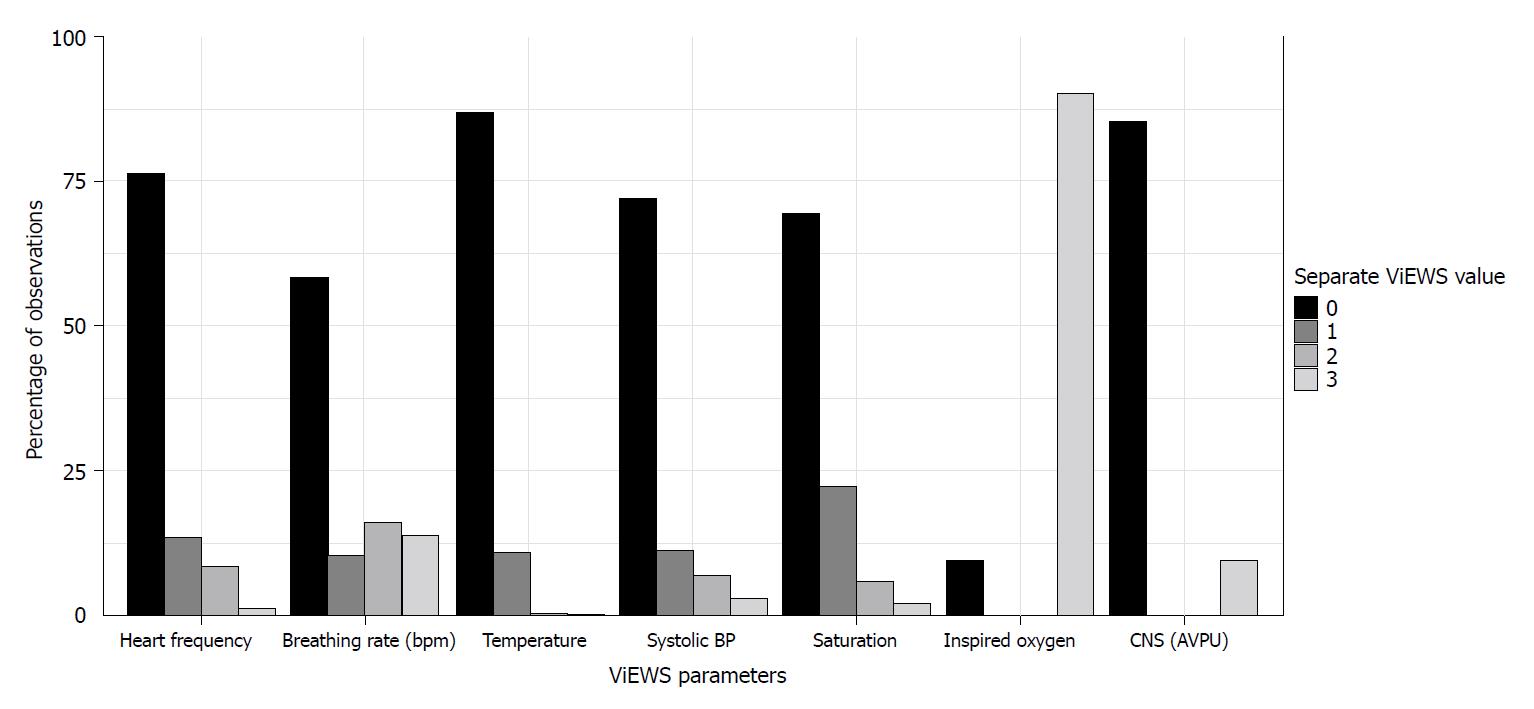
Figure 1 Frequency of Scores for Separate VitalPAC Early Warning Score Parameters.
This figure shows the relative contribution of separate VitalPAC Early Warning Score (ViEWS) Parameters towards the aggregated scores at the Intermediate Care Unit. bpm: Breaths per minute; BP: Blood pressure; CNS: Central nervous system; AVPU: Alert, verbal, pain, unresponsiveness scale.
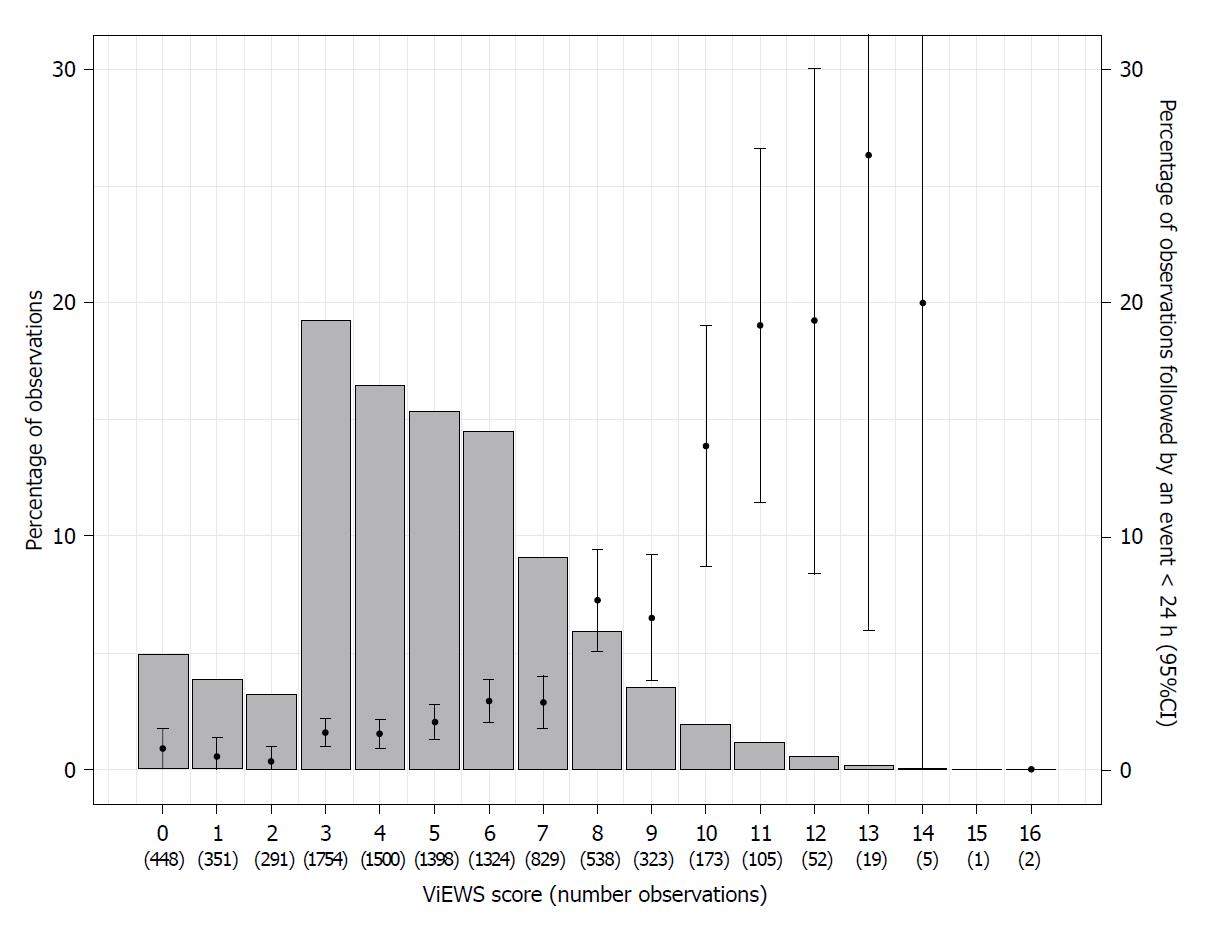
Figure 2 Distribution of VitalPAC Early Warning Score and transfer to the Intensive Care Unit rates.
This figure shows distribution of the VitalPAC Early Warning Score aggregated values (bar chart) in relation with the occurrence of the event (ICU transfer or mortality within 24 h), with 95%CIs. ICU: Intensive Care Unit.
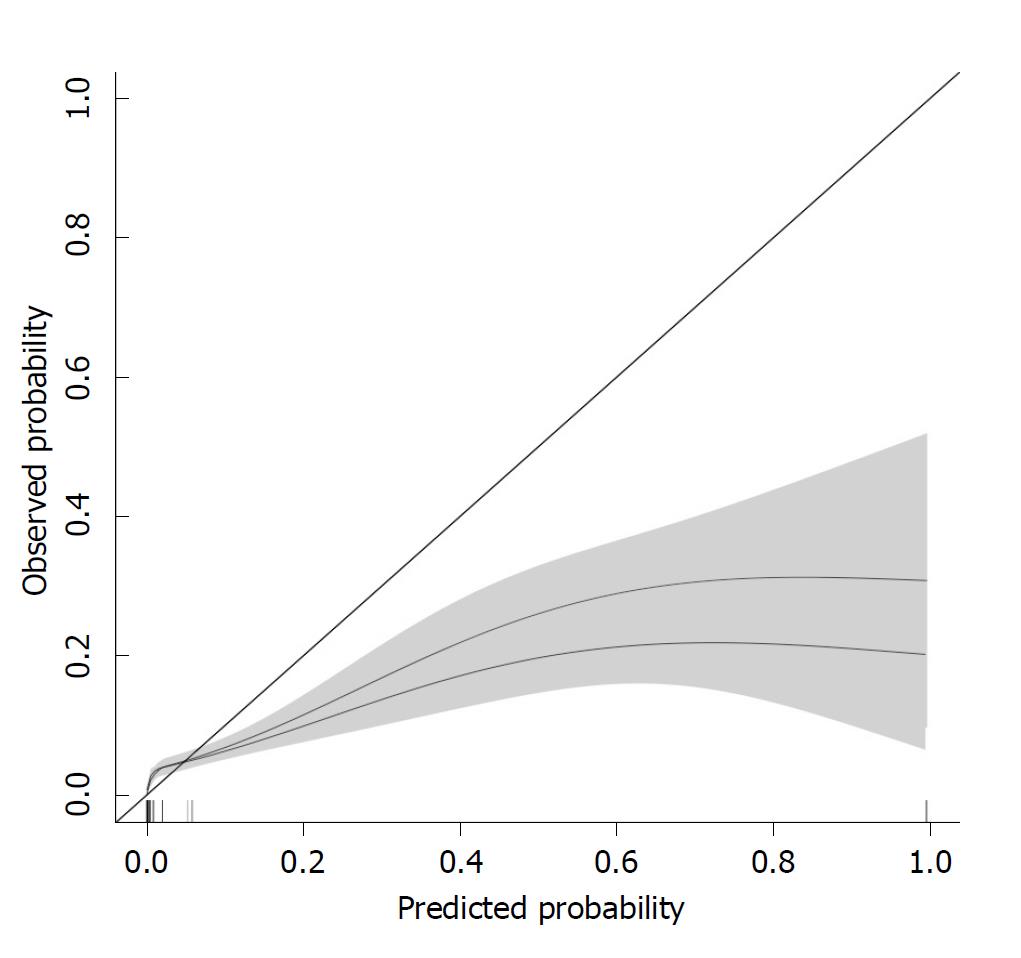
Figure 3 Calibration plots of the VitalPac Early Warning Score and the VitalPac Early Warning Score with additional parameters at the Intermediate Care Unit.
This figure shows the calibration plot of the ViEWS (lower plot) and the ViEWS with the additional parameters noradrenalin, nurse worry score, oxygen (continuous) and change in ViEWS (upper plot). ViEWS: VitalPac Early Warning Score.
- Citation: Plate JD, Peelen LM, Leenen LP, Hietbrink F. Validation of the VitalPAC Early Warning Score at the Intermediate Care Unit. World J Crit Care Med 2018; 7(3): 39-45
- URL: https://www.wjgnet.com/2220-3141/full/v7/i3/39.htm
- DOI: https://dx.doi.org/10.5492/wjccm.v7.i3.39


