Copyright
©The Author(s) 2017.
World J Crit Care Med. Aug 4, 2017; 6(3): 172-178
Published online Aug 4, 2017. doi: 10.5492/wjccm.v6.i3.172
Published online Aug 4, 2017. doi: 10.5492/wjccm.v6.i3.172
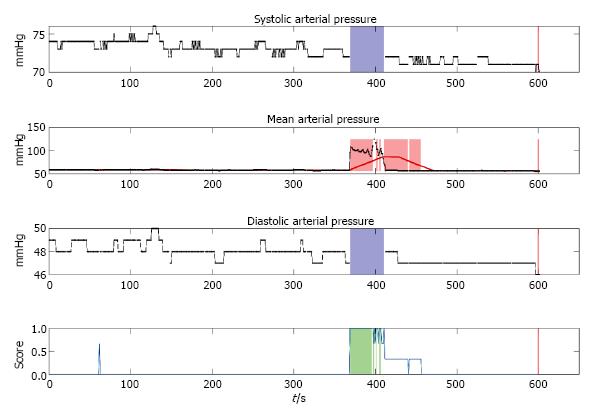
Figure 1 Example plot of the estimation process from a single detection during trial 2.
A ten minute window for the measured blood pressures and the calculated score (bottom) is shown. Absence of data for ABPs and ABPd is shown as blue boxes, exceeding ABPm and scoring threshold are shown with red and green boxes, respectively.
Figure 2 Example time-series for the predicted blood withdrawal time (upper red bars) and the time of measurements in the blood gas analysis device (lower black bars) during a 72 h trial.
- Citation: Peter J, Klingert W, Klingert K, Thiel K, Wulff D, Königsrainer A, Rosenstiel W, Schenk M. Algorithm-based arterial blood sampling recognition increasing safety in point-of-care diagnostics. World J Crit Care Med 2017; 6(3): 172-178
- URL: https://www.wjgnet.com/2220-3141/full/v6/i3/172.htm
- DOI: https://dx.doi.org/10.5492/wjccm.v6.i3.172


