Copyright
©The Author(s) 2017.
World J Crit Care Med. Feb 4, 2017; 6(1): 37-47
Published online Feb 4, 2017. doi: 10.5492/wjccm.v6.i1.37
Published online Feb 4, 2017. doi: 10.5492/wjccm.v6.i1.37
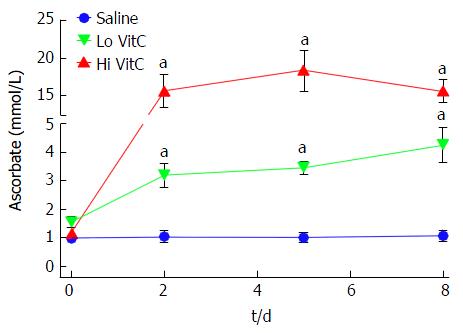
Figure 1 Vitamin C exposure increased intracellular platelet vitamin C concentrations during storage.
PLTs supplemented with Lo/Hi VitC had significantly higher intracellular levels of VitC (3.2 mmol/L for Lo VitC and 15.7 mmol/L for Hi VitC) compared to saline controls (1 mmol/L), (n = 10/group, aP < 0.05). VitC: Vitamin C; PLTs: Platelets.
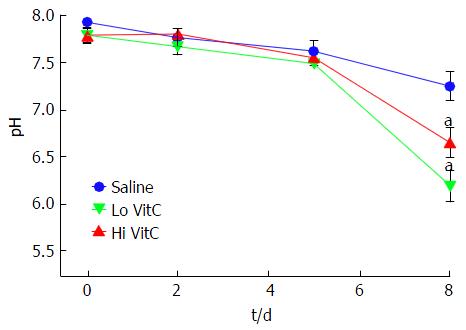
Figure 2 Vitamin C exposure was associated with pH drop on day 8.
The addition of Lo/Hi VitC did not alter the pH of the platelet concentrate. Changes in pH were comparable throughout day 5 of storage. Both Lo/Hi VitC were associated with a further significant decrease in pH between day 5 and day 8 (n = 6/group, aP < 0.05). VitC: Vitamin C; PLTs: Platelets.
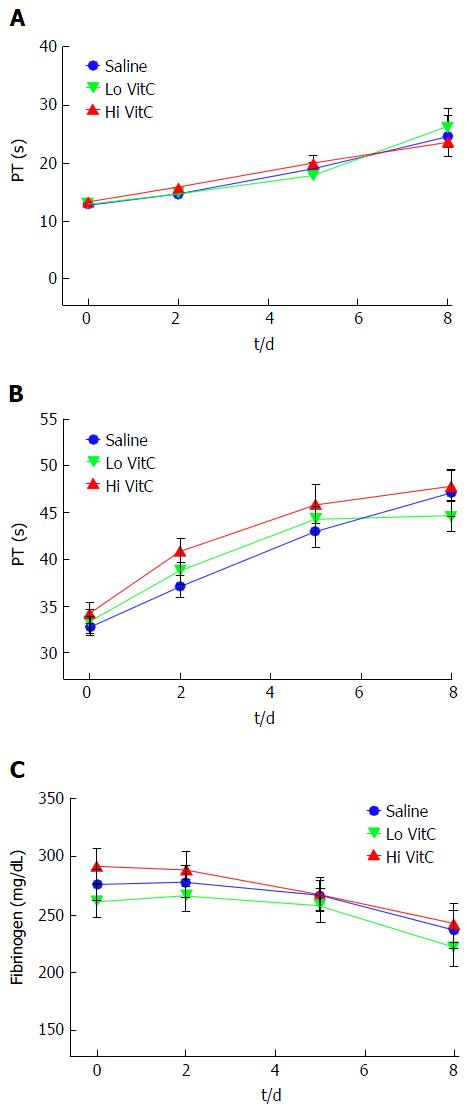
Figure 3 Vitamin C exposure did not alter coagulation pathways in platelets.
PT, PTT and Fibrinogen were performed to detect major impacts on the intrinsic, extrinsic and common coagulation pathways. Using platelet poor plasma we observed no significant changes across the saline, Lo- and Hi VitC groups in the PT (A), PTT (B), and Fibrinogen (C) profiles over storage (n =10/group). VitC: Vitamin C; PT: Prothrombin time; PTT: Partial thrombplastin time.
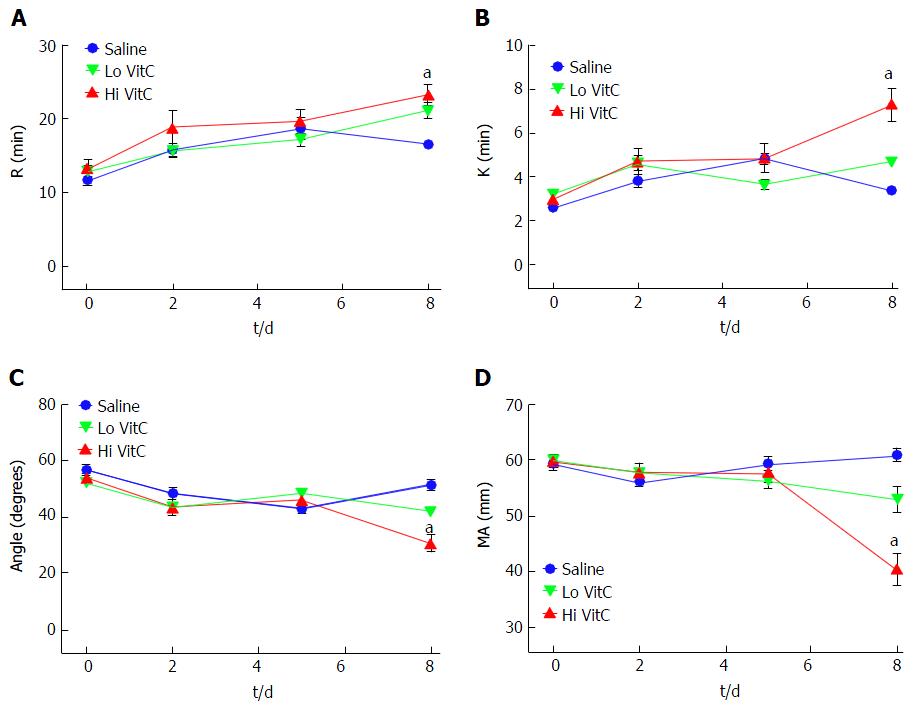
Figure 4 High vitamin C exposure impacts platelet function on day 8.
No significant differences were observed between saline, Lo VitC and Hi VitC throughout the standard 5-d storage period in any of the TEG parameters analyzed (n = 10/group). On day-8, R- (A) and K- (B) times were extended in the Hi VitC group compared to saline (n = 10, aP < 0.05). Similar changes were observed for the α-angle (C) on day-8 (n = 10, aP < 0.05). The Hi VitC group was also associated with a significantly lower MA (D) on day-8 compared to the saline group (n = 10, aP < 0.05). VitC: Vitamin C; TEG: Thromboelastography.
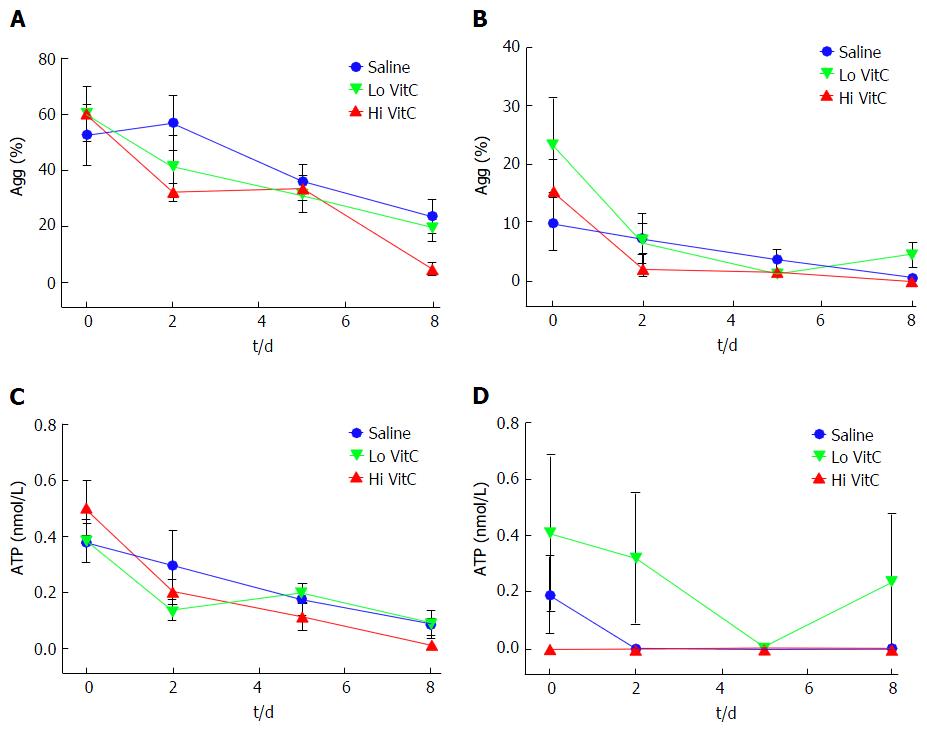
Figure 5 Vitamin C exposure did not affect agonist-stimulated aggregation or adenosine triphosphate secretion by platelets.
Using adj. PRP aliquots, addition of Lo/Hi VitC did not alter Collagen-induced PLTs aggregation (A) and ATP secretion (C) as well as ADP-induced PLTs aggregation (B) and ATP secretion (D) when compared to saline controls (n = 10/group). VitC: Vitamin C; PLTs: Platelets; ADP: Adenosine diphosphate; PRP: Platelet rich plasma; ATP: Adenosine triphosphate.
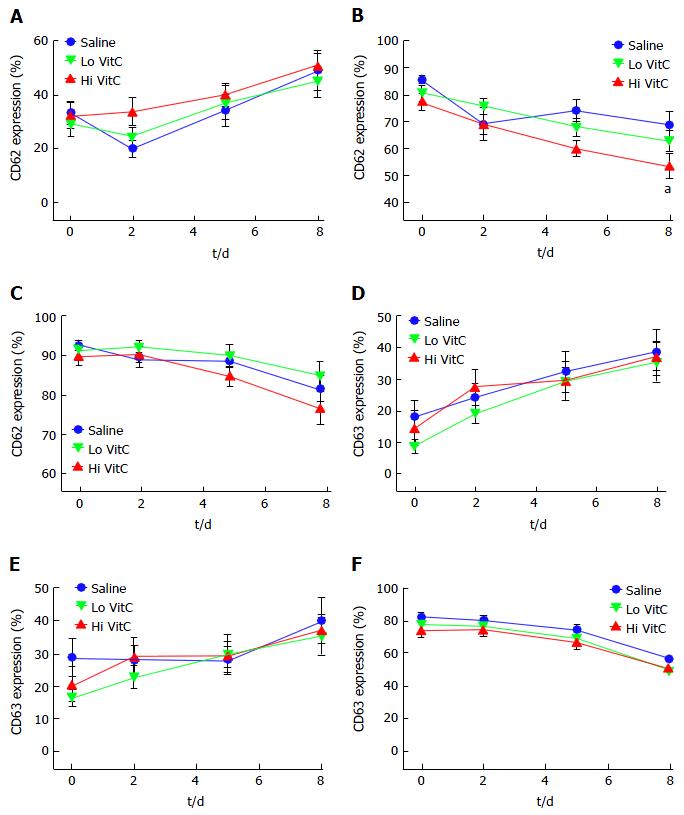
Figure 6 Vitamin C exposure did not significantly alter basal or agonist-stimulated CD62 or CD63 expression profiles.
Flow cytometry showed that basal expression of both CD62 (A) and CD63 (D) did not differ with the addition of Lo/Hi VitC. ADP-stimulated CD62 (B) expression was lower on day 8 in the Hi VitC group (n = 10/group, aP < 0.05), but CD63 (E) expression was not. Thrombin-stimulated CD62 (C) and CD63 (F) expression also did not differ across the three groups (n = 10/group). VitC: Vitamin C; ADP: Adenosine diphosphate.
Figure 7 Hi vitamin C, but not Lo vitamin C exposure, was associated with significant changes in the eicosanoid profile over time.
Addition of Lo/Hi VitC did not affect the levels of the PUFA: AA (A), EPA (B) and DHA (C) in comparison to saline controls (n = 10/group). Addition of Hi VitC was associated with significantly higher levels of 11-HETE (D) on days 5 and 8 (n = 10/group, aP < 0.05); 12-HETE (E) on days 2, 5 and 8 (n = 10/group, aP < 0.05); and 15-HETE (F) on day 8 (n = 10/group, aP < 0.05). TXB2 (G) was also significantly higher in the Hi VitC group on days 5 and 8 (n = 10/group, aP < 0.05). In addition, PGE2 levels (H) were significantly higher on days 2 and 8 in the Hi VitC group (n = 10/group, aP < 0.05). VitC: Vitamin C; PUFA: Polyunsaturated fatty acids; AA: Arachidonic acid; EPA: Eicosapentanoic acid; DHA: Docosahexanoic acid; TXB2: Thromboxane B2; PGE2: Prostaglandin E2.
- Citation: Mohammed BM, Sanford KW, Fisher BJ, Martin EJ, Contaifer Jr D, Warncke UO, Wijesinghe DS, Chalfant CE, Brophy DF, Fowler III AA, Natarajan R. Impact of high dose vitamin C on platelet function. World J Crit Care Med 2017; 6(1): 37-47
- URL: https://www.wjgnet.com/2220-3141/full/v6/i1/37.htm
- DOI: https://dx.doi.org/10.5492/wjccm.v6.i1.37


