Copyright
©The Author(s) 2016.
World J Crit Care Med. Feb 4, 2016; 5(1): 74-82
Published online Feb 4, 2016. doi: 10.5492/wjccm.v5.i1.74
Published online Feb 4, 2016. doi: 10.5492/wjccm.v5.i1.74
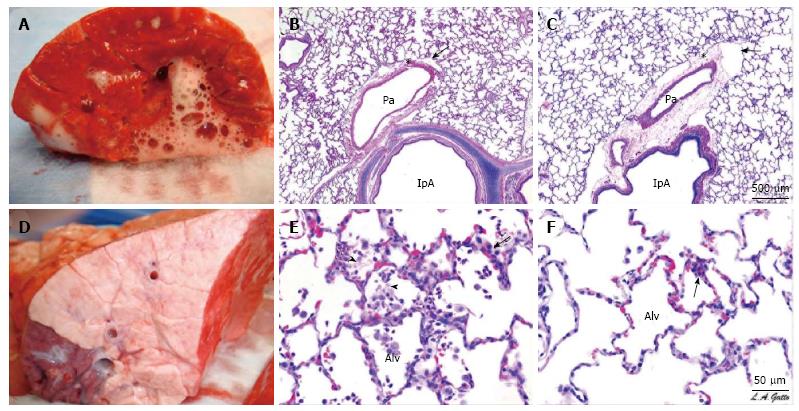
Figure 1 A gross and histological comparison between airway pressure release ventilation and nonpreventative ventilation.
A and D: Gross pathology of the cut surface of the right lower lobe of the lung of representative animals from (A) the NPV and (D) the APRV group. The NPV shows severe inflammation, bronchial edema, and areas of hemorrhage. The APRV group demonstrates normal, pink, homogenously inflated lungs with little injury on gross appearance; B, C, E, F: Histological comparison of four pigs, two NPV (B and E) and two APRV (C and F) at low (B and C) and high (E and F) magnification. The NPV animals show classic stigmata of ARDS including atelectasis, fibrinous exudates, intra-alveolar hemorrhage, congested capillaries, thickened alveolar walls, and leukocytic infiltrates. The APRV animals demonstrate preservation of nearly normal pulmonary architecture. Published with permssion from Ref[38]. APRV: Airway pressure release ventilation; NPV: Nonpreventative ventilation; ARDS: Acute respiratory distress syndrome; Alv: Alveoli.
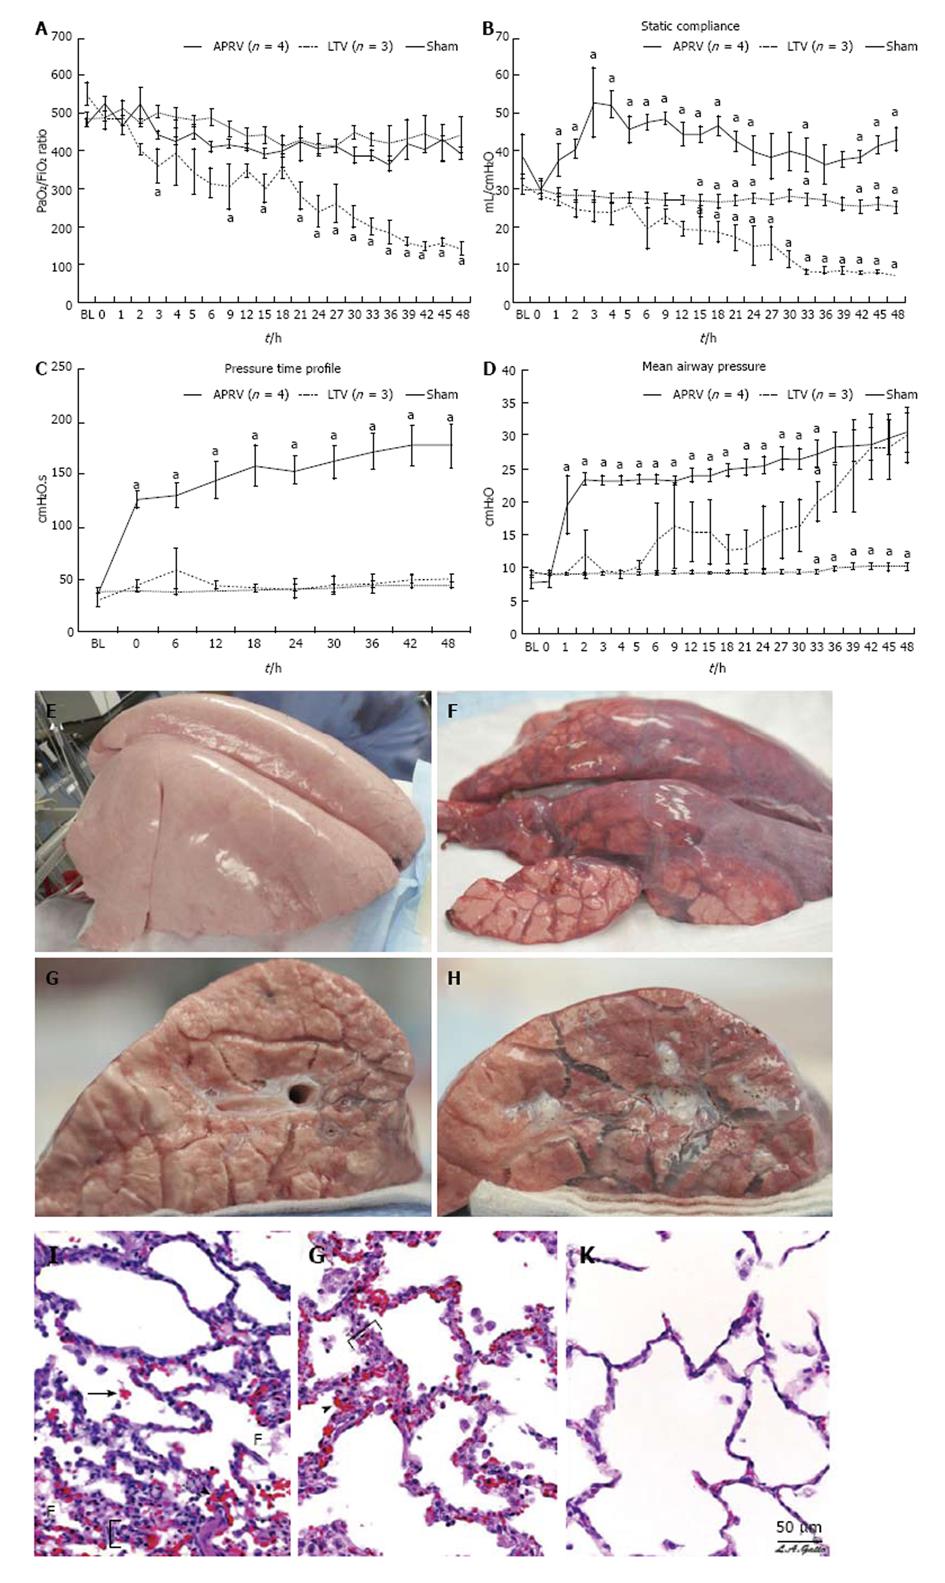
Figure 2 Pulmonary, gross and histologic representation between airway pressure release ventilation, LTV and sham animals.
Top: Pulmonary data: A: P/F Ratio: APRV maintains a normal P/F ratio throughout the 48-h study with no significant difference from uninjured sham animals. Low tidal volume ventilation develops ALI (P/F G 300) by 19 h and ARDS (P/F G 250) by 33 h; ventilation strategy does not alter steady progression of increasing hypoxemia (P G 0.001 vs APRV and sham); B: Static compliance (Cstat): the APRV shows significant increase in Cstat after transition from volume- cycled mode to APRV (P G 0.001 vs sham and LTV ventilation). Sham maintained a normal Cstat level throughout the course of the study. In contrast, the LTV ventilation group developed progressive decreases in Cstat to less than 50% of BL; C: Mean airway pressure: sham group maintained normal Pmean throughout 48-h significantly different from both APRV and LTV ventilation (P G 0.001). Pmean was significantly higher in APRV than in both sham and LTV ventilation after transition from conventional ventilation at 1 h. Because of stepwise increases in PEEP per the ARDSnet protocol, the Pmean was identical from 39 to 48 h for LTV ventilation and APRV; D: Pressure-time profile (P/TP): APRV group had significantly higher P/TP than did both other groups as soon as the transition was made from volume-cycled ventilation (P G 0.001 vs sham and LTV ventilation). In the LTV ventilation group, P/TP remained low and did not change over the 48-h course of the study. Sham group animals also had low P/TP, which was not significantly different from the LTV ventilation group throughout the study; Middle: Gross appearance. Representative specimens of gross lungs and cut surface of gross lungs from LTV ventilation (F and H) and APRV (E and G) groups are shown. Bottom I-K: Histological appearance. Photomicrographs of representative lung sections of specimens from each treatment group at 40 × magnification are shown. F: Fibrinous deposit in the air compartment; arrow: Blood in alveolus; arrowhead: Congested alveolar capillary; bracket: Thickened alveolar wall. A: Sham: Animals received 48 h of mechanical ventilation and no injury. Specimen exhibits stigmata of lung injury including fibrinous deposits, blood in alveolus, congested capillaries, and thickened alveolar walls; B: Low tidal volume ventilation: animals received aforementioned ischemic injury along with peritoneal sepsis and LTV ventilation after onset of ALI. Specimen exhibits stigmata of lung injury including fibrinous deposits, blood in alveolus, congested capillaries, leukocyte infiltration, and thickened alveolar walls; C: Airway pressure release ventilation: animals received APRV 1 h following aforementioned ischmic injury and peritoneal sepsis. Specimen shows normal pulmonary architecture, alveoli are well expanded and thin walled, and there are no exudates. Republished with permission from Ref[39]. APRV: Airway pressure release ventilation; PEEP: Positive end-expiratory pressure; ALI: Acute lung injury.
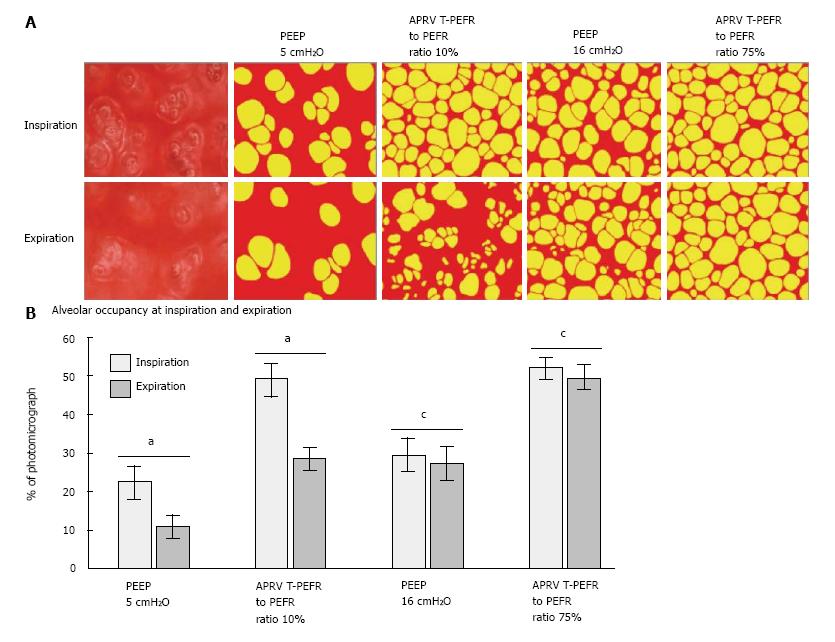
Figure 3 In vivo photomicrographs and percentage of alveolar air space occupancy at inspiration and expiration.
A: In vivo photomicrographs at inspiration and expiration prior to coloring and for positive end-expiratory pressure (PEEP) of 5 cm H2O, airway pressure release ventilation (APRV) ratio of termination of peak expiratory flow rate (T-PEFR) to peak expiratory flow rate (PEFR) of 10%, PEEP of 16 cm H2O, and APRV T-PEFR to PEFR ratio of 75% (original magnification × 10). Alveoli are colored in yellow; nonalveolar tissue, red; B: Alveolar air space occupancy is expressed as a percentage of the photomicrograph containing inflated alveoli (yellow in A) at inspiration and expiration. Data are shown as the mean; error bars indicate standard error of the mean. aP < 0.05 for PEEP of 5 cmH2O vs APRVT-PEFR to PEFR ratio of 10%; cP < 0.05 for PEEP of 16 cmH2O vs APRV T-PEFR to PEFR ratio of 75%. Republished with permission from Ref[40].
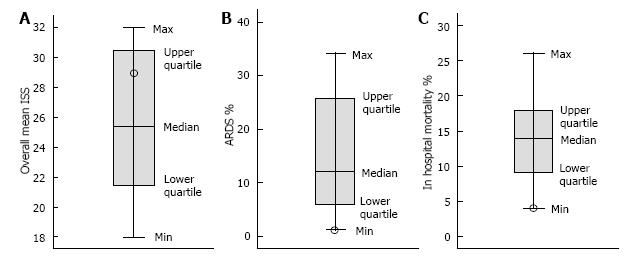
Figure 4 Boxplots for mean individual severity score (A), acute respiratory distress syndrome % (B), and in-hospital mortality % (C).
Mean ISS shows the range and distribution of ISS scores reported by 16 authors; 50% of them reported ISS between 30.5 and 23.2, with the middle score of 25.4 (median). The mean ISS of 29 for the preemptive APRV group belonged to the upper quartile of the boxplot. ARDS incidence % shows the range and distribution of scores reported by 16 authors; 50% of them reported ARDS incidence between 22.5% and 6%, with the middle score of 11.95% (median). The incidence of ARDS in the preemptive APRV group represented the minimum score at 1.3%. Mortality % shows the range and distribution of mortality scores reported by 16 authors; 50% of them reported mortality between 18.2% and 9.2%, with the middle score of 13.9% (median). The preemptive APRV group scored the minimum mortality rate of 3.9%. Republished with permission from Ref[11]. ARDS: Acute respiratory distress syndrome; APRV: Airway pressure release ventilation; ISS: Individual severity score.
- Citation: Sadowitz B, Jain S, Kollisch-Singule M, Satalin J, Andrews P, Habashi N, Gatto LA, Nieman G. Preemptive mechanical ventilation can block progressive acute lung injury. World J Crit Care Med 2016; 5(1): 74-82
- URL: https://www.wjgnet.com/2220-3141/full/v5/i1/74.htm
- DOI: https://dx.doi.org/10.5492/wjccm.v5.i1.74


