Copyright
©The Author(s) 2016.
World J Crit Care Med. Feb 4, 2016; 5(1): 47-56
Published online Feb 4, 2016. doi: 10.5492/wjccm.v5.i1.47
Published online Feb 4, 2016. doi: 10.5492/wjccm.v5.i1.47
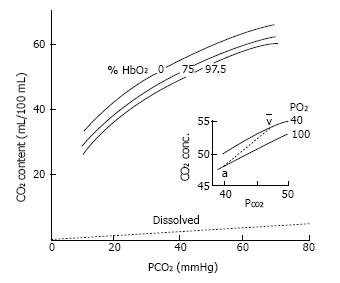
Figure 1 CO2 dissociation curve.
CO2 content (mL/100 mL) vs CO2 partial tension (PCO2). Differences between the curves result in higher CO2 content in the blood, and smaller PCO2 differences between arterial and venous blood. Hemoglobin-O2 saturation affects the position of the CO2 dissociation curve (Haldane effect).
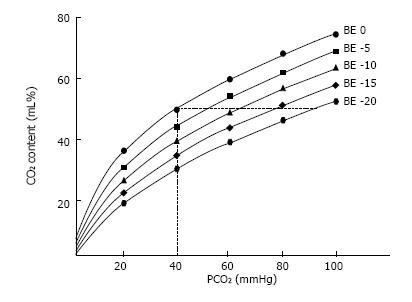
Figure 2 CO2 dissociation curve.
CO2 content (mL/100 mL) vs CO2 partial tension (PCO2). Each curve is described at constant base excess (BE). As displayed, for the same CO2 content, changing the BE results in a great change in PCO2.
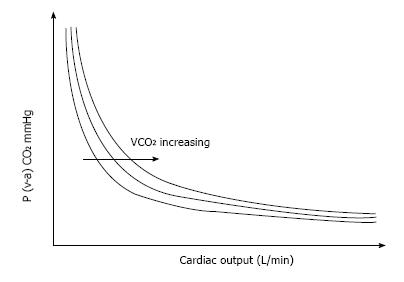
Figure 3 Relationship between the mixed venous-to-arterial PCO2 difference P (v-a) CO2 and cardiac output.
For a constant total CO2 production (VCO2), changes in cardiac output result in large changes in P (v-a) CO2 in the low values of cardiac output, whereas changes in cardiac output will not result in significant changes in P (v-a) CO2 in the high values of cardiac output.
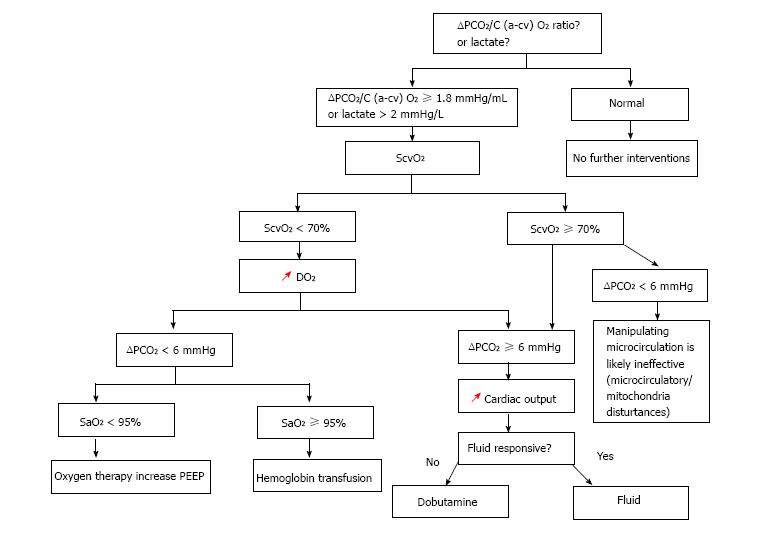
Figure 4 ScvO2-∆PCO2 guided protocol.
ScvO2: Central venous oxygen saturation; ∆PCO2: Central venous-to-arterial carbon dioxide tension difference; SaO2: Arterial oxygen saturation; C (a-cv) O2: Central arteriovenous oxygen content difference; DO2: Oxygen delivery; PEEP: Positive end expiratory pressure; red arrows: Increasing.
- Citation: Mallat J, Lemyze M, Tronchon L, Vallet B, Thevenin D. Use of venous-to-arterial carbon dioxide tension difference to guide resuscitation therapy in septic shock. World J Crit Care Med 2016; 5(1): 47-56
- URL: https://www.wjgnet.com/2220-3141/full/v5/i1/47.htm
- DOI: https://dx.doi.org/10.5492/wjccm.v5.i1.47


