Copyright
©The Author(s) 2015.
World J Crit Care Med. Nov 4, 2015; 4(4): 287-295
Published online Nov 4, 2015. doi: 10.5492/wjccm.v4.i4.287
Published online Nov 4, 2015. doi: 10.5492/wjccm.v4.i4.287
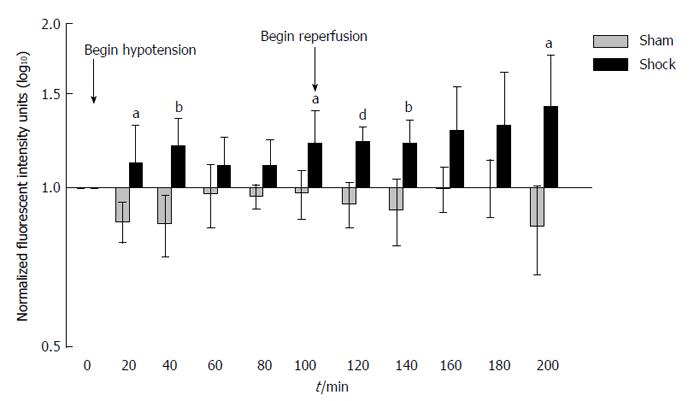
Figure 1 Increased bowel permeability to casein peptides after hemorrhagic shock.
Small bowel permeability as measured by systemic concentrations of proteolytically-generated peptides from fluorescently labelled casein injected into the small bowel. Note the early increase in bowel permeability at 20 min, followed by a second, sustained increase in bowel permeability at reperfusion. Values normalized to background fluorescent levels in the systemic circulation at time T = 0 and plotted as log10 concentrations. Results reported as Mean ± SD. aP < 0.05, bP < 0.01, dP < 0.001 using Repeated Measures ANOVA for hemorrhagic shock (n = 6) vs sham-shock control (n = 6) groups at each time point.
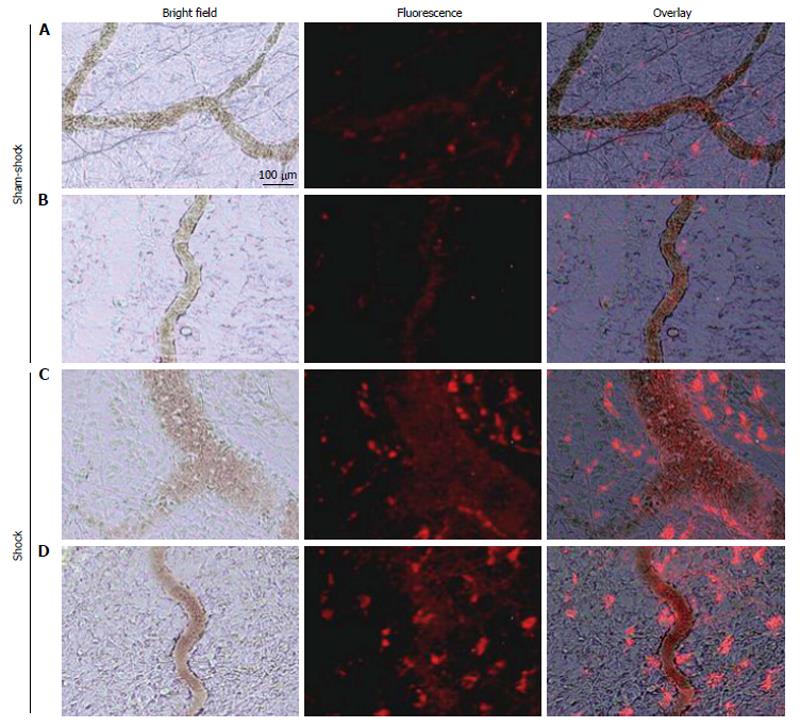
Figure 2 Selected in vivo microvascular images from two different sham-shock control (A and B) and shock (C and D) animals (n = 6, both groups) after hemorrhagic shock or sham-shock and reperfusion.
Note the significantly higher levels of red fluorescent casein-derived peptides in the microvasculature and within the interstitium in shock animals (C and D) compared with their sham shock counterparts (A and B).
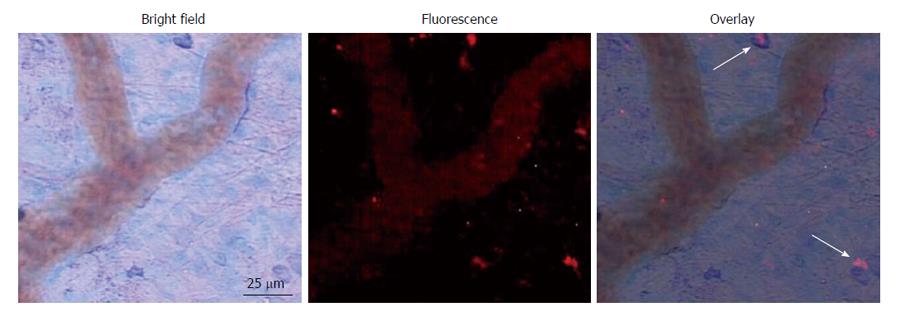
Figure 3 Representative micrograph with overlays depicting infiltration of white blood cells into the mesentery following shock.
Arrows indicate co-localization of fluorescent casein-derived peptide with white blood cells, suggesting a possible inflammatory component to the casein-derived peptides.
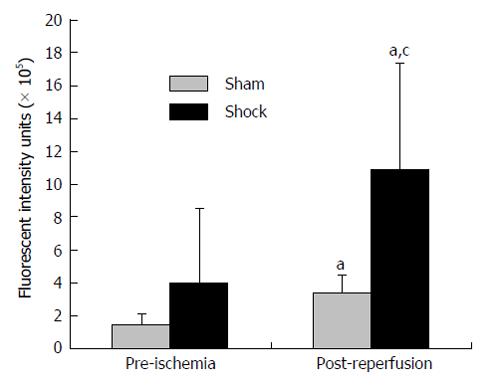
Figure 4 Increased bowel permeability after fluorescein isothiocyanate-Dextrans-20 after hemorrhagic shock.
Small bowel permeability after experimental hemorrhagic shock as measured by systemic concentrations of FITC-Dextrans-20 injected into the bowel. aP < 0.05 post-reperfusion vs initial values using two-tailed paired Student’s t-test, cP < 0.05 shock group (n = 5) vs sham-shock controls (n = 5) using two-tailed unpaired Student’s t-test.
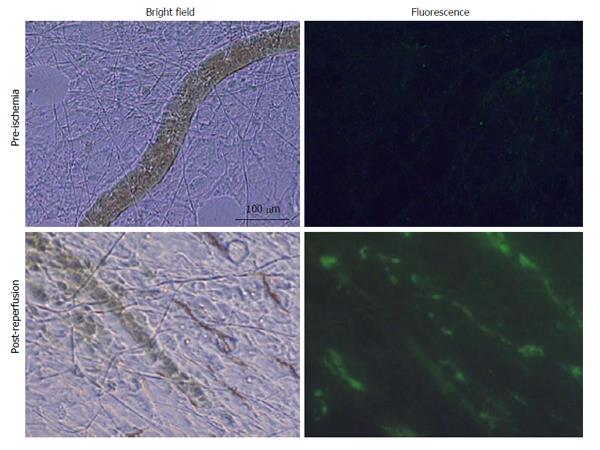
Figure 5 Selected in vivo microvascular images of the mesentery from a shock animal pre-ischemia and 100 min post-reperfusion (n = 5).
Note the significantly higher levels of fluorescein isothiocyanate-dextrans-20 in the microvasculature vs initial values and the relative lack of flow after reperfusion.
-
Citation: Alsaigh T, Chang M, Richter M, Mazor R, Kistler EB.
In vivo analysis of intestinal permeability following hemorrhagic shock. World J Crit Care Med 2015; 4(4): 287-295 - URL: https://www.wjgnet.com/2220-3141/full/v4/i4/287.htm
- DOI: https://dx.doi.org/10.5492/wjccm.v4.i4.287


