Copyright
©2014 Baishideng Publishing Group Co.
World J Crit Care Med. Feb 4, 2014; 3(1): 34-41
Published online Feb 4, 2014. doi: 10.5492/wjccm.v3.i1.34
Published online Feb 4, 2014. doi: 10.5492/wjccm.v3.i1.34
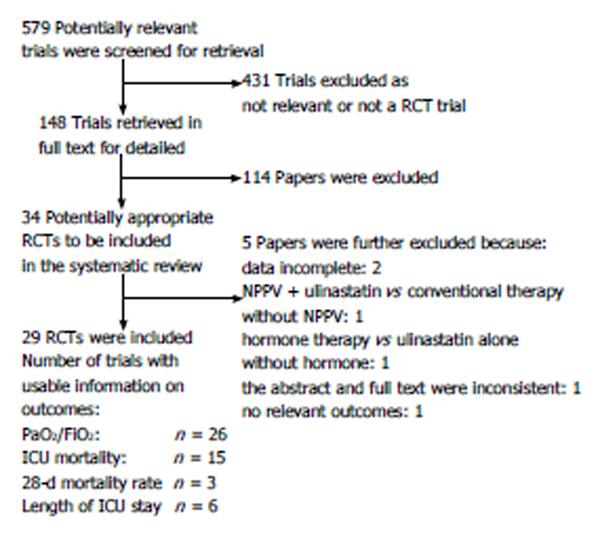
Figure 1 Flow chart of reviewed articles.
RCT: Randomized controlled trial; NPPV: Noninvasive positive-pressure ventilation; ICU: Intensive care unit.
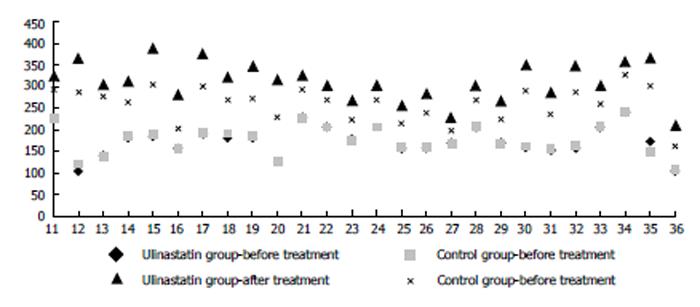
Figure 2 Oxygenation indexes of different groups before and after treatment.
The horizontal axis, number of references.
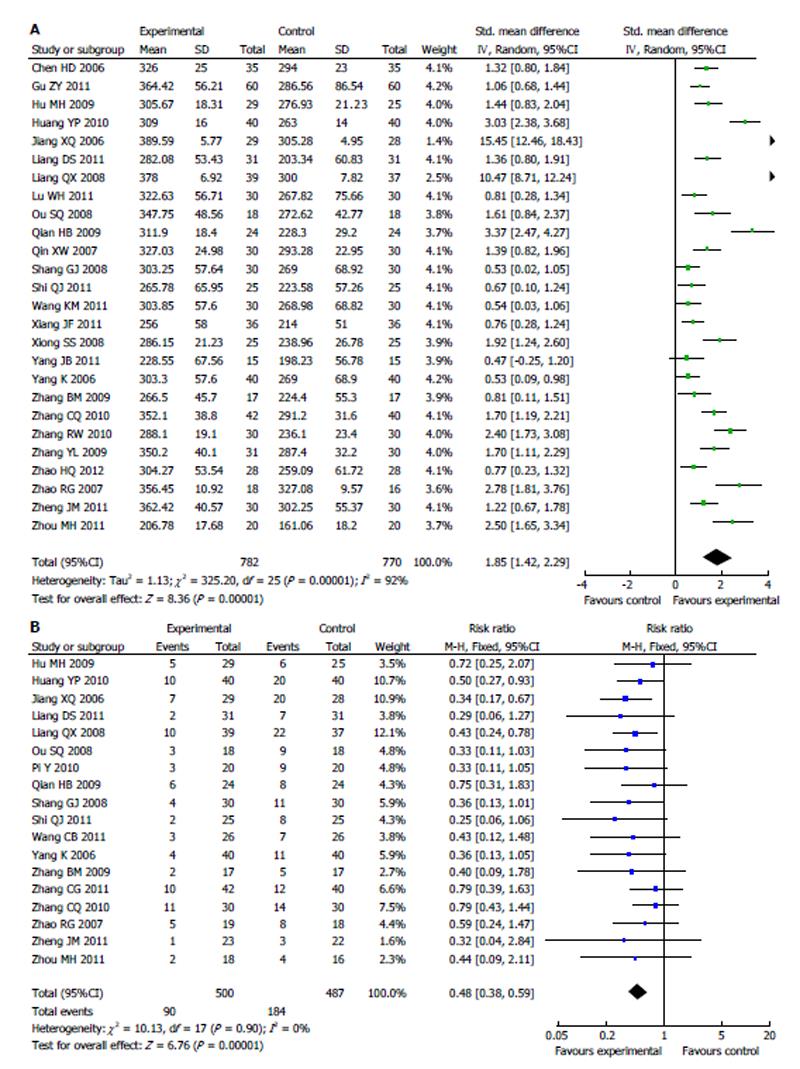
Figure 3 Meta-analysis of patients’ oxygenation index (A) and intensive care unit mortality rate (B) after treatment with conventional therapy vs with ulinastatin (random effects).
A: Random effects model; B: Fixed effects model.
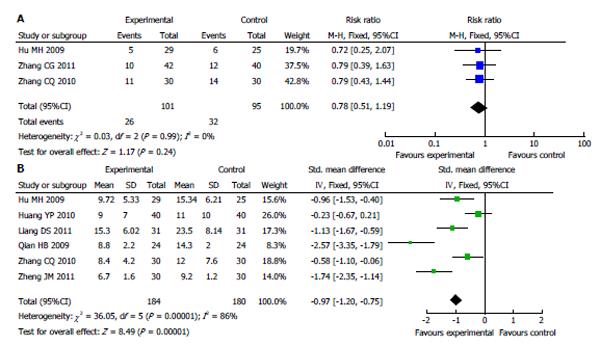
Figure 4 Meta-analysis of 28-d mortality rate (A) and length of intensive care unit stay (B) between treatment with conventional therapy and with ulinastatin.
A: Fixed effects model; B: Random effects model.
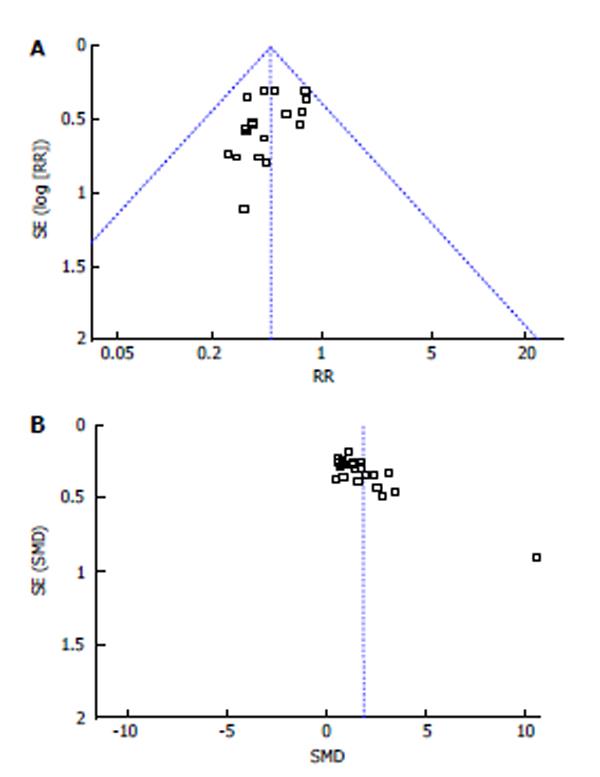
Figure 5 Funnel plots of intensive care unit mortality (A) and oxygenation index (B).
SMD: Standard mean difference.
- Citation: Leng YX, Yang SG, Song YH, Zhu X, Yao GQ. Ulinastatin for acute lung injury and acute respiratory distress syndrome: A systematic review and meta-analysis. World J Crit Care Med 2014; 3(1): 34-41
- URL: https://www.wjgnet.com/2220-3141/full/v3/i1/34.htm
- DOI: https://dx.doi.org/10.5492/wjccm.v3.i1.34


