Copyright
©The Author(s) 2025.
World J Crit Care Med. Mar 9, 2025; 14(1): 98419
Published online Mar 9, 2025. doi: 10.5492/wjccm.v14.i1.98419
Published online Mar 9, 2025. doi: 10.5492/wjccm.v14.i1.98419
Figure 1 A patient presenting with right foot necrotizing fasciitis with a typical diabetic foot attack.
A: A plain radiograph of a right foot demonstrating gas in the soft tissues, secondary to necrotizing fasciitis; B: A T2 magnetic resonance imaging image of a right foot demonstrating gas in the soft tissues, secondary to necrotizing fasciitis. R: Right.
Figure 2 A patient presenting with left foot pyomyositis with a typical (infective) diabetic foot attack, secondary to a Charcot arthropathy and heel ulceration.
A: A plain radiograph of a left foot, with severe Charcot arthropathy and an extensive heel ulcer, with gas in the soft tissue and associated soft tissue swelling; B: A T2 magnetic resonance imaging image of a left ankle demonstrating Charcot arthropathy, with soft tissue collections (pus) in the plantar foot musculature (pyomyositis). L: Left; HBL: Horizontal beam lateral.
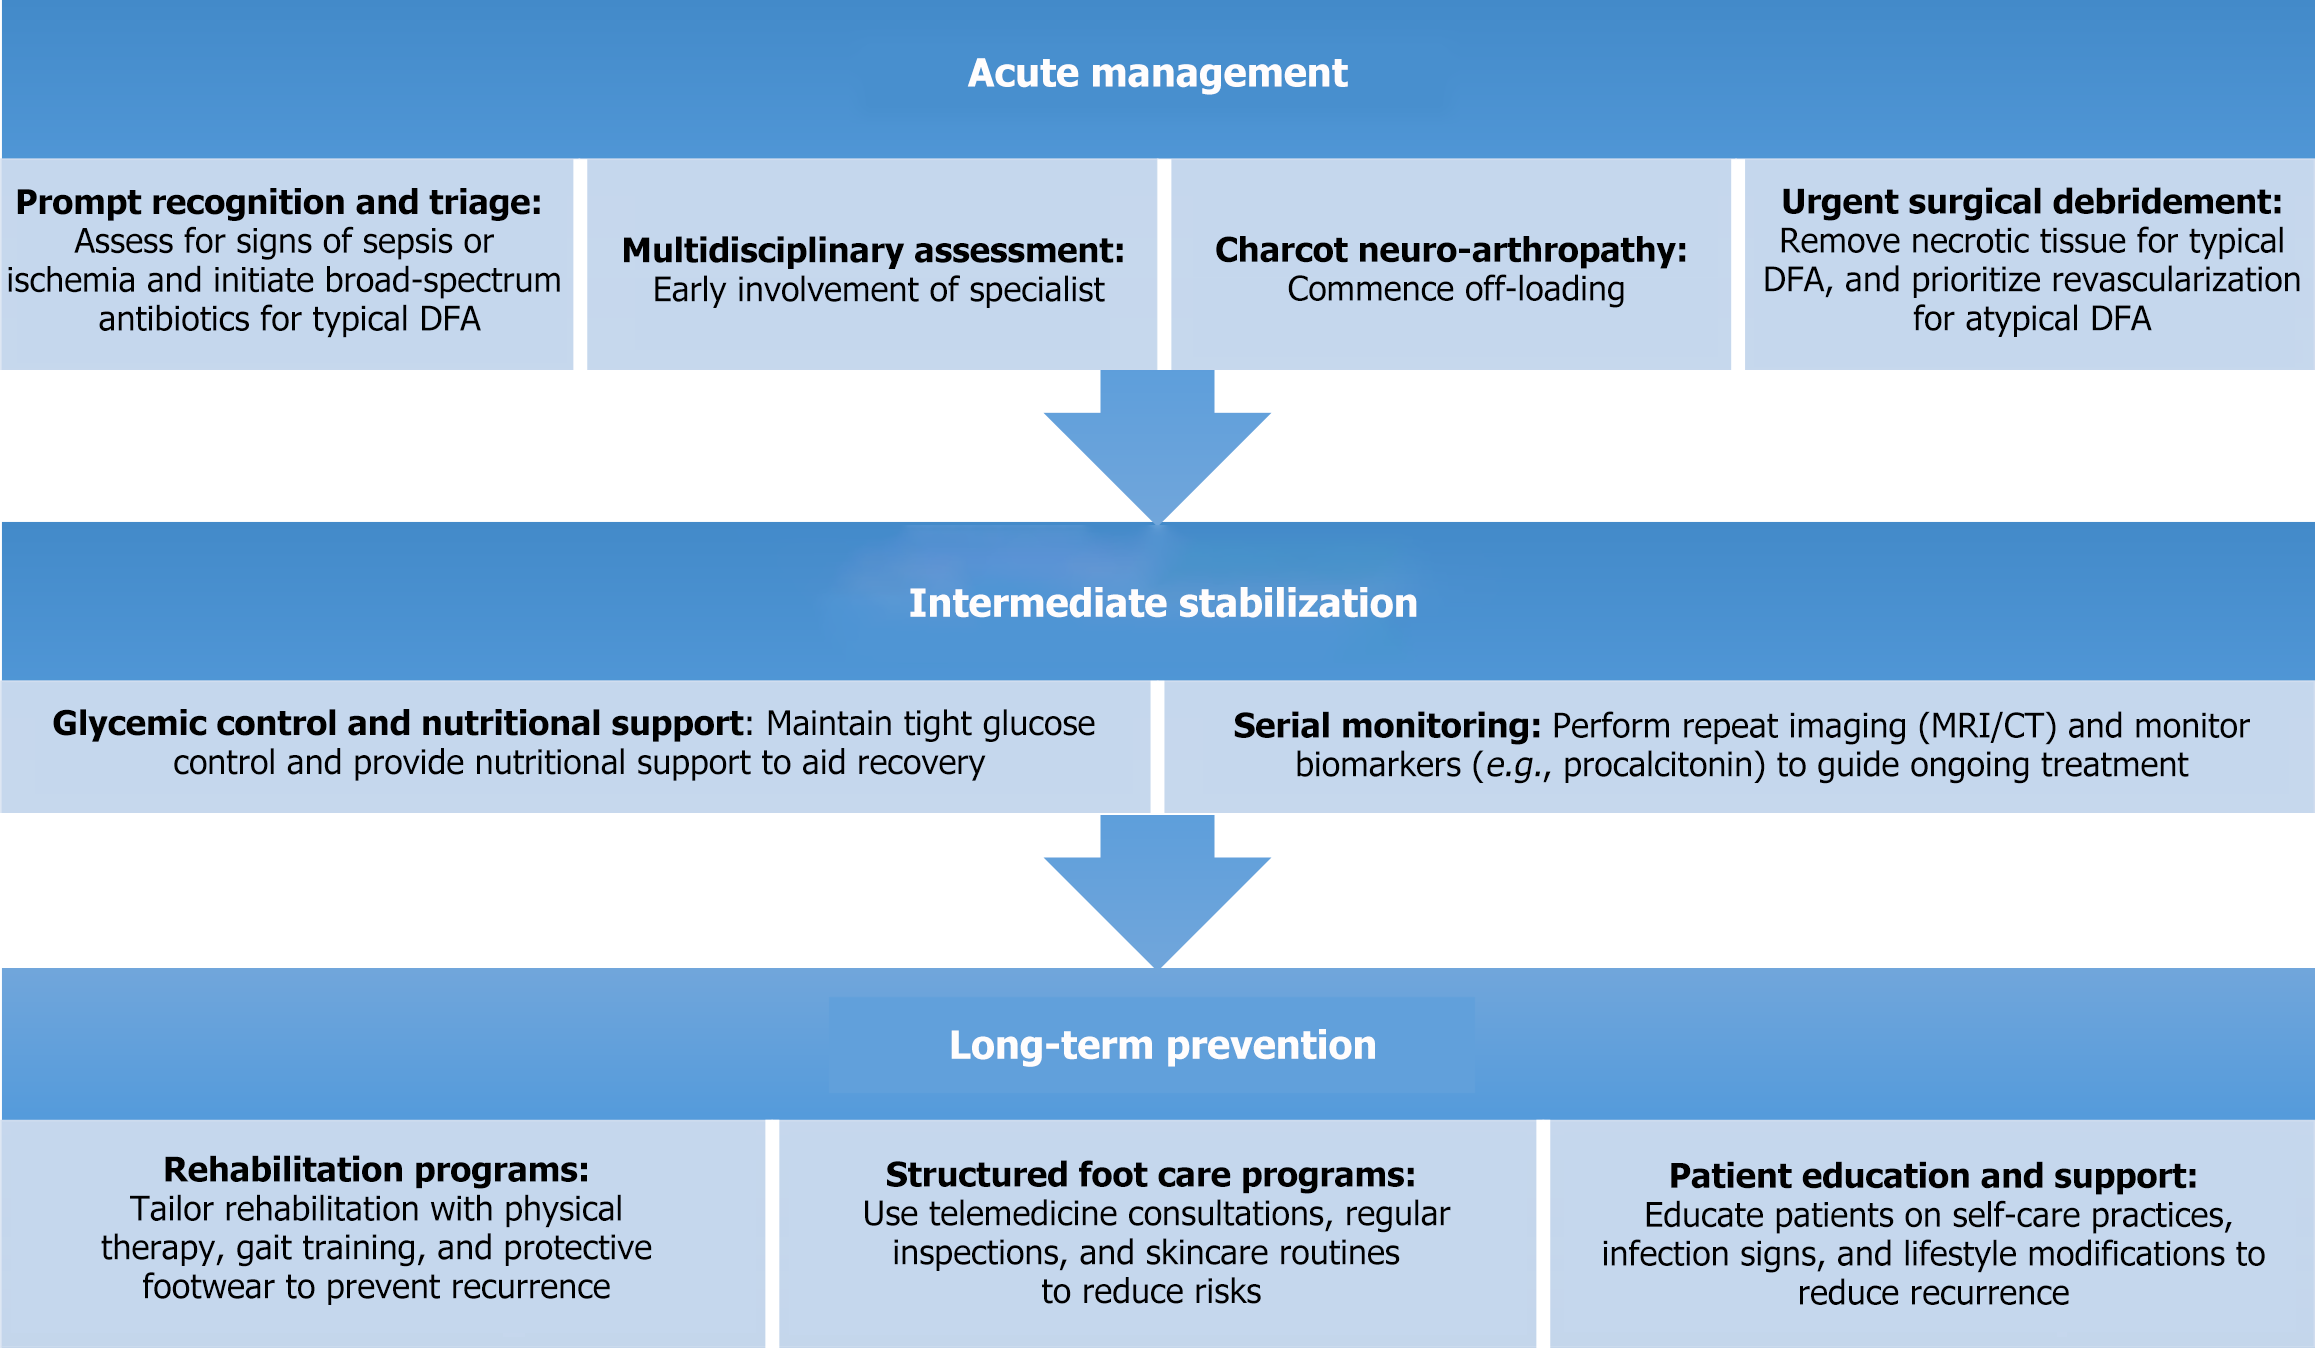
Figure 3 Flowchart of proposed treatment framework for diabetic foot attack.
DFA: Diabetic foot attack; MRI: Magnetic resonance imaging; CT: Computed tomography.
- Citation: Balakrishnan KR, Selva Raj DR, Ghosh S, Robertson GA. Diabetic foot attack: Managing severe sepsis in the diabetic patient. World J Crit Care Med 2025; 14(1): 98419
- URL: https://www.wjgnet.com/2220-3141/full/v14/i1/98419.htm
- DOI: https://dx.doi.org/10.5492/wjccm.v14.i1.98419


