Copyright
©The Author(s) 2024.
World J Crit Care Med. Dec 9, 2024; 13(4): 99564
Published online Dec 9, 2024. doi: 10.5492/wjccm.v13.i4.99564
Published online Dec 9, 2024. doi: 10.5492/wjccm.v13.i4.99564
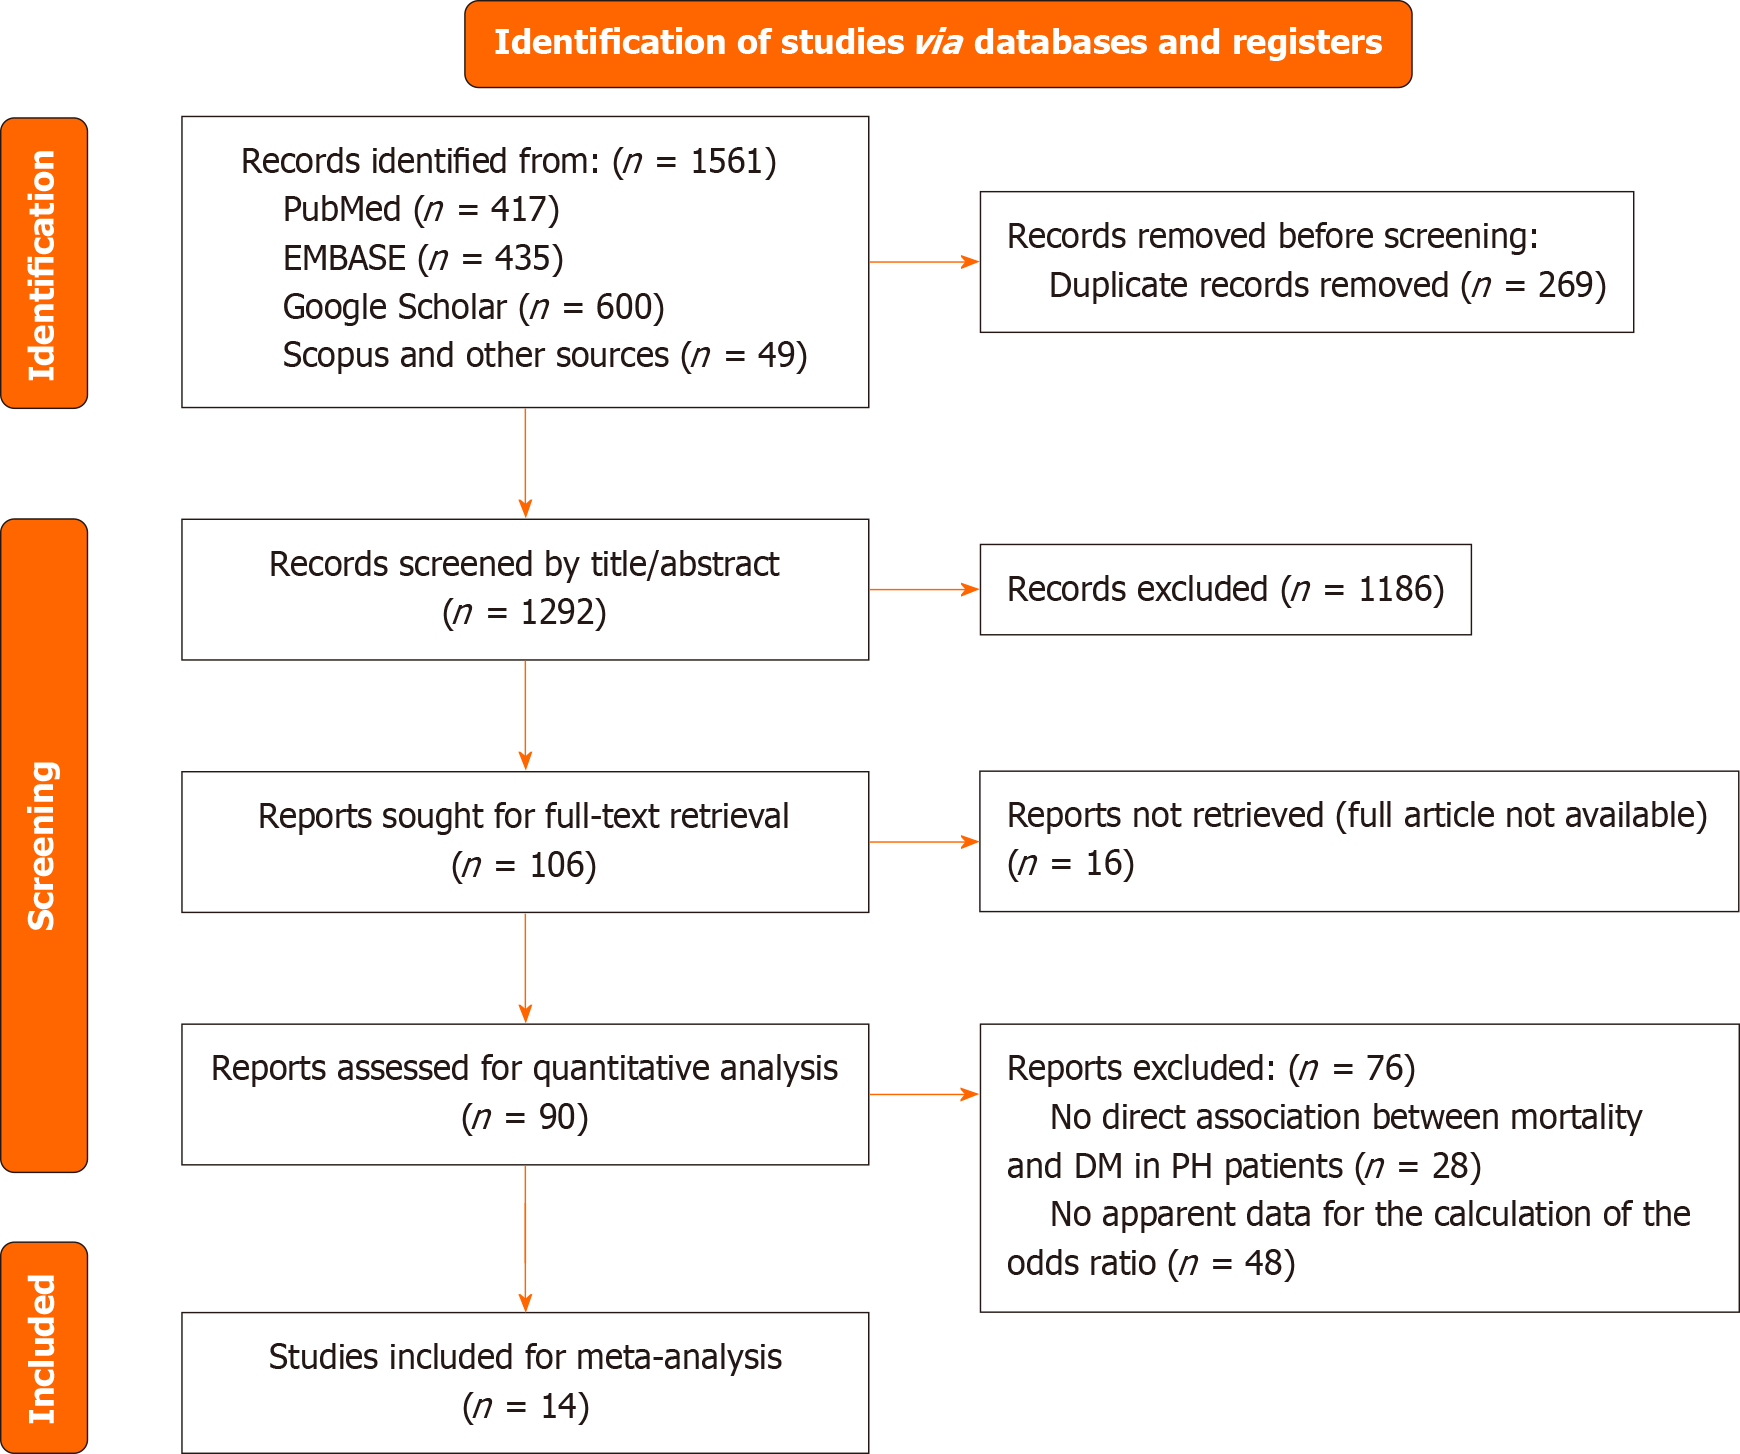
Figure 1 PRISMA flow diagram for included studies.
DM: Diabetes mellitus; PH: Pulmonary hypertension.
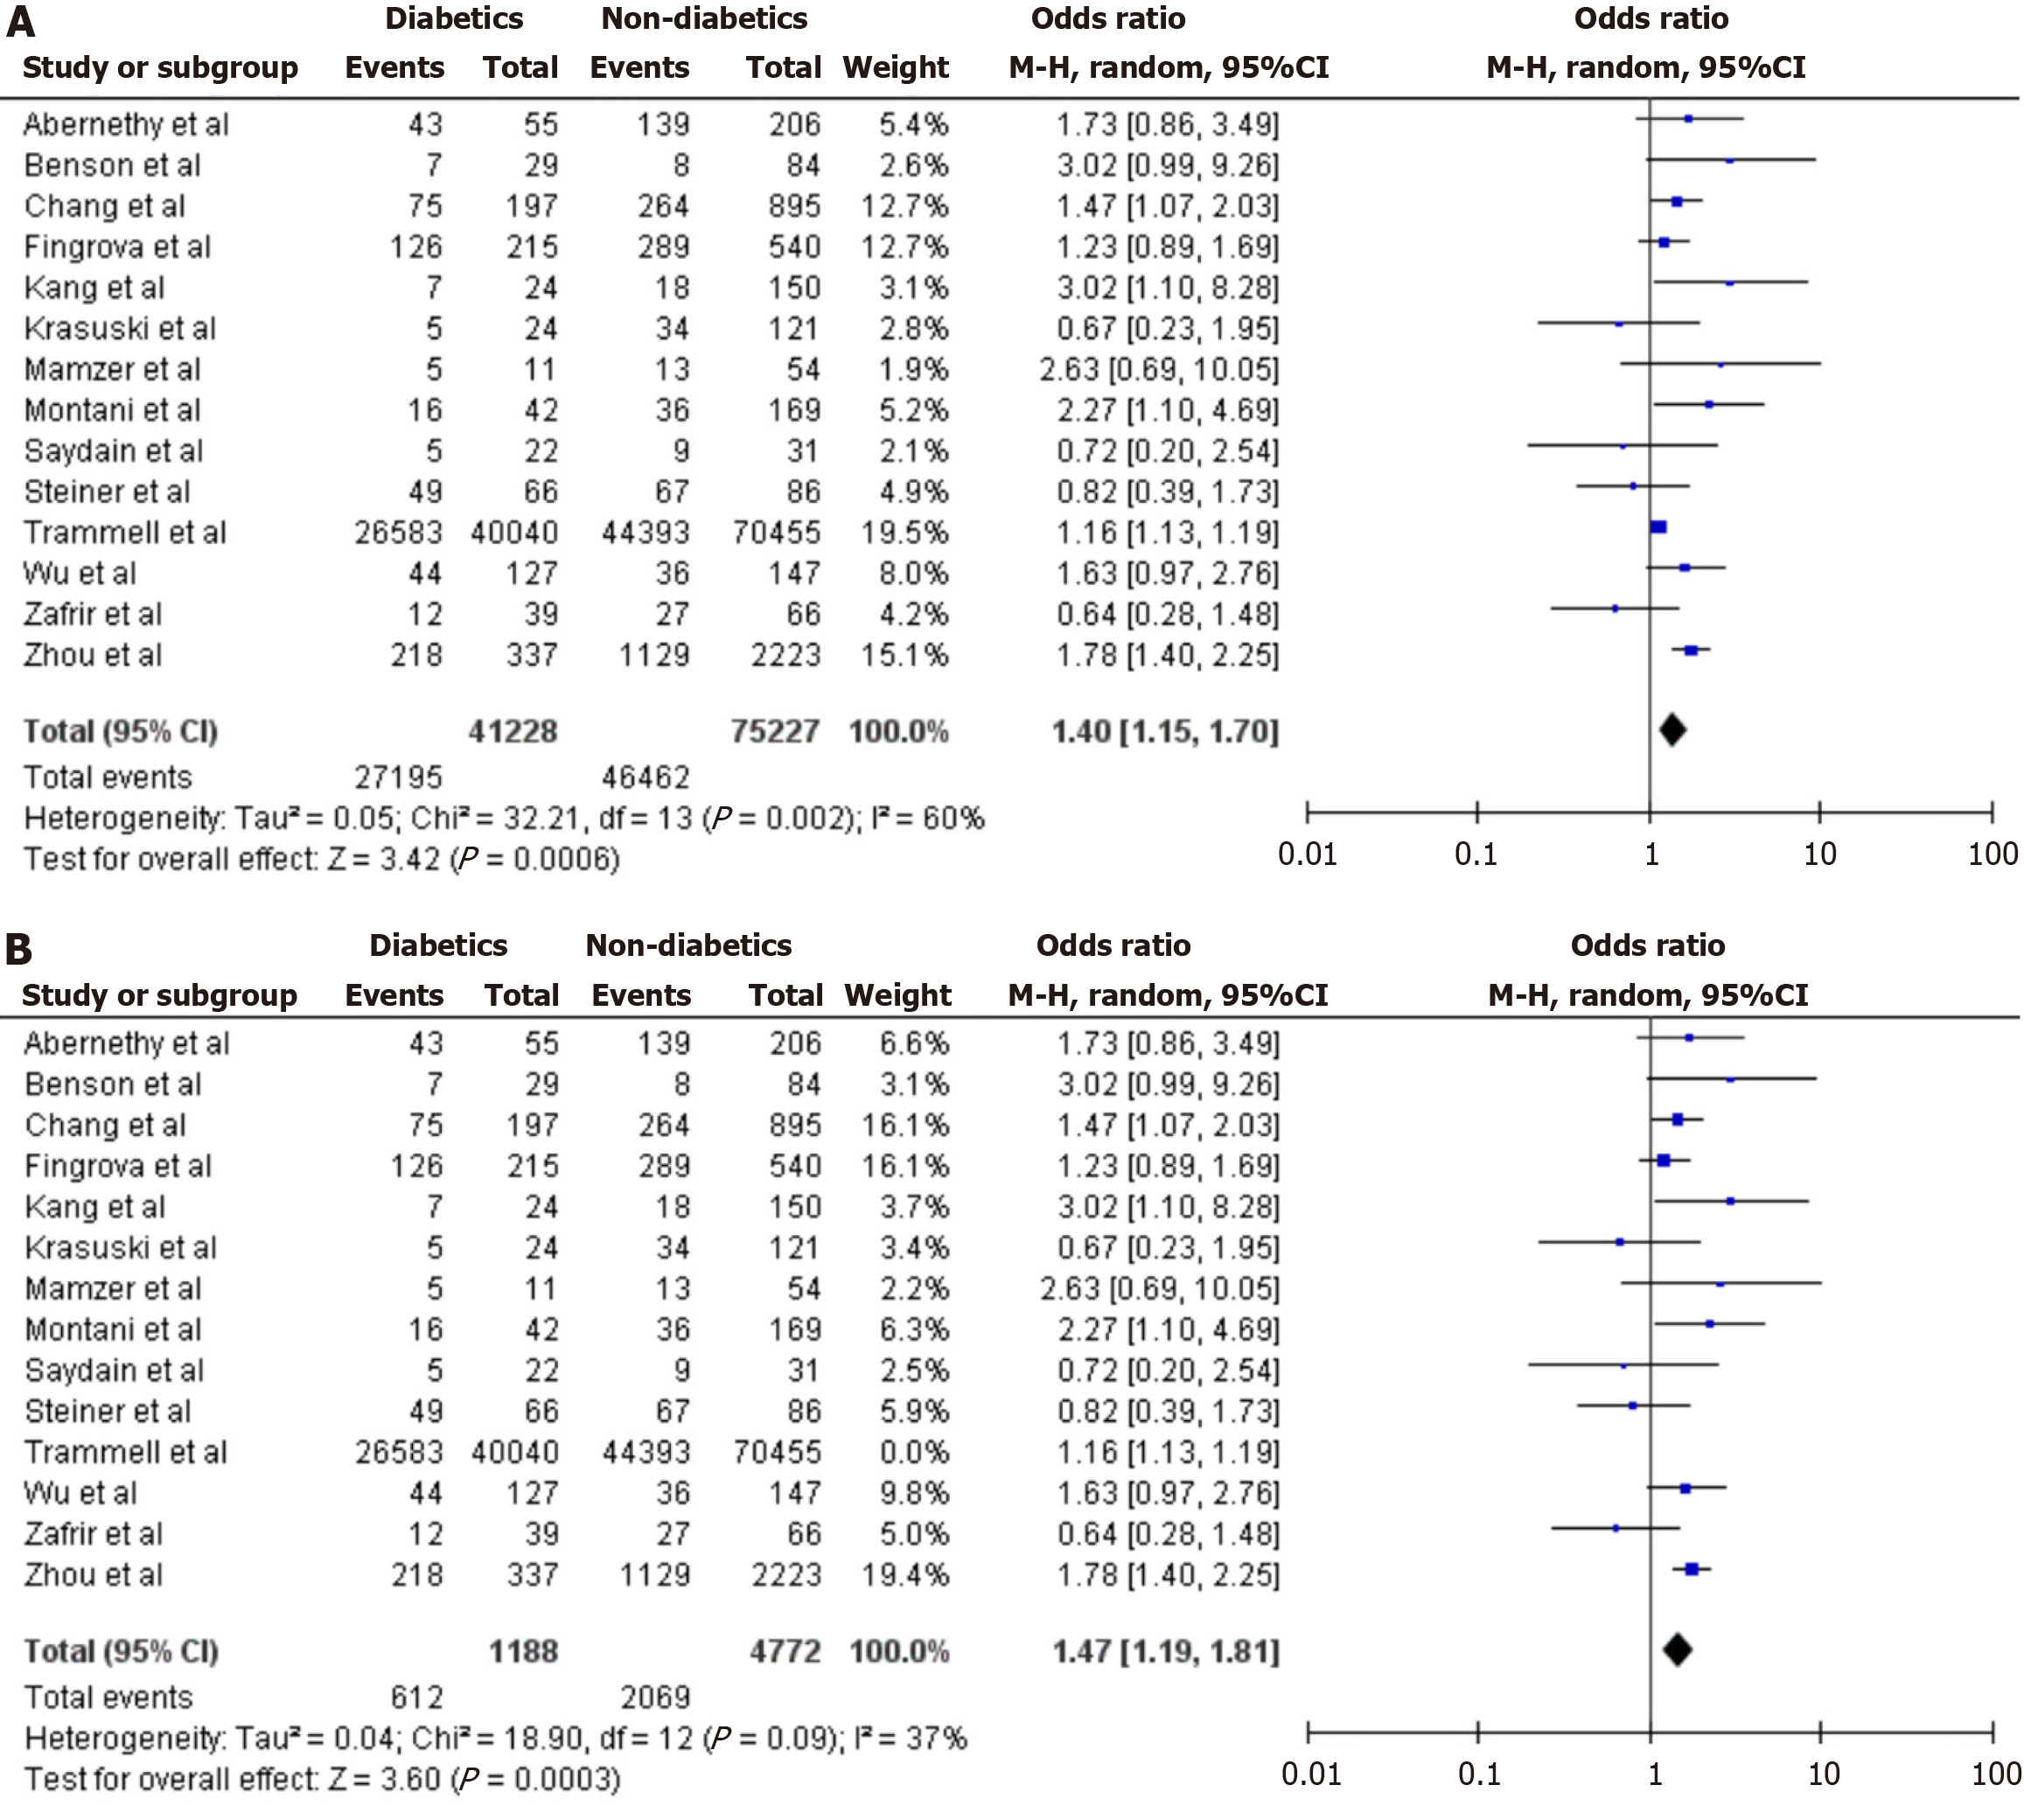
Figure 2 Forest plot.
A: Overall forest plot for all-cause mortality for diabetics vs non-diabetics pulmonary hypertension patients; B: Forest plot depicting sensitivity analysis after excluding the study by Trammell et al[34].
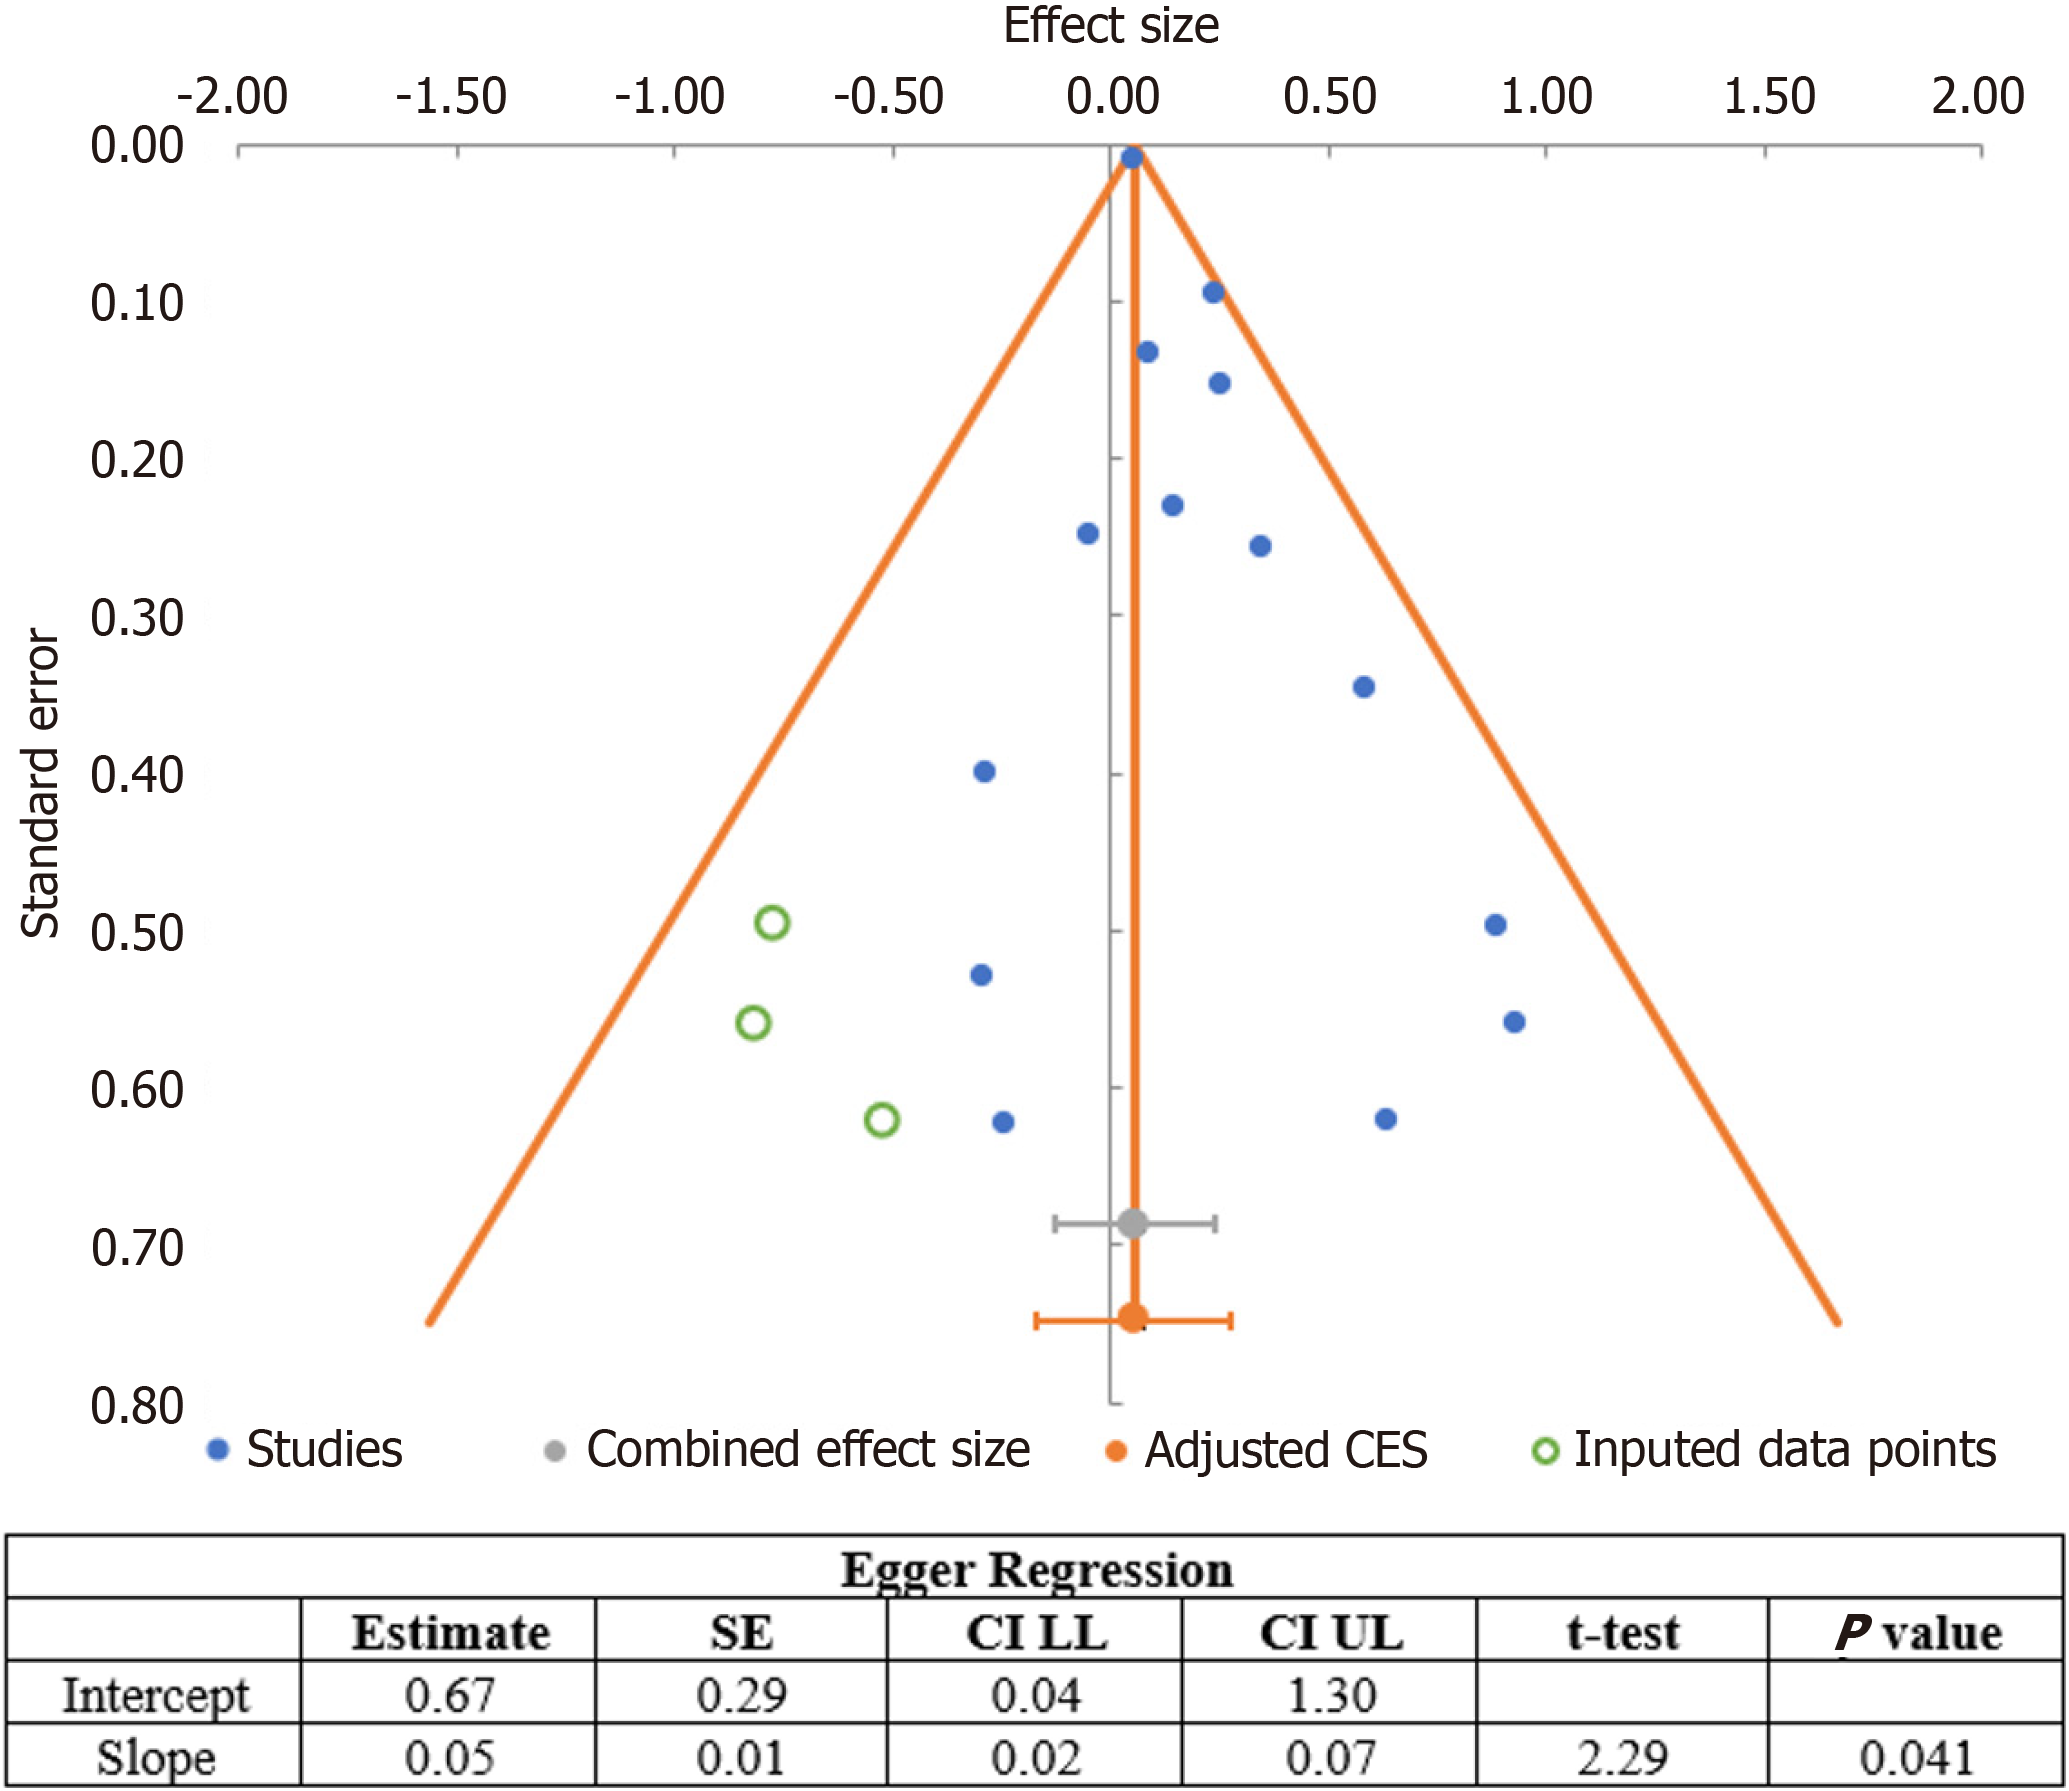
Figure 3 The Funnel Plot with Eggers test depicting the publication bias.
SE: Standard error; CILL: Confidence interval lower limit; CIUL: Confidence interval upper limit; Adjusted CES: Adjusted combined effect size.
- Citation: Padte S, Mehta P, Bansal V, singh N, Sunasra R, Goyal V, Chaudhary RB, Junnarkar Y, Shah V, Arshad Z, Nawaz FA, Surani S, Kashyap R. Impact of diabetes mellitus on mortality in pulmonary hypertension: A systematic review and meta-analysis. World J Crit Care Med 2024; 13(4): 99564
- URL: https://www.wjgnet.com/2220-3141/full/v13/i4/99564.htm
- DOI: https://dx.doi.org/10.5492/wjccm.v13.i4.99564


