Copyright
©The Author(s) 2024.
World J Crit Care Med. Jun 9, 2024; 13(2): 93812
Published online Jun 9, 2024. doi: 10.5492/wjccm.v13.i2.93812
Published online Jun 9, 2024. doi: 10.5492/wjccm.v13.i2.93812
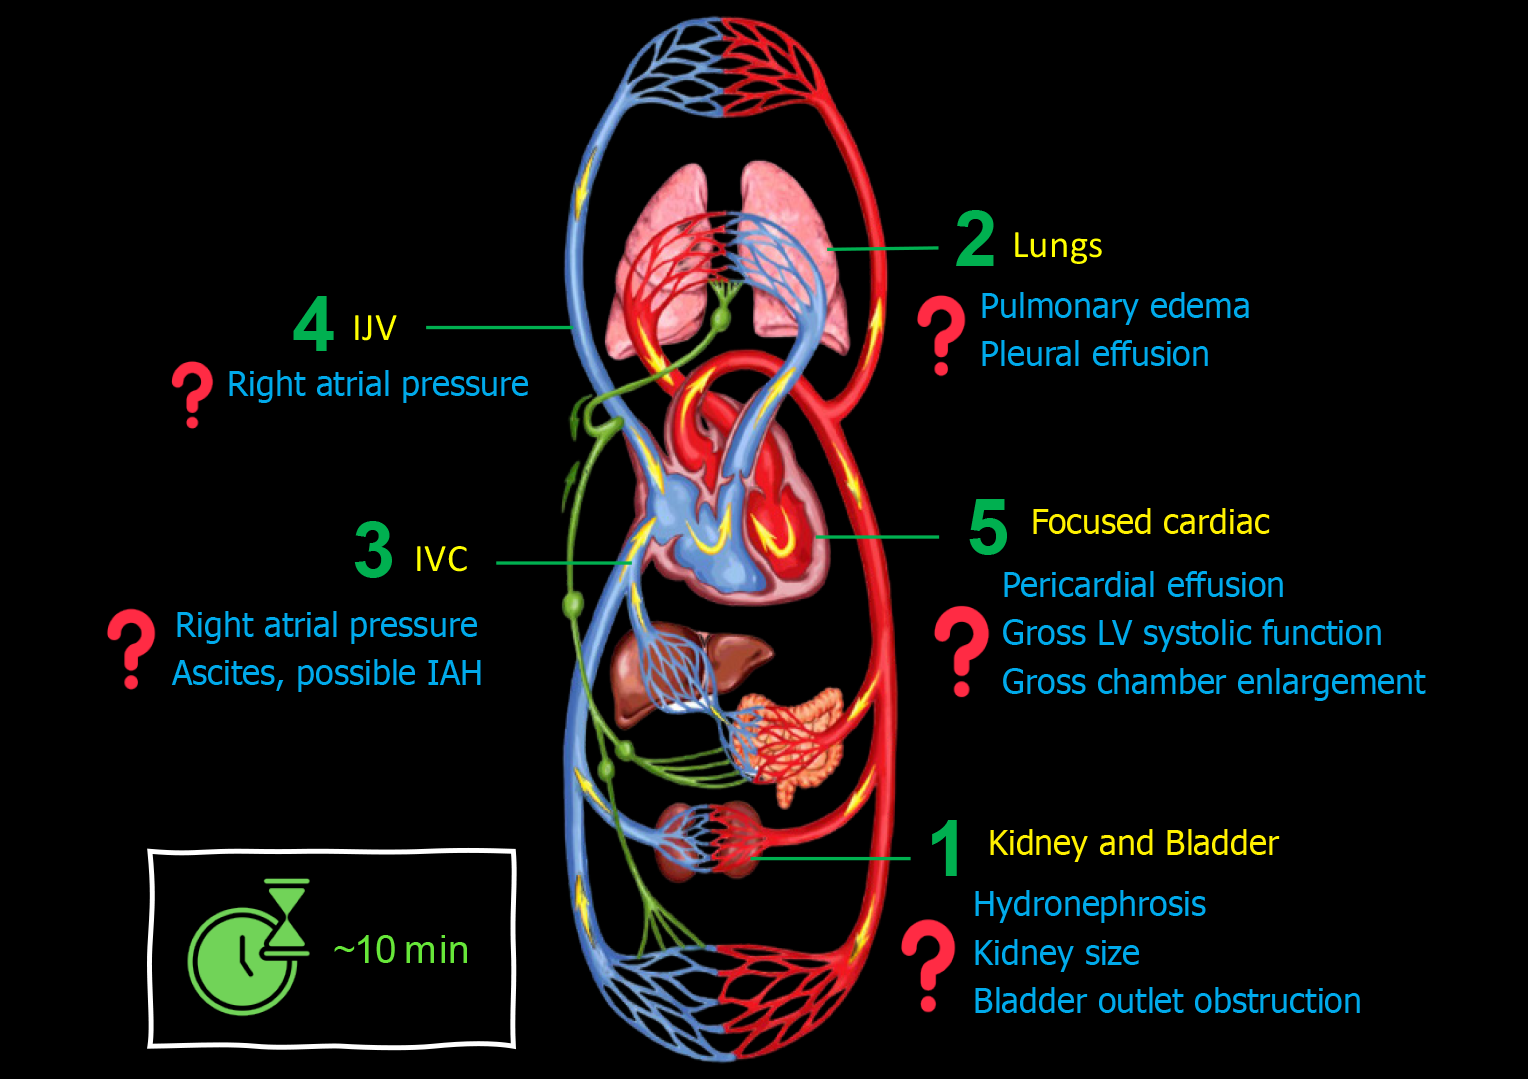
Figure 1 Basic point-of-care ultrasound evaluation in a patient with cirrhosis and acute kidney injury illustrating common focused clinical questions.
IJV: Internal jugular vein; IVC: Inferior vena cava.
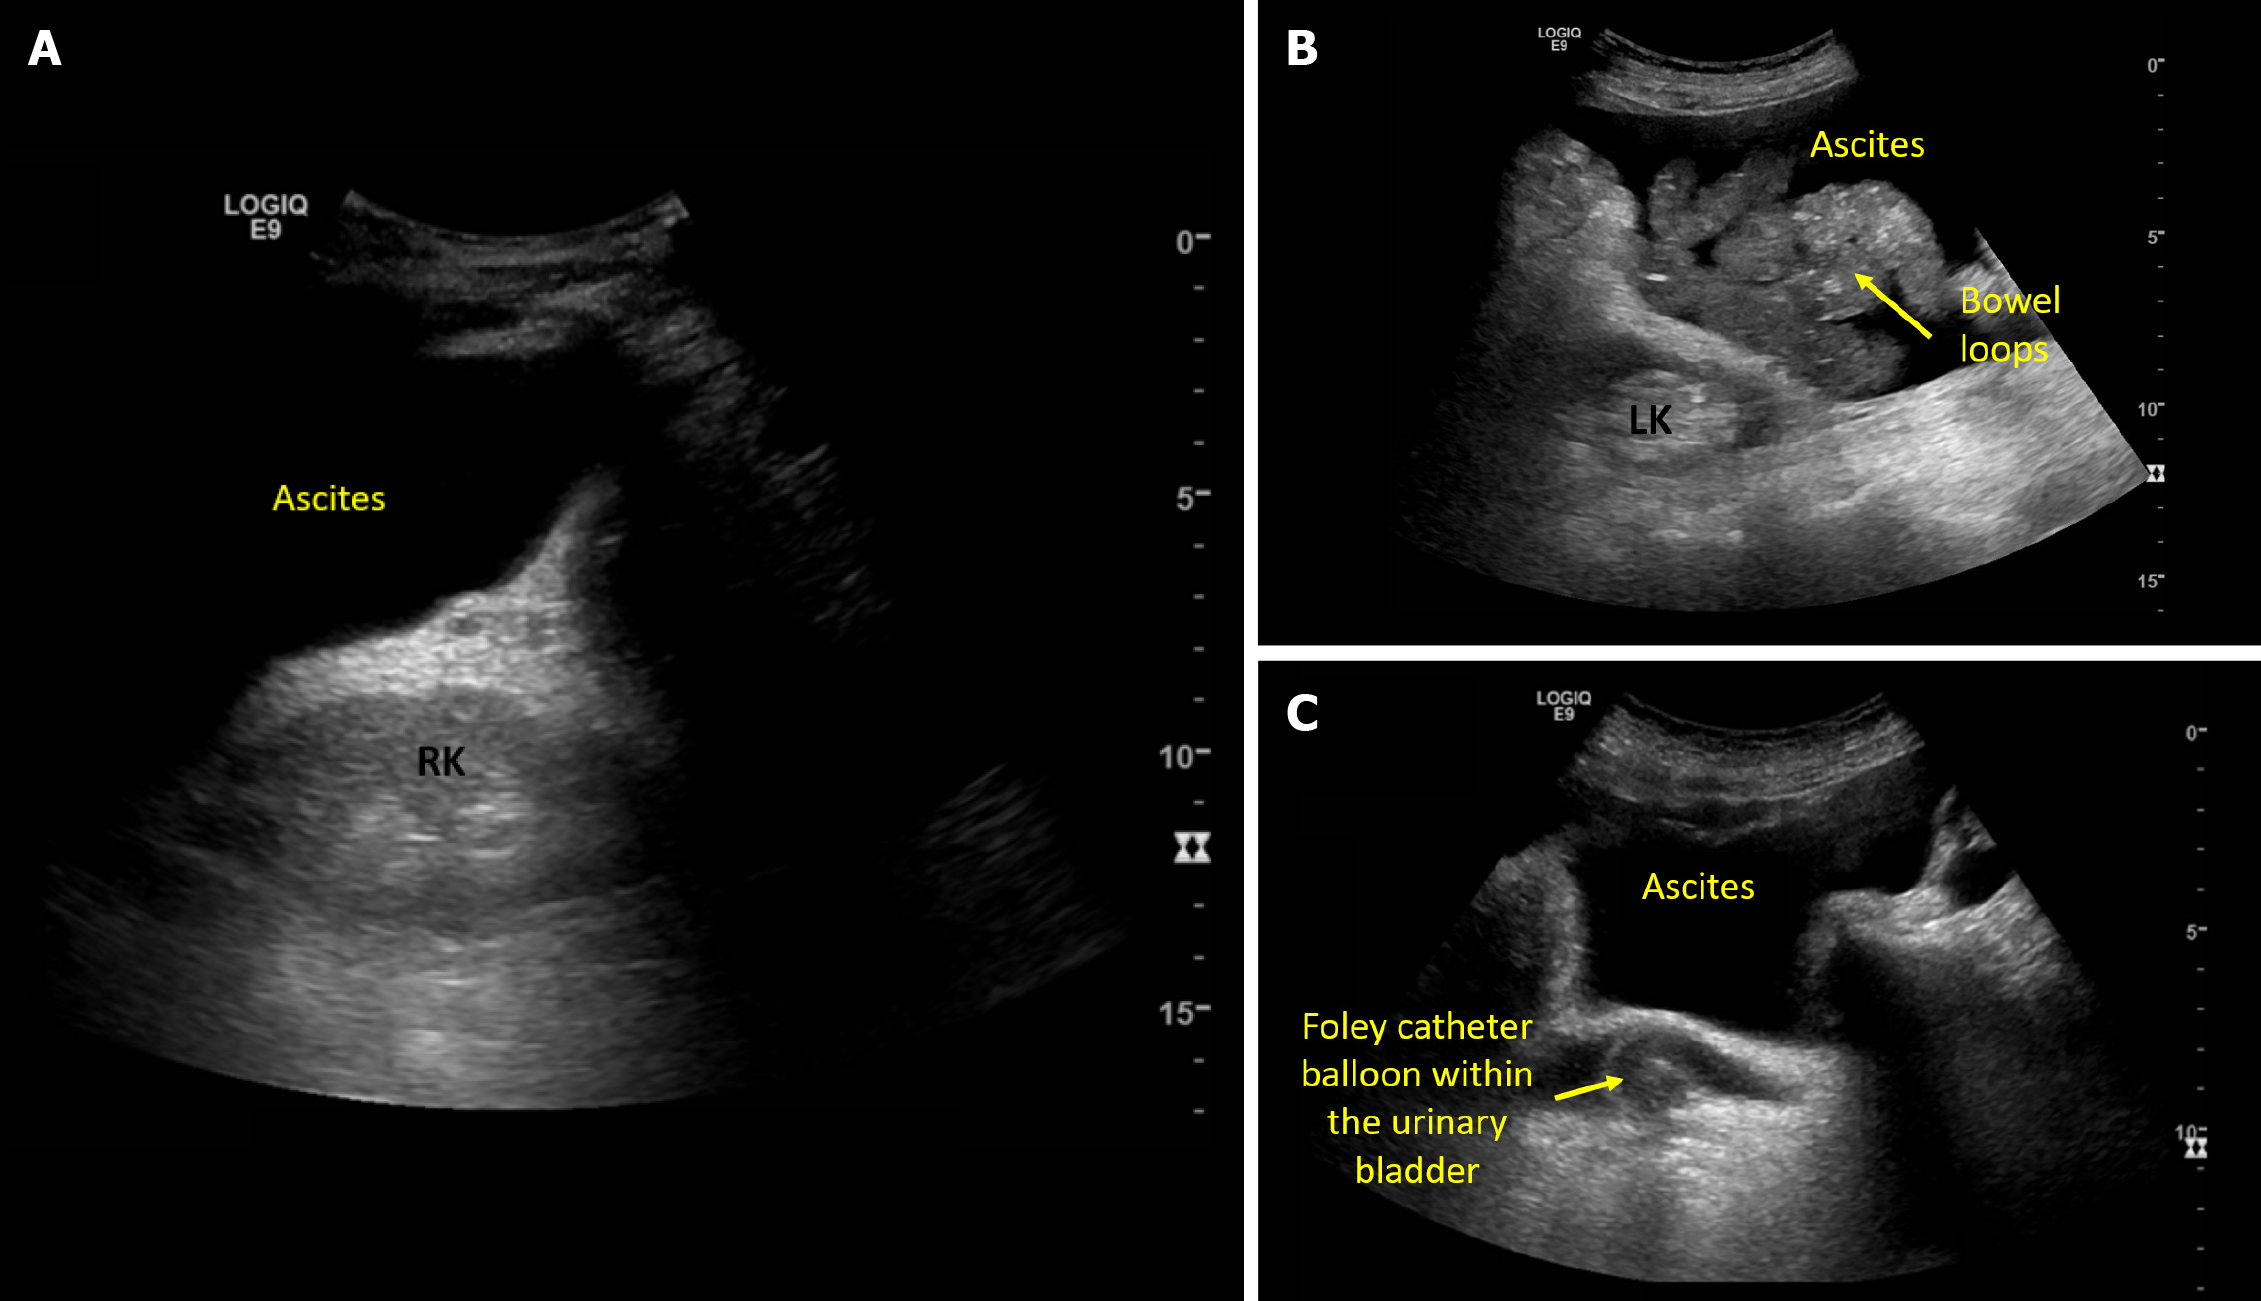
Figure 2 Ultrasound images demonstrating.
A: Acoustic enhancement from ascites making the right kidney appear bright; B: Left kidney adjacent to ascites and bowel loops; C: Pelvic ascites and a urinary bladder decompressed with Foley catheter.
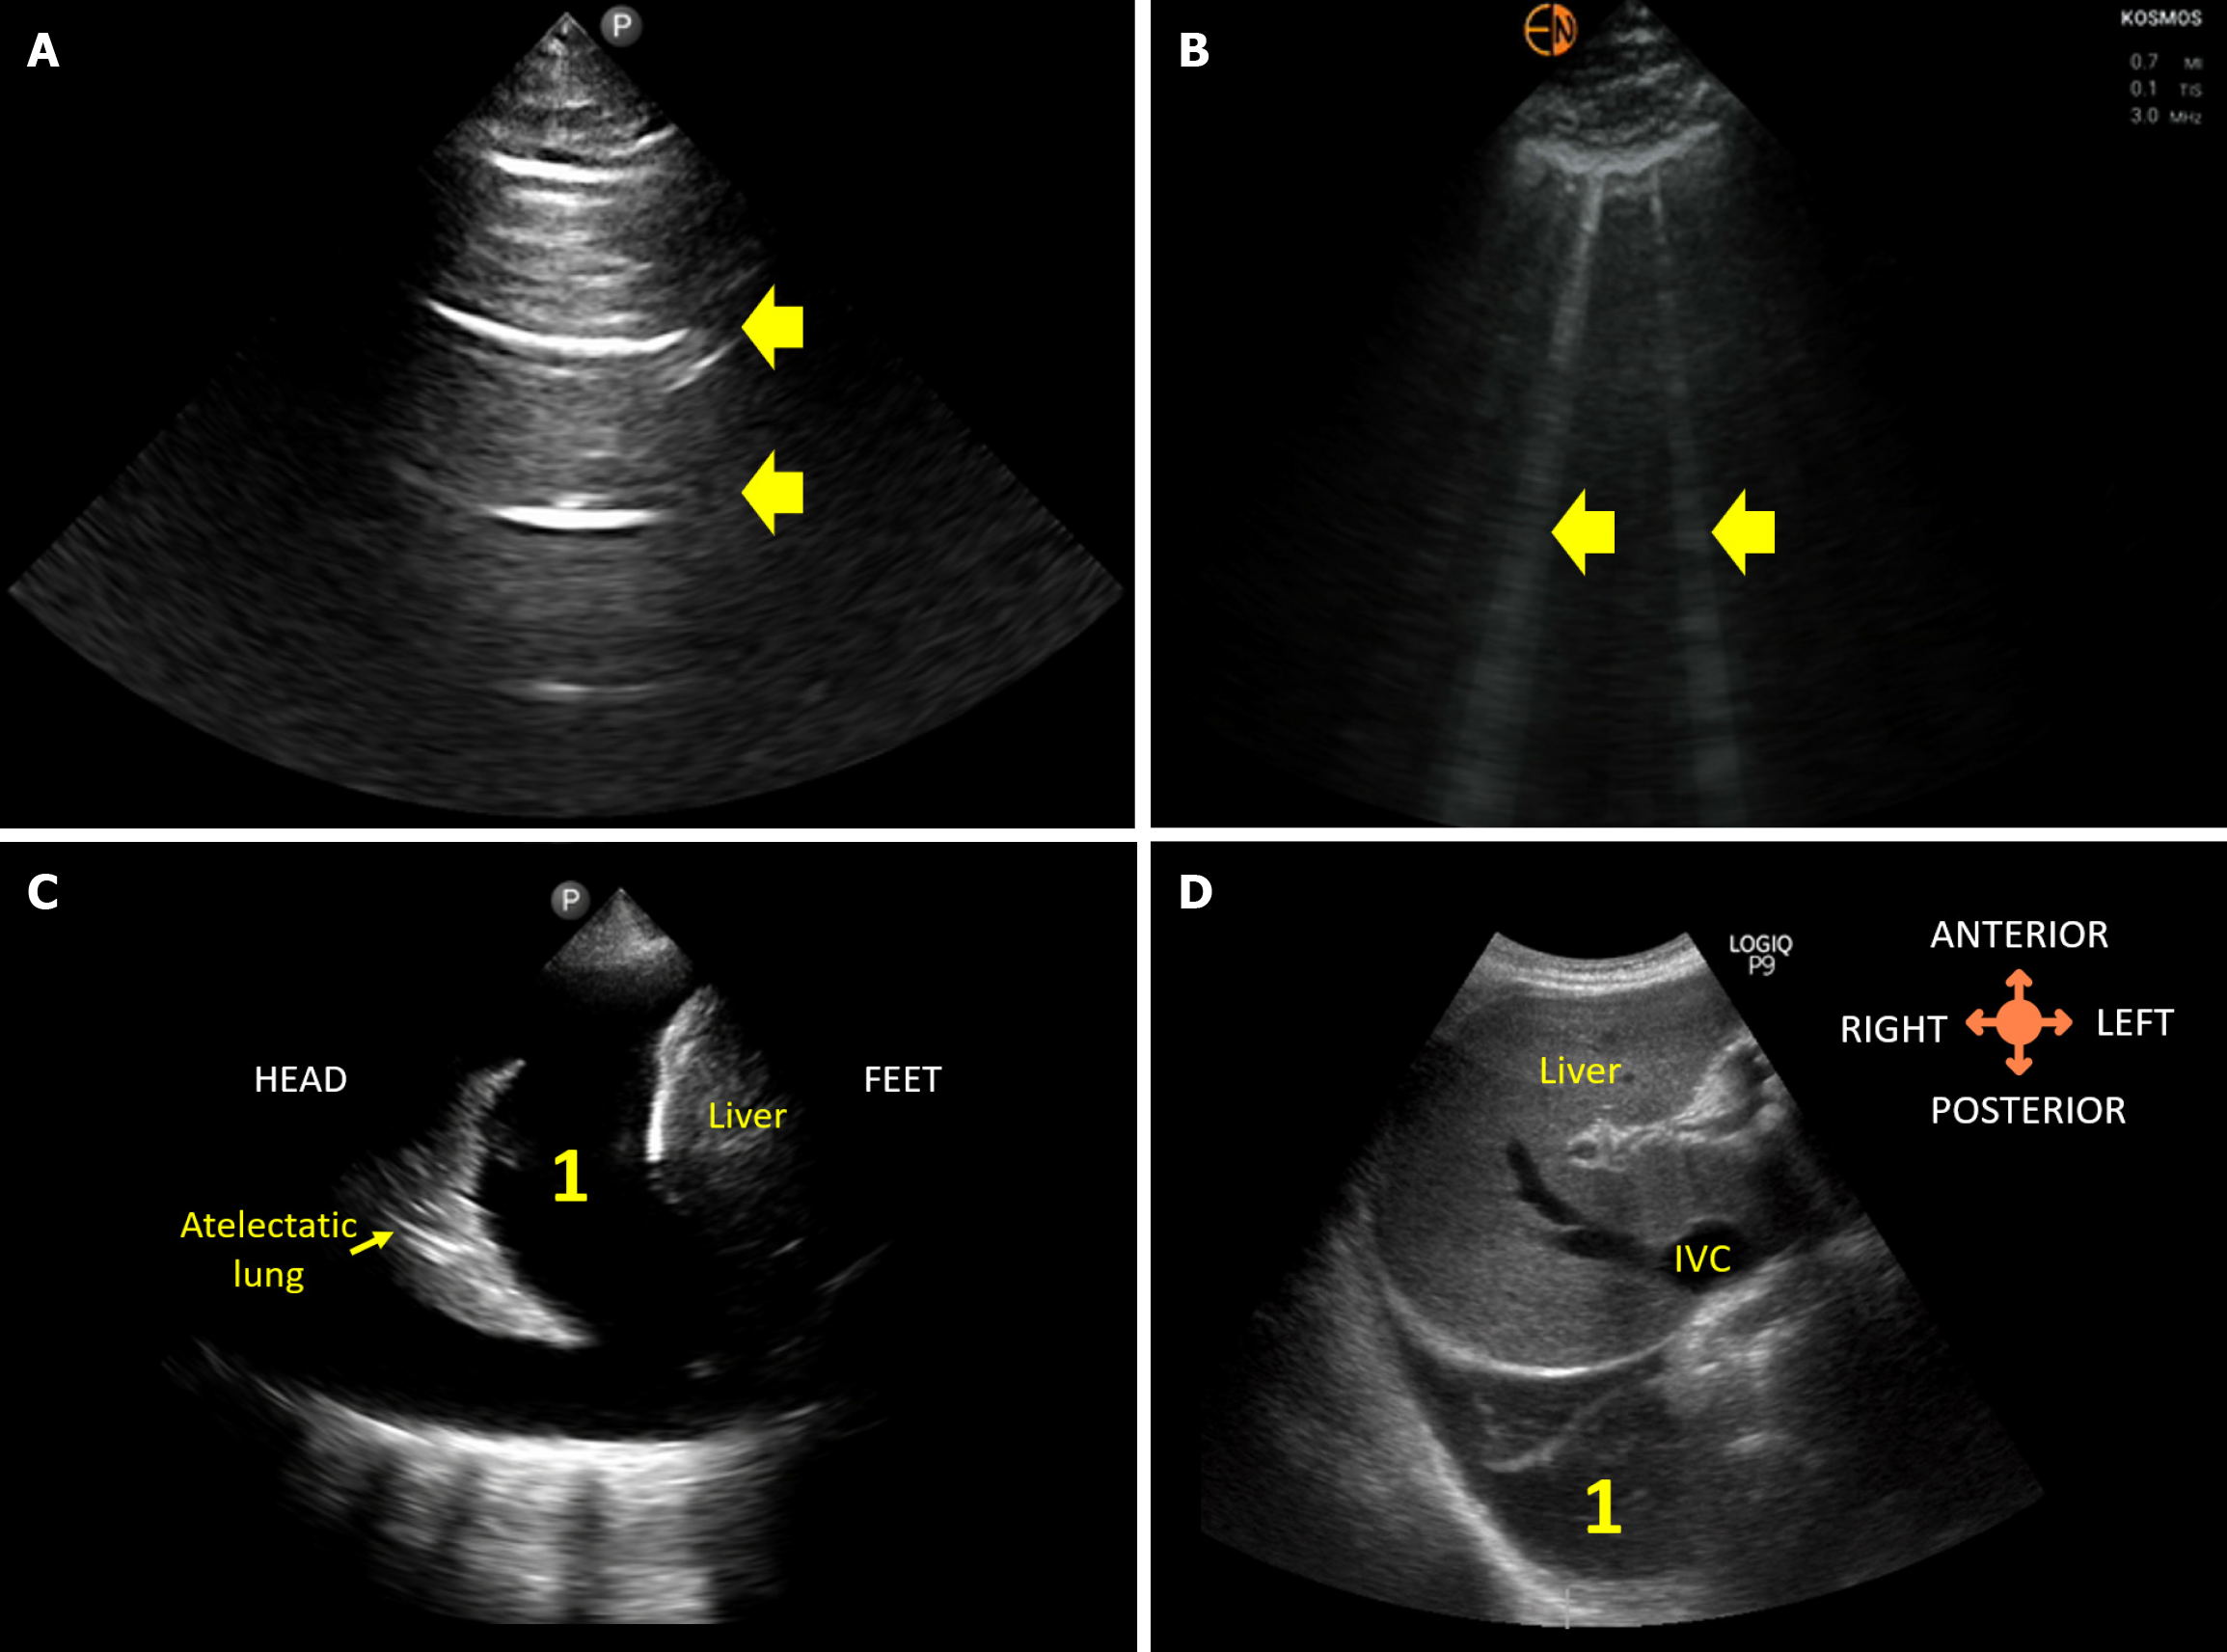
Figure 3 Lung ultrasound images demonstrating.
A: Normal A-lines; B: B-lines (vertical artifacts) suggestive of extravascular lung water; C: 1Pleural effusion visualized from the conventional lateral view; D: 1Right pleural effusion visualized from the subcostal view.
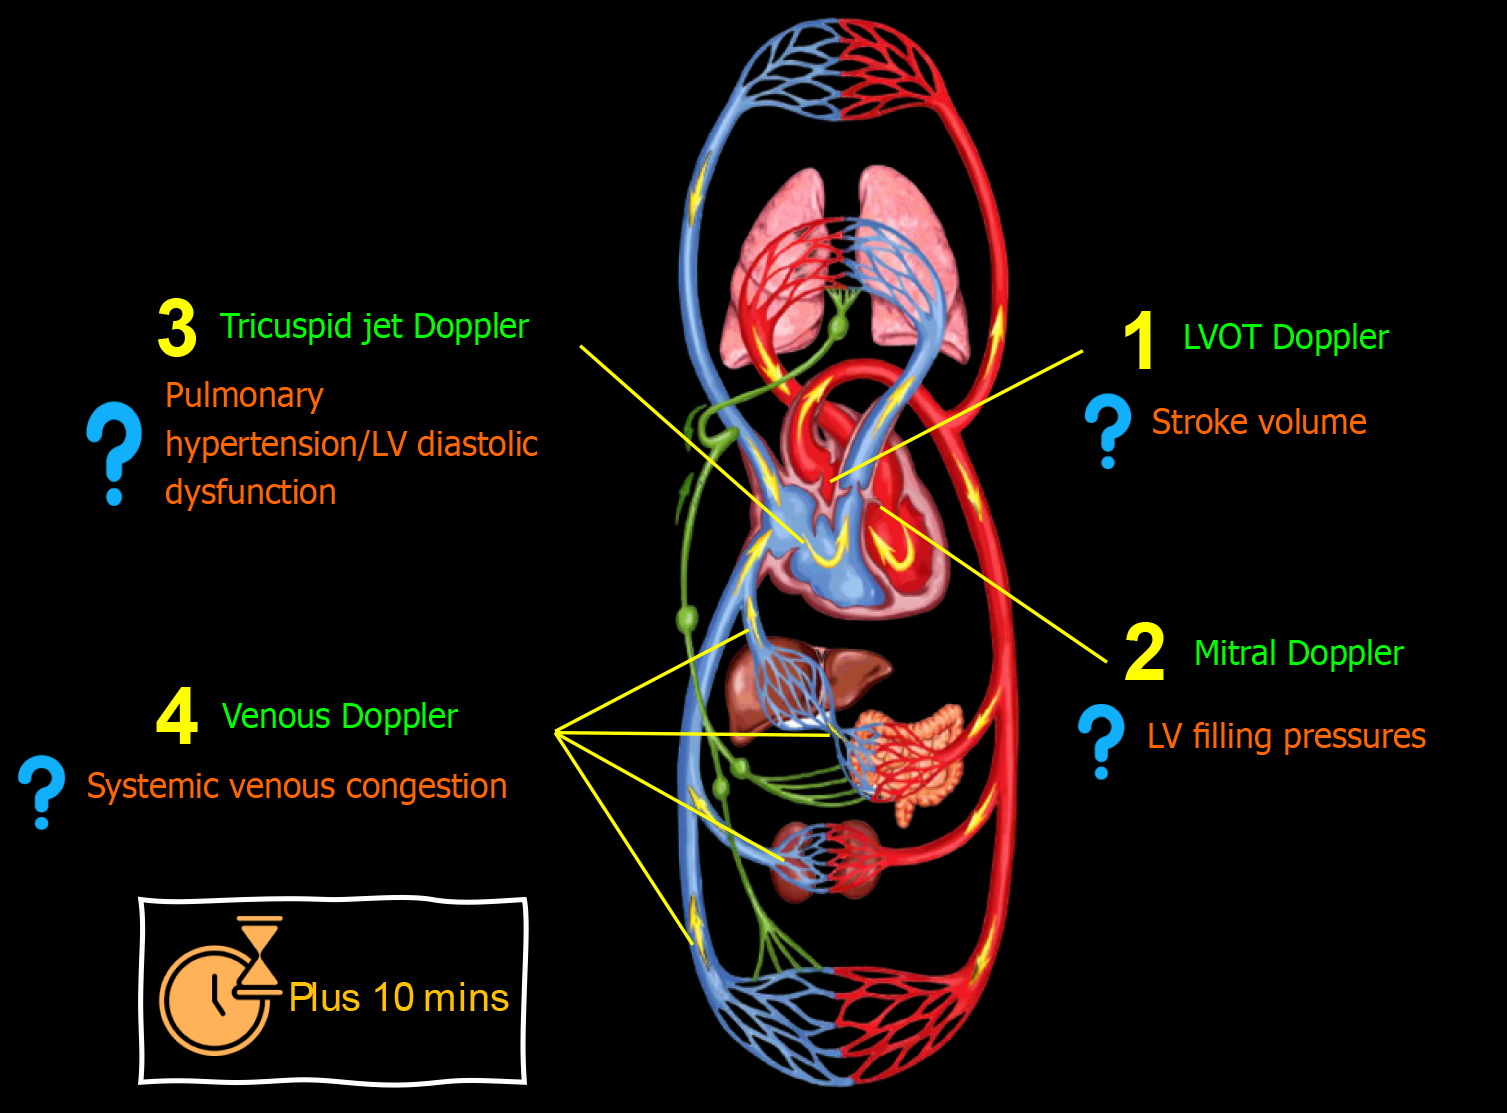
Figure 4 Advanced (using spectral Doppler) point-of-care ultrasound evaluation in a patient with cirrhosis and acute kidney injury illustrating common focused clinical questions.
Plus 10 min indicates typical time taken in addition to basic point-of-care ultrasonography. LV: Left ventricular.
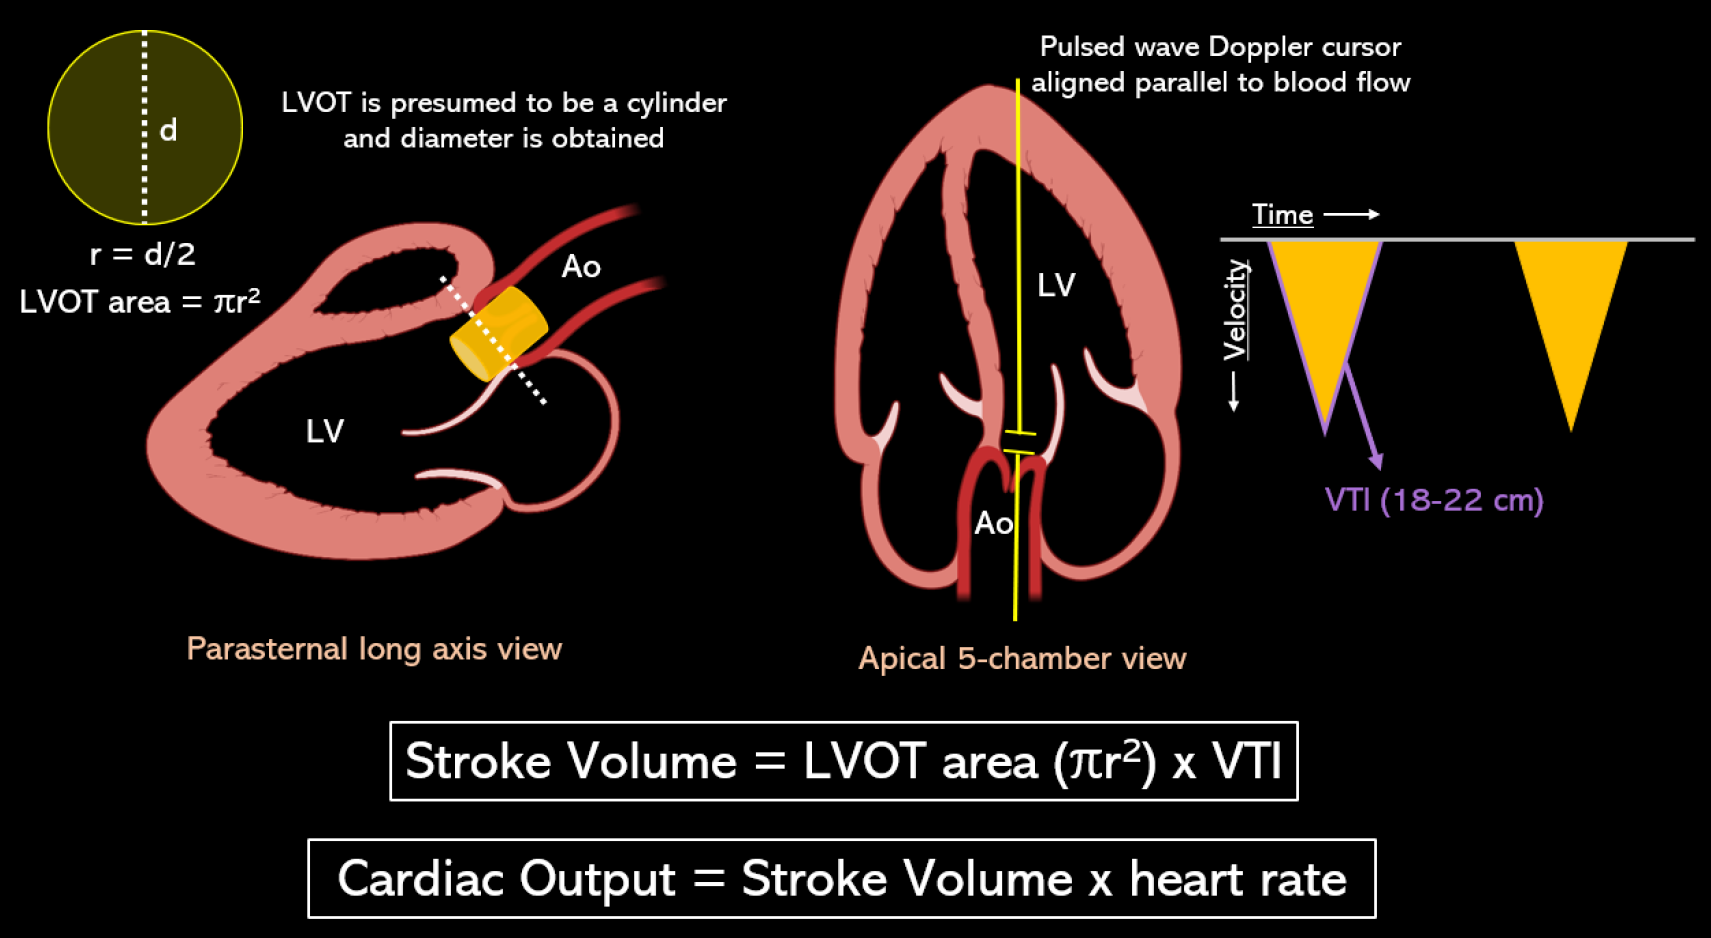
Figure 5 Stroke volume is the product of the cross-sectional area of left ventricular outflow tract in cm2 and velocity time integral in cm.
Left ventricular outflow tract (LVOT) area is derived from the LVOT diameter in zoomed parasternal view using the formula πr2 assuming it to be a circle, and LVOT velocity time integral is obtained by tracing the envelope of the pulsed wave Doppler spectrum of systolic flow in the apical 5-chamber view. LVOT: Left ventricular outflow tract; VTI: Velocity time integral. Citation: Argaiz ER, Romero-Gonzalez G, Rola P, Spiegel R, Haycock KH, Koratala A. Bedside Ultrasound in the Management of Cardiorenal Syndromes: An Updated Review. Cardiorenal Med 2023; 13: 372-384. Copyright ©The Silverchair Publisher 2023. Published by Karger Publishers.
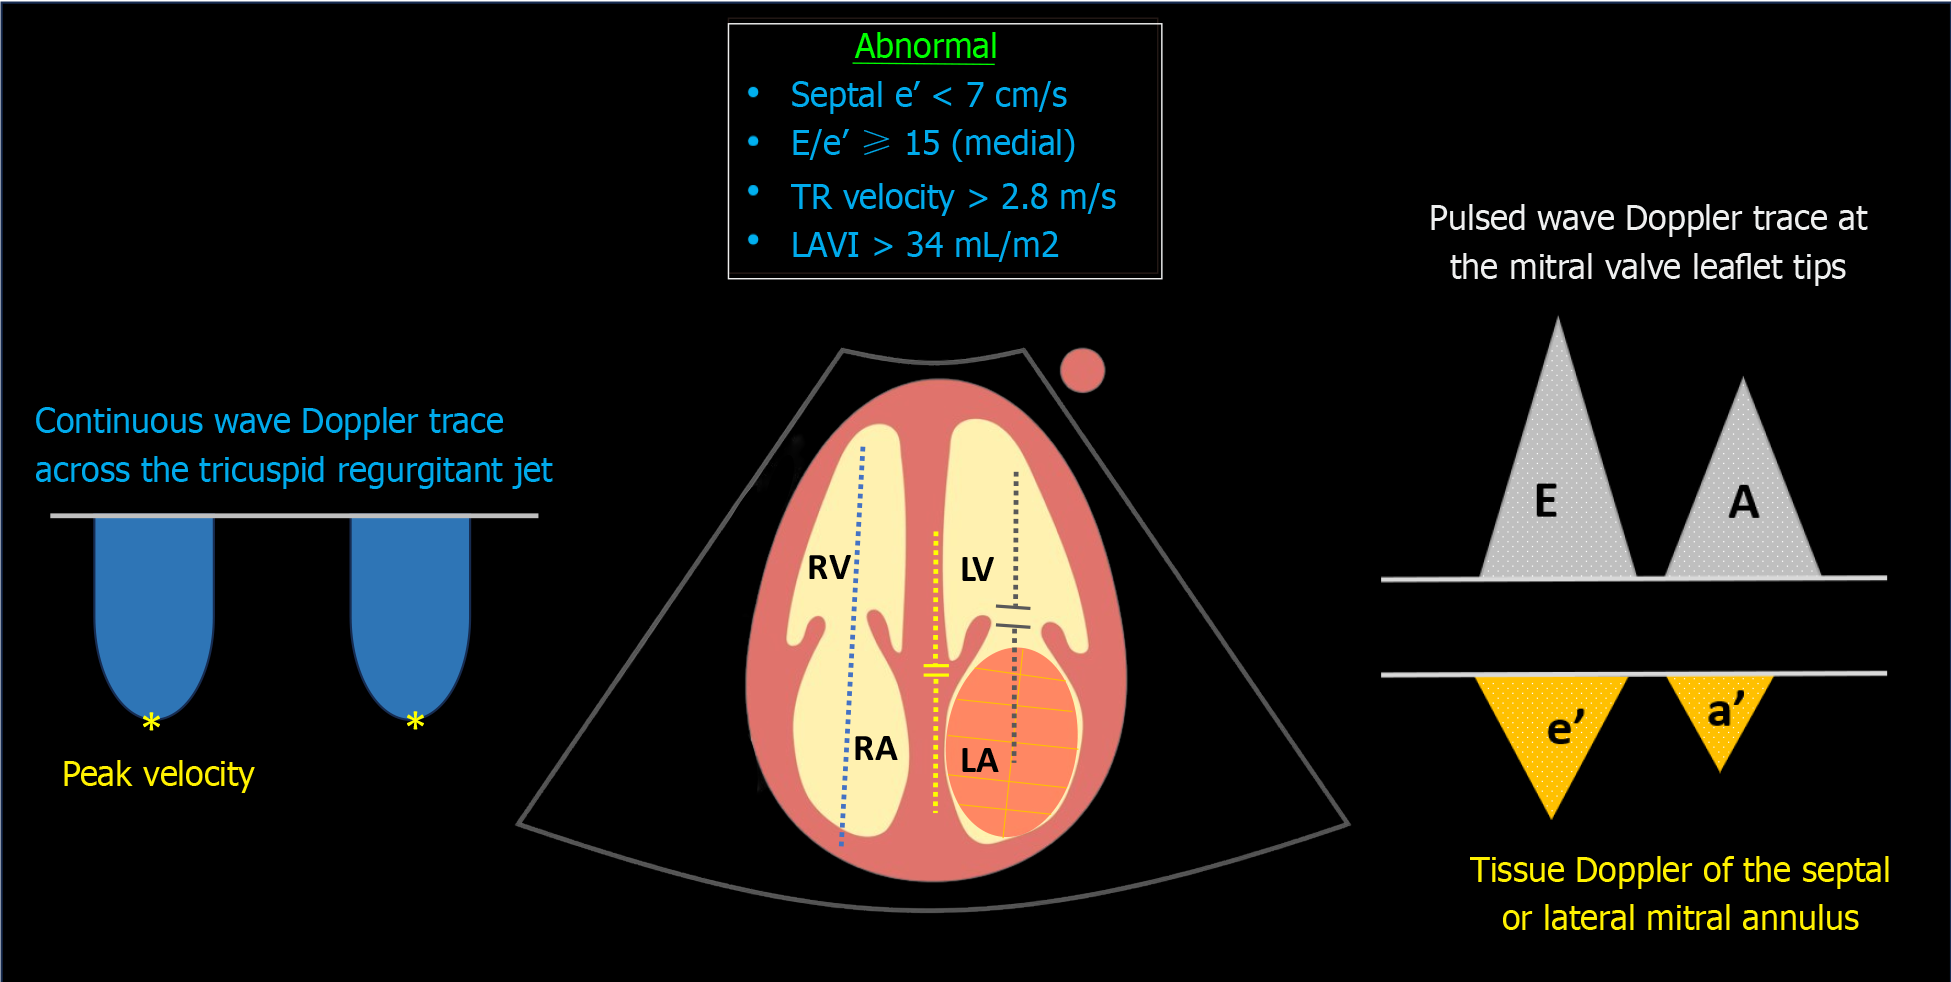
Figure 6 Sonographic parameters used in the assessment of diastolic dysfunction.
Blue dotted line denotes continuous wave Doppler across the tricuspid valve; yellow dotted line indicates tissue Doppler of the medial mitral annulus; grey dotted line represents transmitral pulsed wave Doppler. TR: Tricuspid regurgitation; LAVI: Left atrial volume index; LV: Left ventricle; LA: Left atrium; RV: Right ventricle; RA: Right atrium.
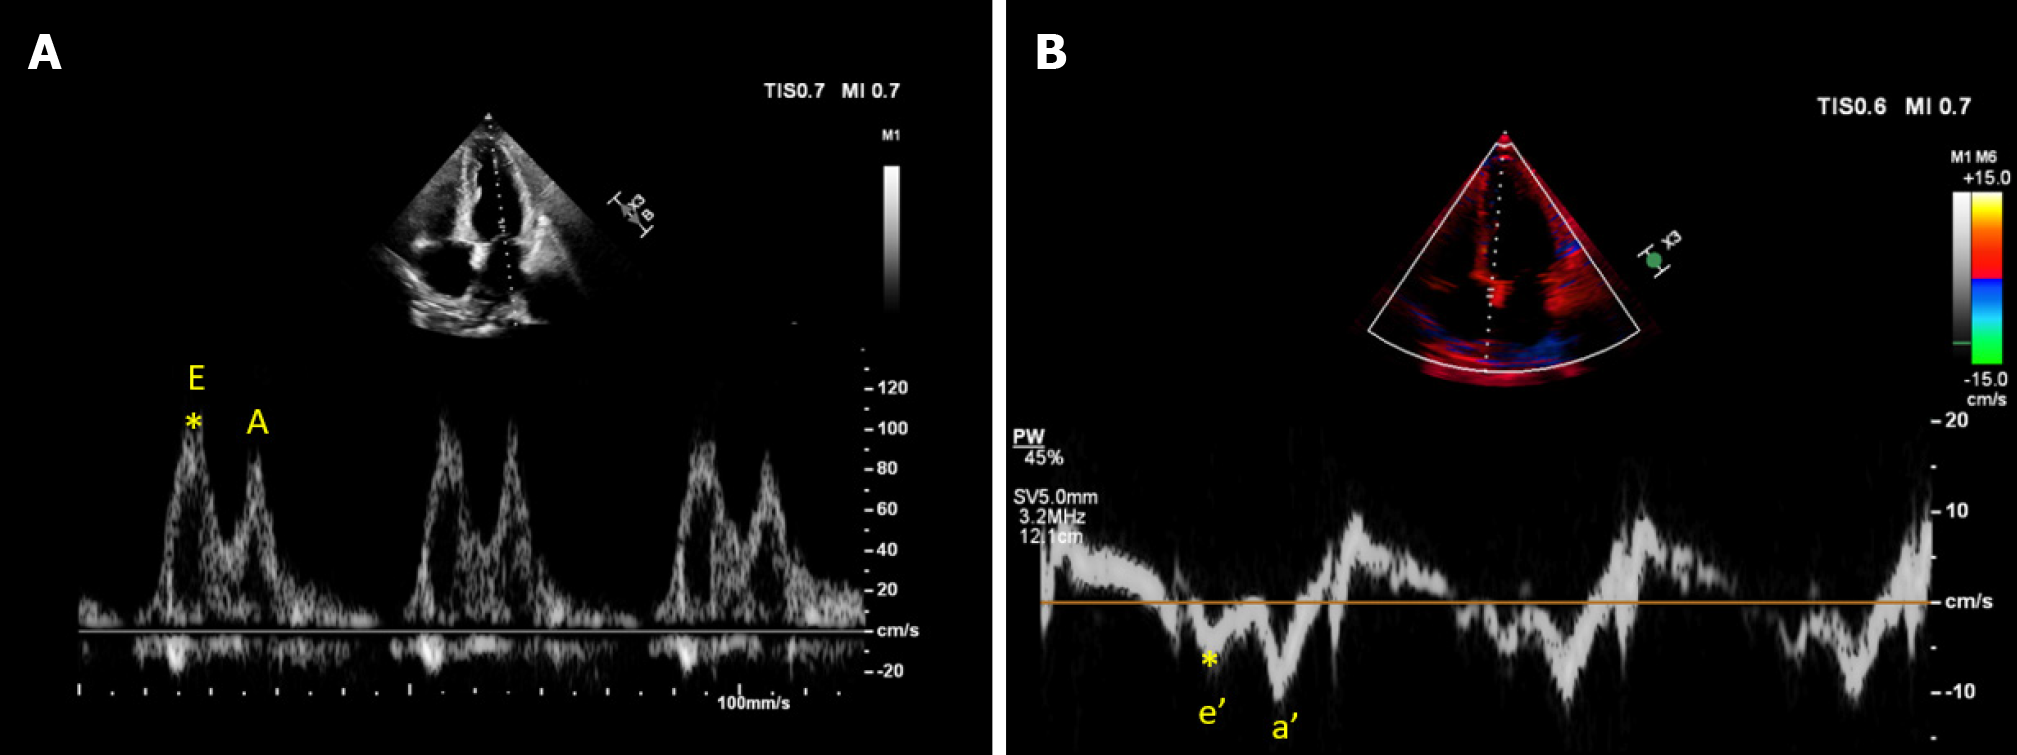
Figure 7 Cardiac ultrasound images from a patient with cirrhosis demonstrating.
A: Transmitral pulsed wave Doppler early diastolic wave (E) velocity approximately 100 cm/s; B: Tissue Doppler early diastolic velocity (e’) of the medial mitral annulus approximately 6 cm/s yielding an elevated E/e’ ratio of 16.6.
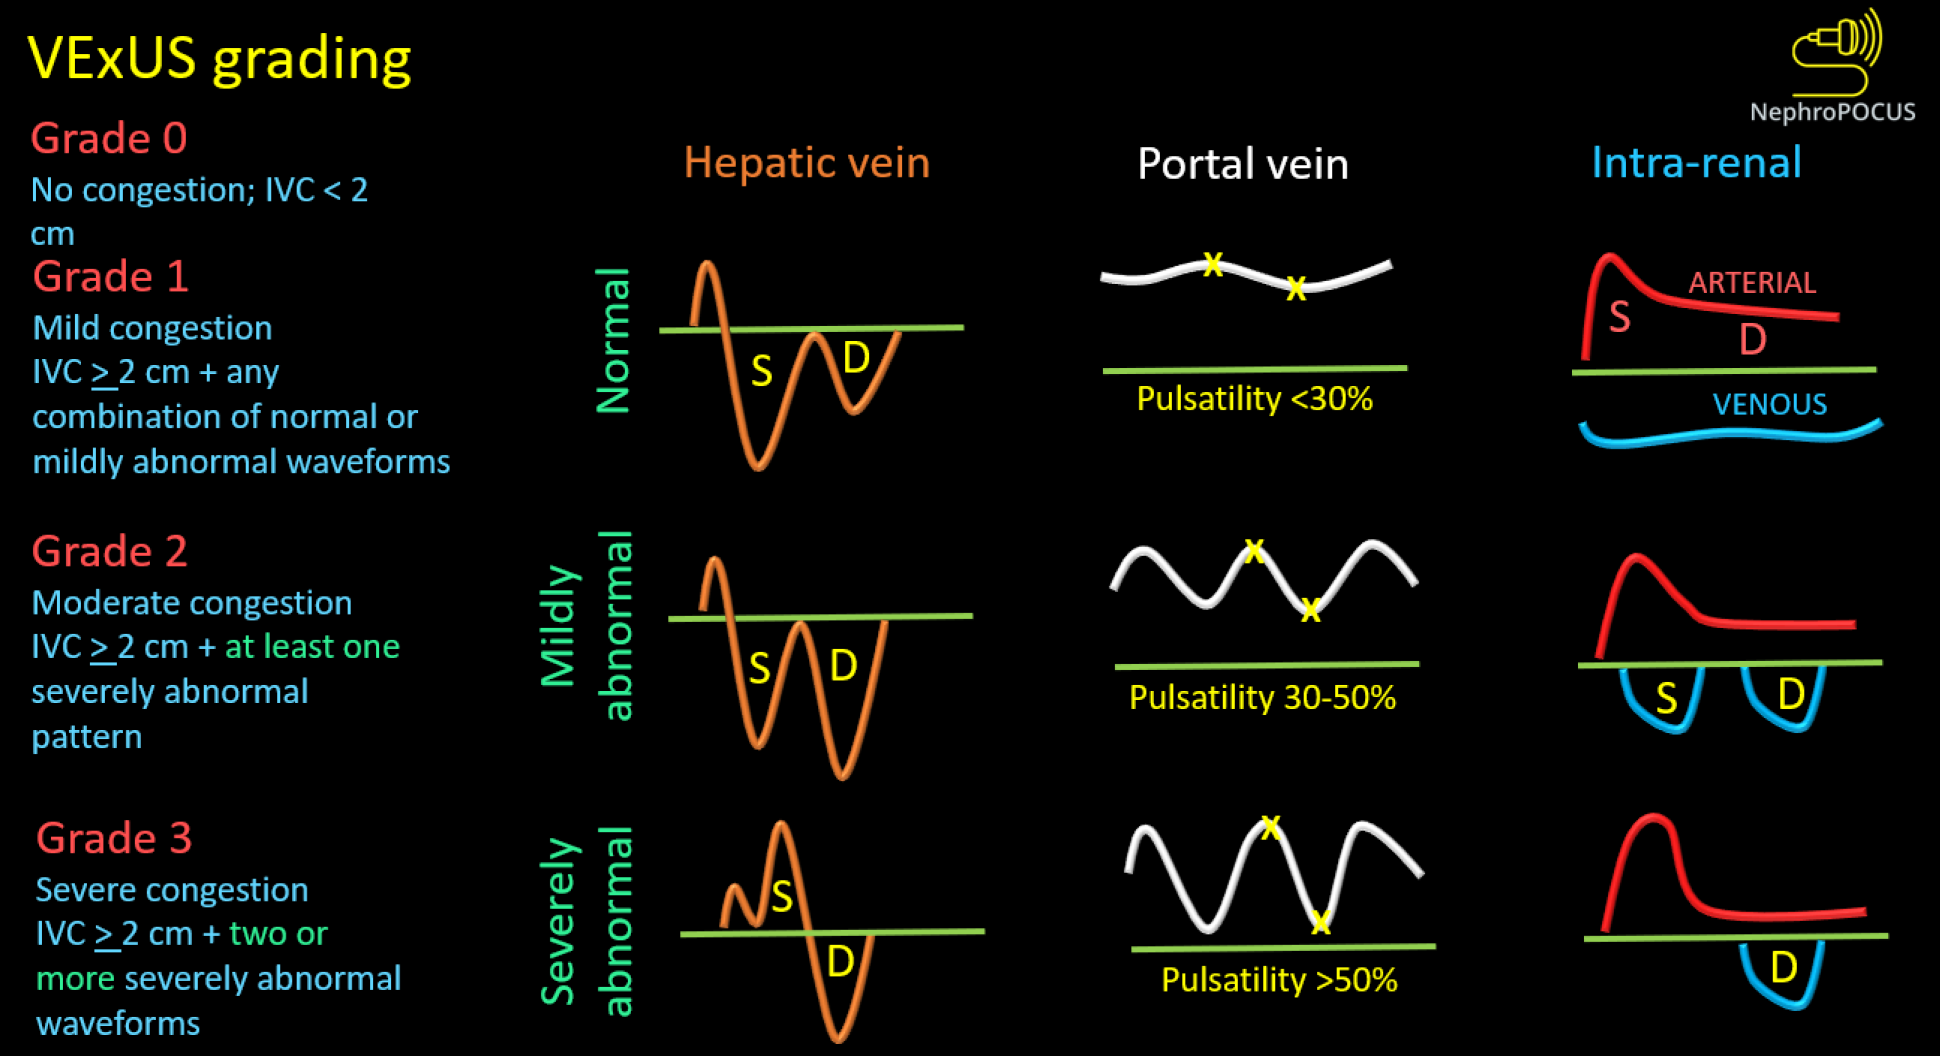
Figure 8 Venous excess ultrasound grading system.
When the diameter of inferior vena cava is ≥ 2 cm, three grades of congestion are defined based on the severity of abnormalities on hepatic, portal, and intrarenal venous Doppler. Hepatic vein Doppler is considered mildly abnormal when the systolic (S) wave is smaller than the diastolic (D) wave, but still below the baseline; it is considered severely abnormal when the S-wave is reversed. Portal vein Doppler is considered mildly abnormal when the pulsatility is 30% to 50%, and severely abnormal when it is ≥ 50%. Asterisks represent points of pulsatility measurement. Renal parenchymal vein Doppler is mildly abnormal when it is pulsatile with distinct S and D components, and severely abnormal when it is monophasic with D-only pattern. Reused from NephroPOCUS.com with permission (https://nephropocus.com/about/).
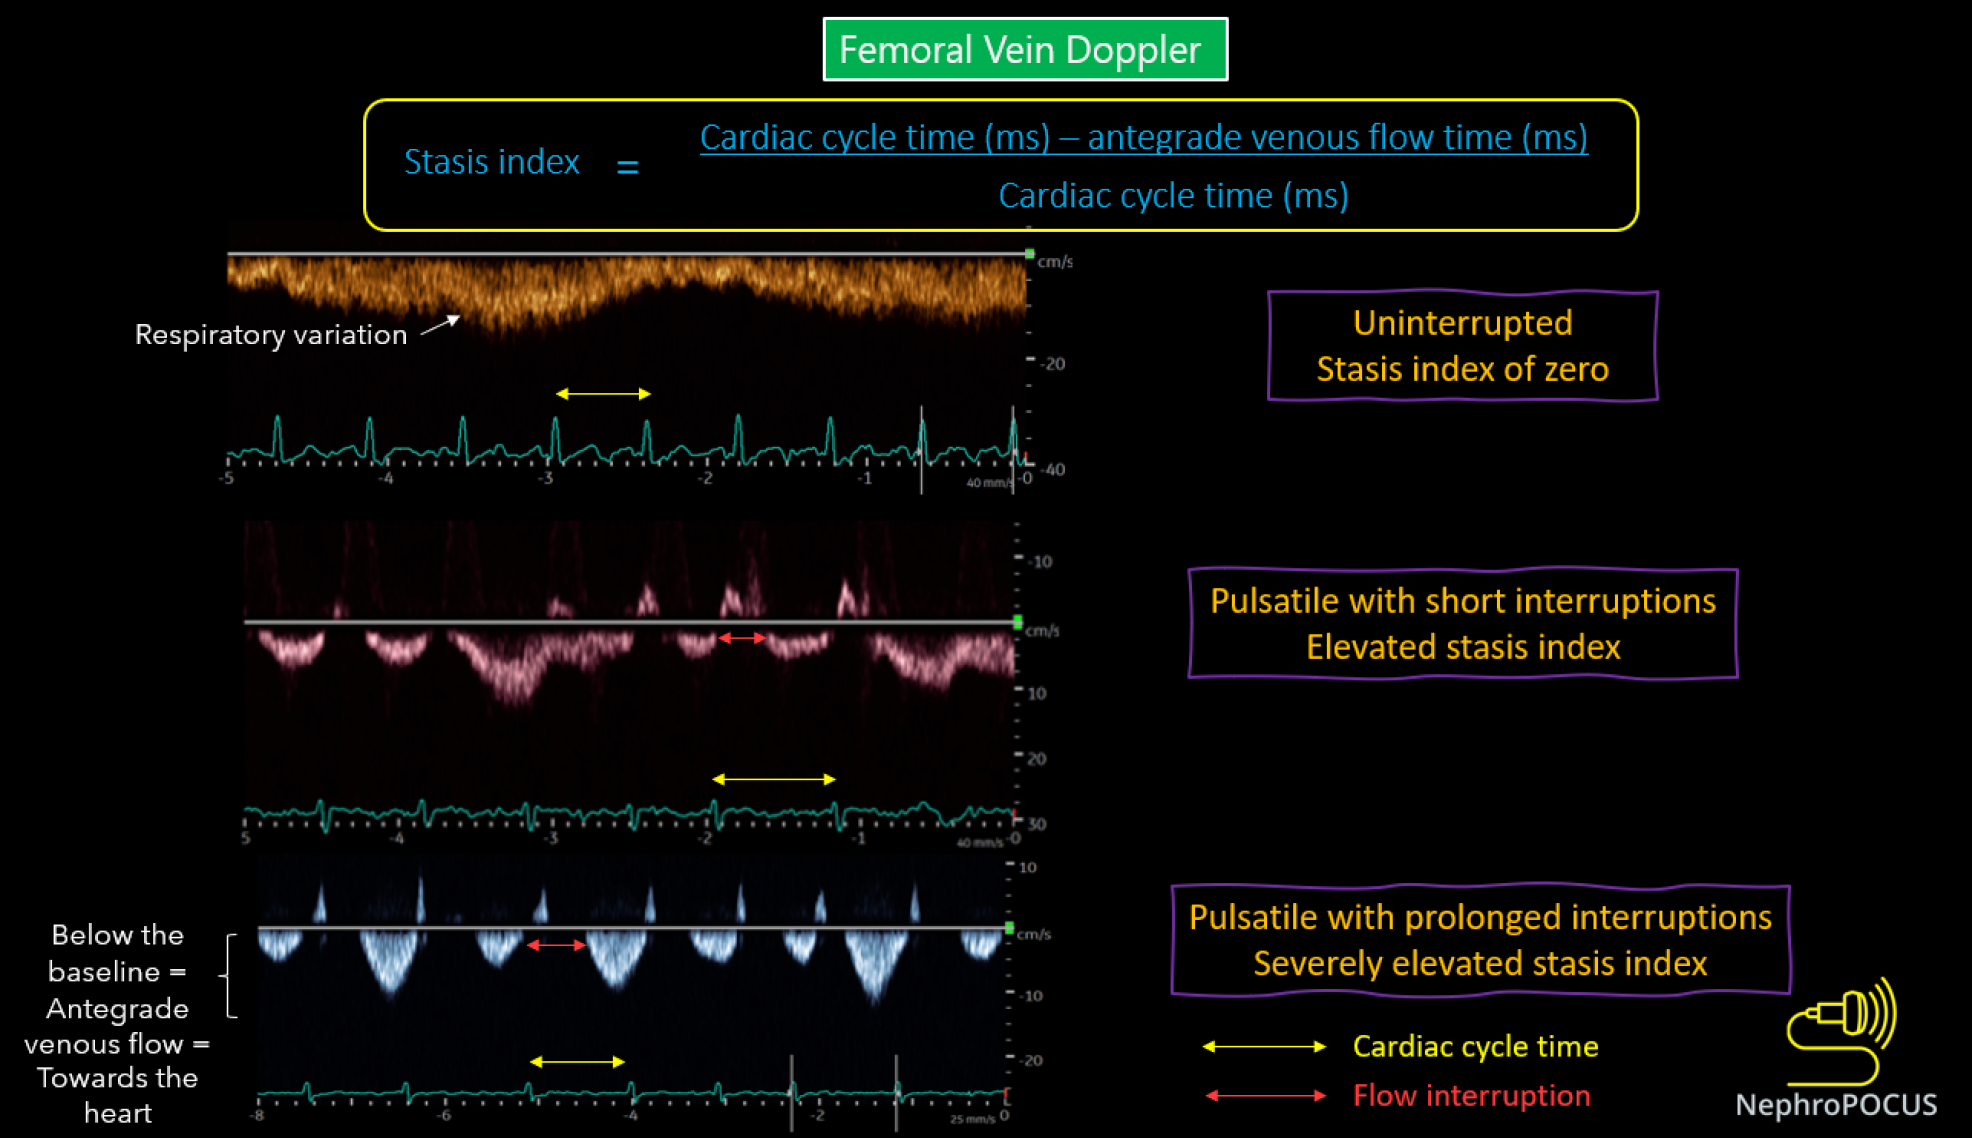
Figure 9 Changes in femoral vein Doppler correlate with escalating congestion.
In normal state, the waveform appears continuous or minimally pulsatile, with dips aligning with atrial contraction at the end of each diastole. With worsening congestion, the duration of flow interruptions rises within each cardiac cycle (indicated by an increased stasis index). Employing simultaneous electrocardiogram tracing aids in accurately identifying the duration of the cardiac cycle. Reused from NephroPOCUS.com with permission (https://nephropocus.com/about/).
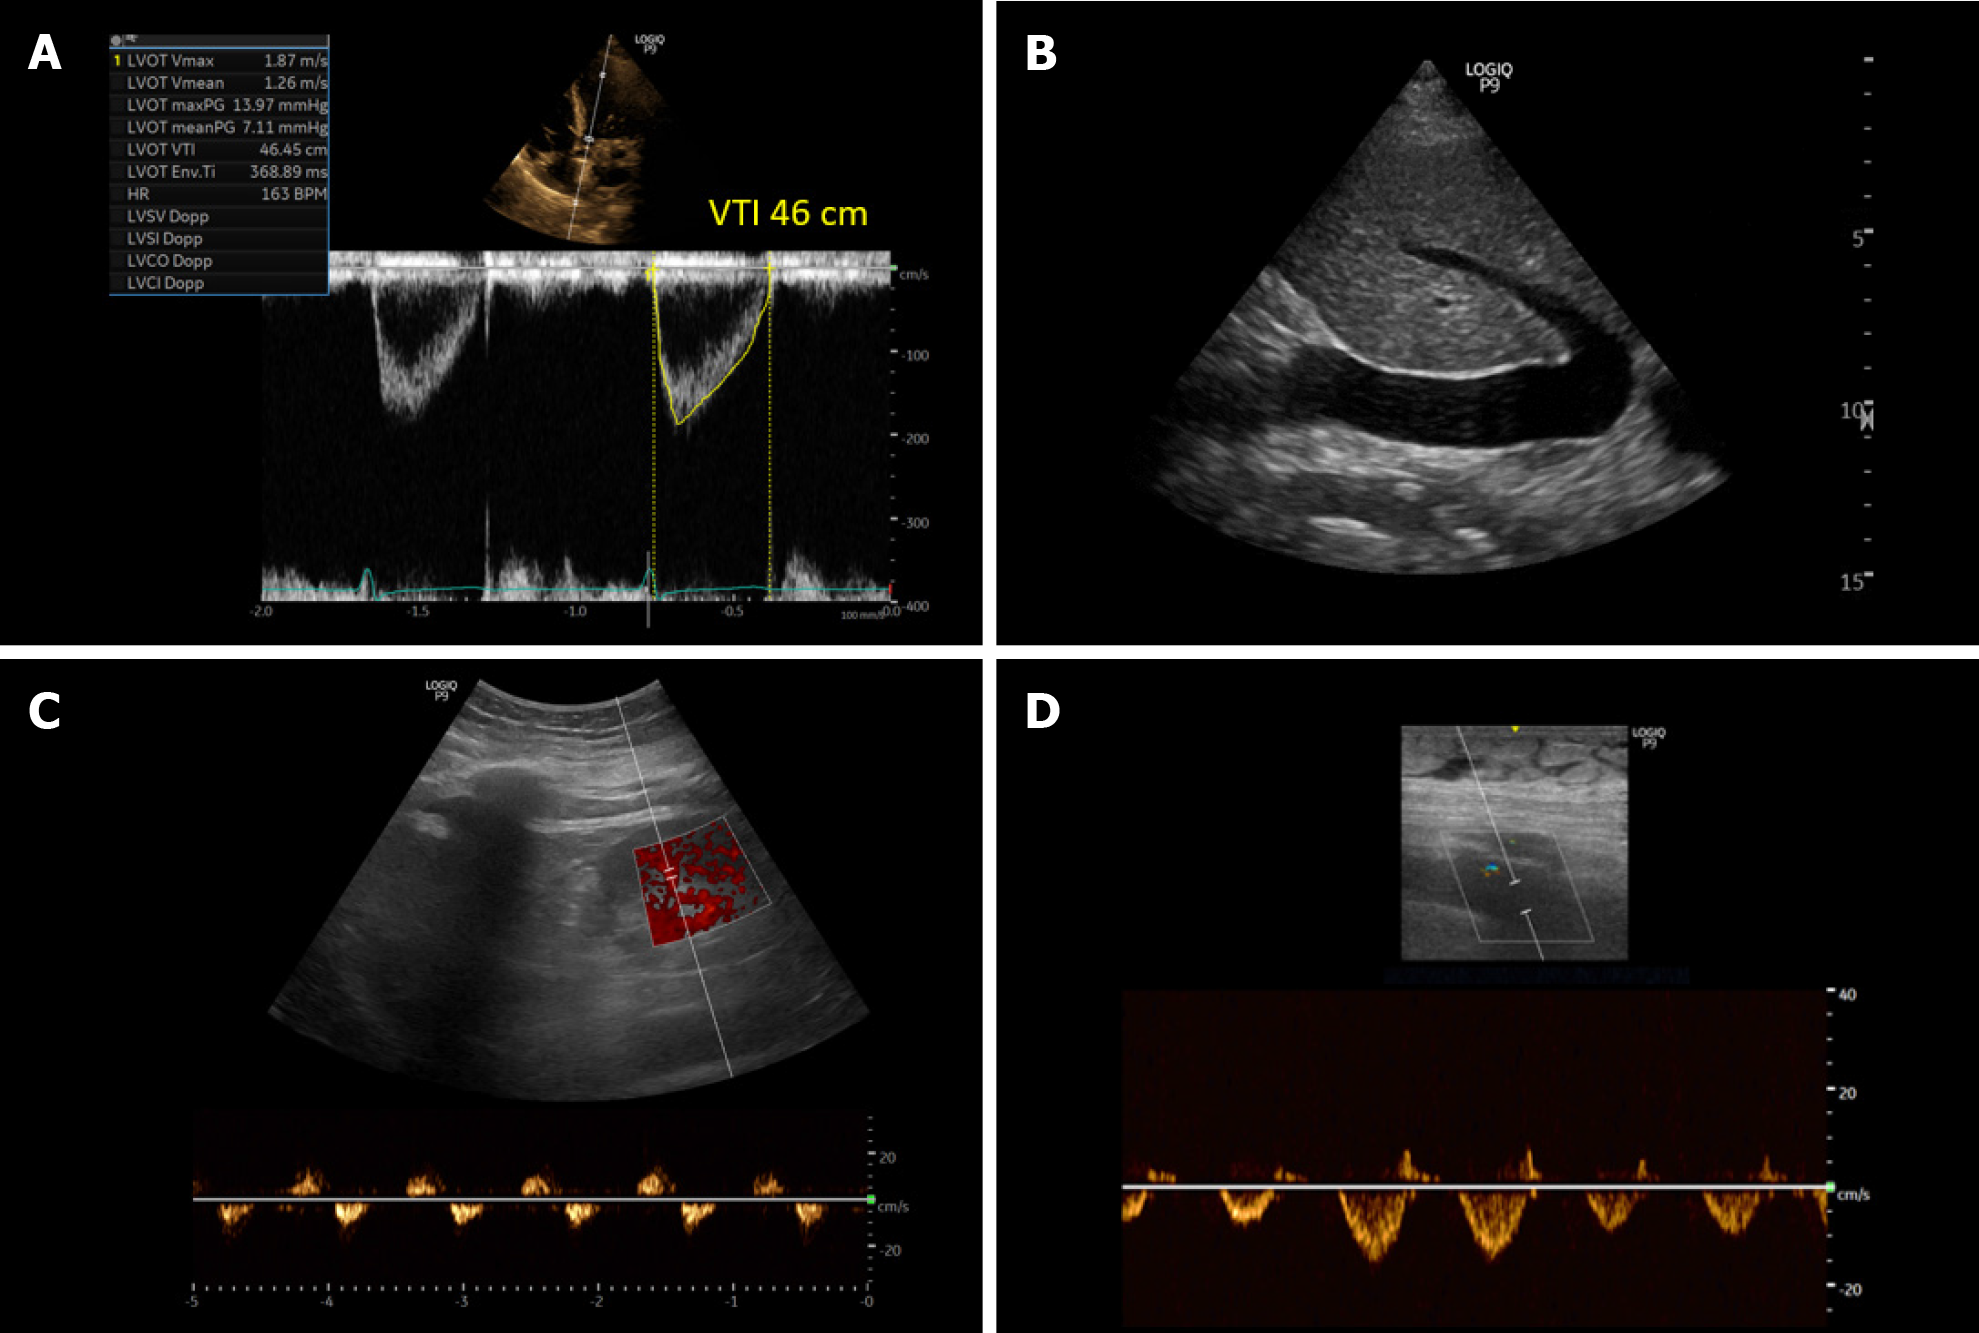
Figure 10 Ultrasound images obtained from a patient with cirrhosis and fluid overload demonstrating.
A: An elevated left ventricular outflow tract velocity time integral signifying very high stroke volume (high cardiac output); B: A plethoric inferior vena cava suggestive of elevated right atrial pressure; C and D: Significantly pulsatile renal parenchymal vein and femoral vein Doppler with flow interruptions.
- Citation: Koratala A. Point-of-care ultrasonography in cirrhosis-related acute kidney injury: How I do it. World J Crit Care Med 2024; 13(2): 93812
- URL: https://www.wjgnet.com/2220-3141/full/v13/i2/93812.htm
- DOI: https://dx.doi.org/10.5492/wjccm.v13.i2.93812


