Copyright
©The Author(s) 2024.
World J Crit Care Med. Jun 9, 2024; 13(2): 93206
Published online Jun 9, 2024. doi: 10.5492/wjccm.v13.i2.93206
Published online Jun 9, 2024. doi: 10.5492/wjccm.v13.i2.93206
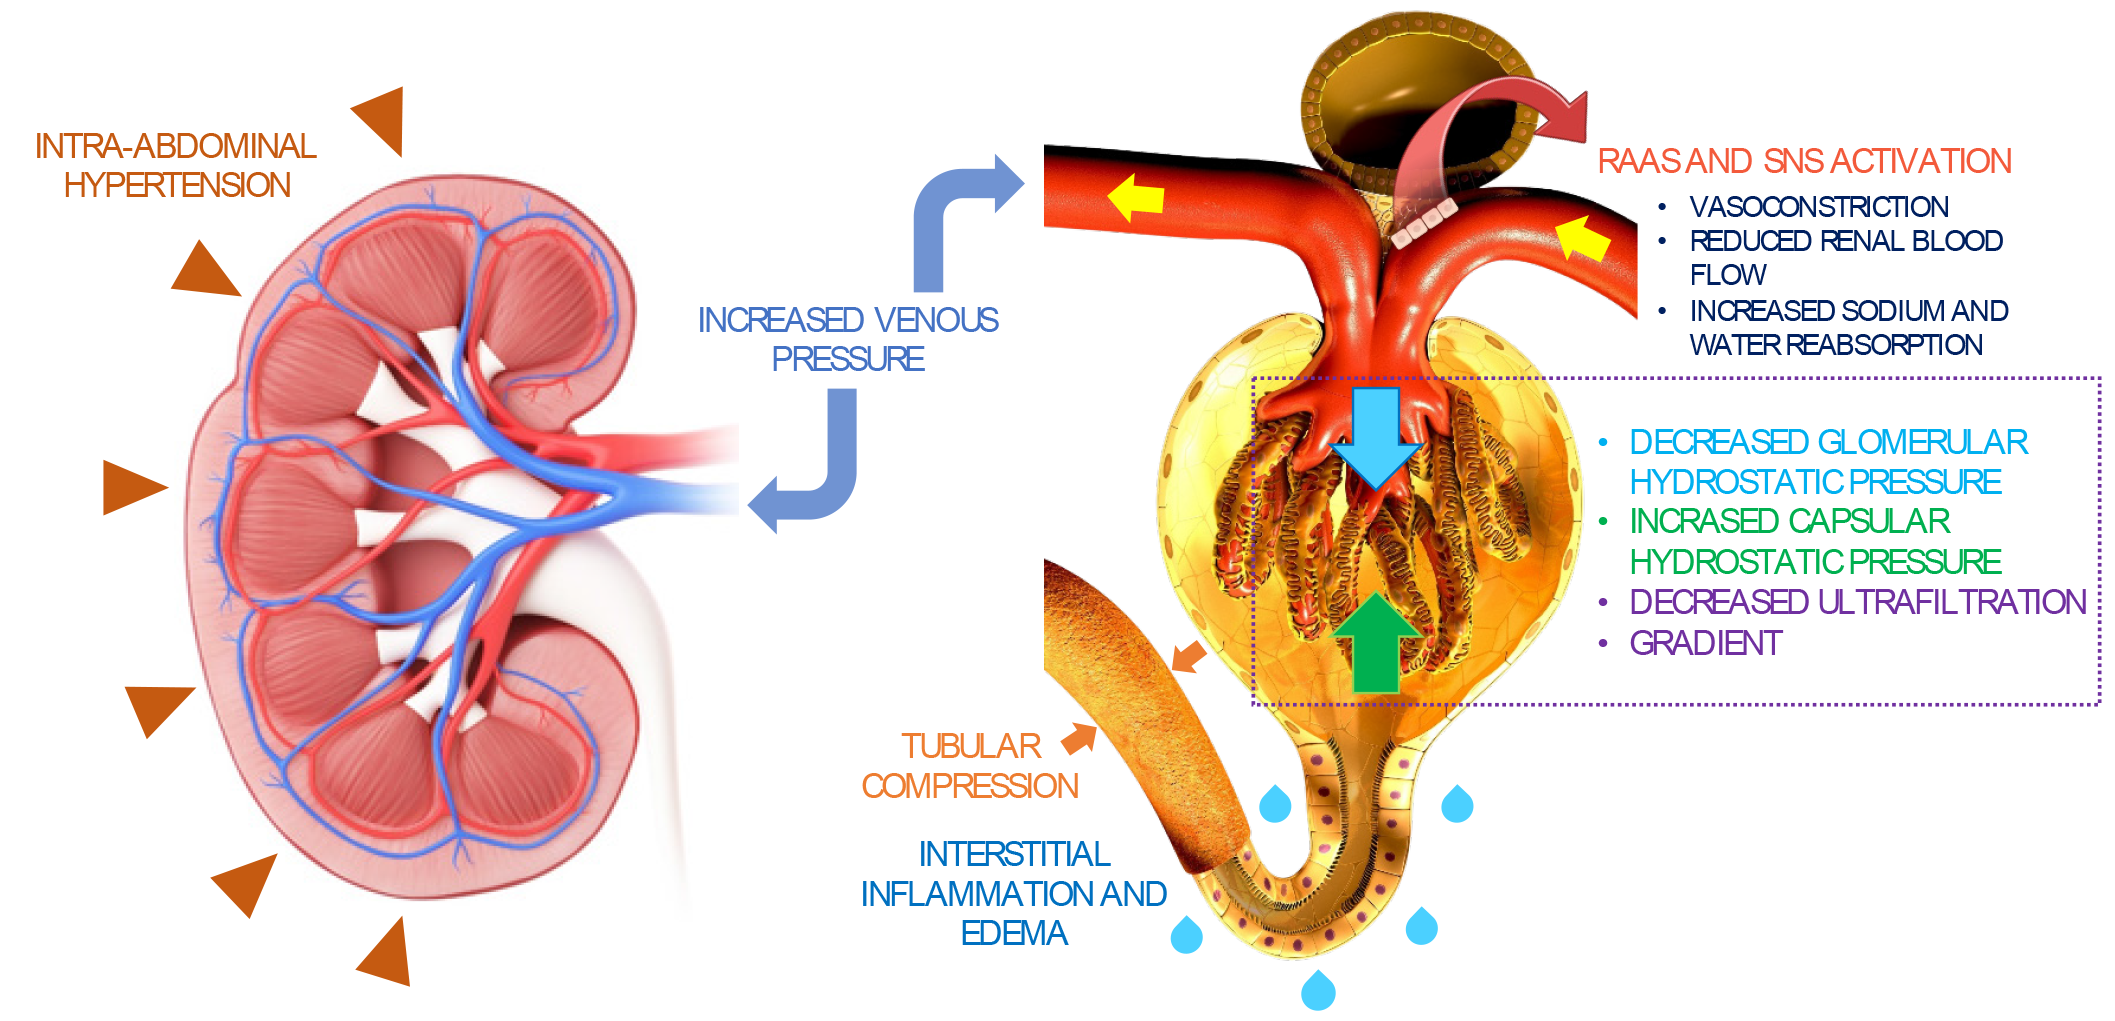
Figure 1 Summary of congestive nephropathy.
Congestion-induced acute renal dysfunction is mediated by retrograde transmission of central venous pressure to the kidneys, leading to development of interstitial edema, inflammation, and activation of the renin-angiotensin-aldosterone system and sympathetic nervous system. This further results in global cessation of glomerular filtration. Intra-abdominal hypertension adds to the problem by simulating a tamponade pathophysiology together with increased interstitial pressures. Citation: Argaiz ER, Romero-Gonzalez G, Rola P, Spiegel R, Haycock KH, Koratala A. Bedside Ultrasound in the Management of Cardiorenal Syndromes: An Updated Review. Cardiorenal Med 2023; 13: 372-384. Copyright ©Karger Publishers 2023. Published by Karger Publishers.
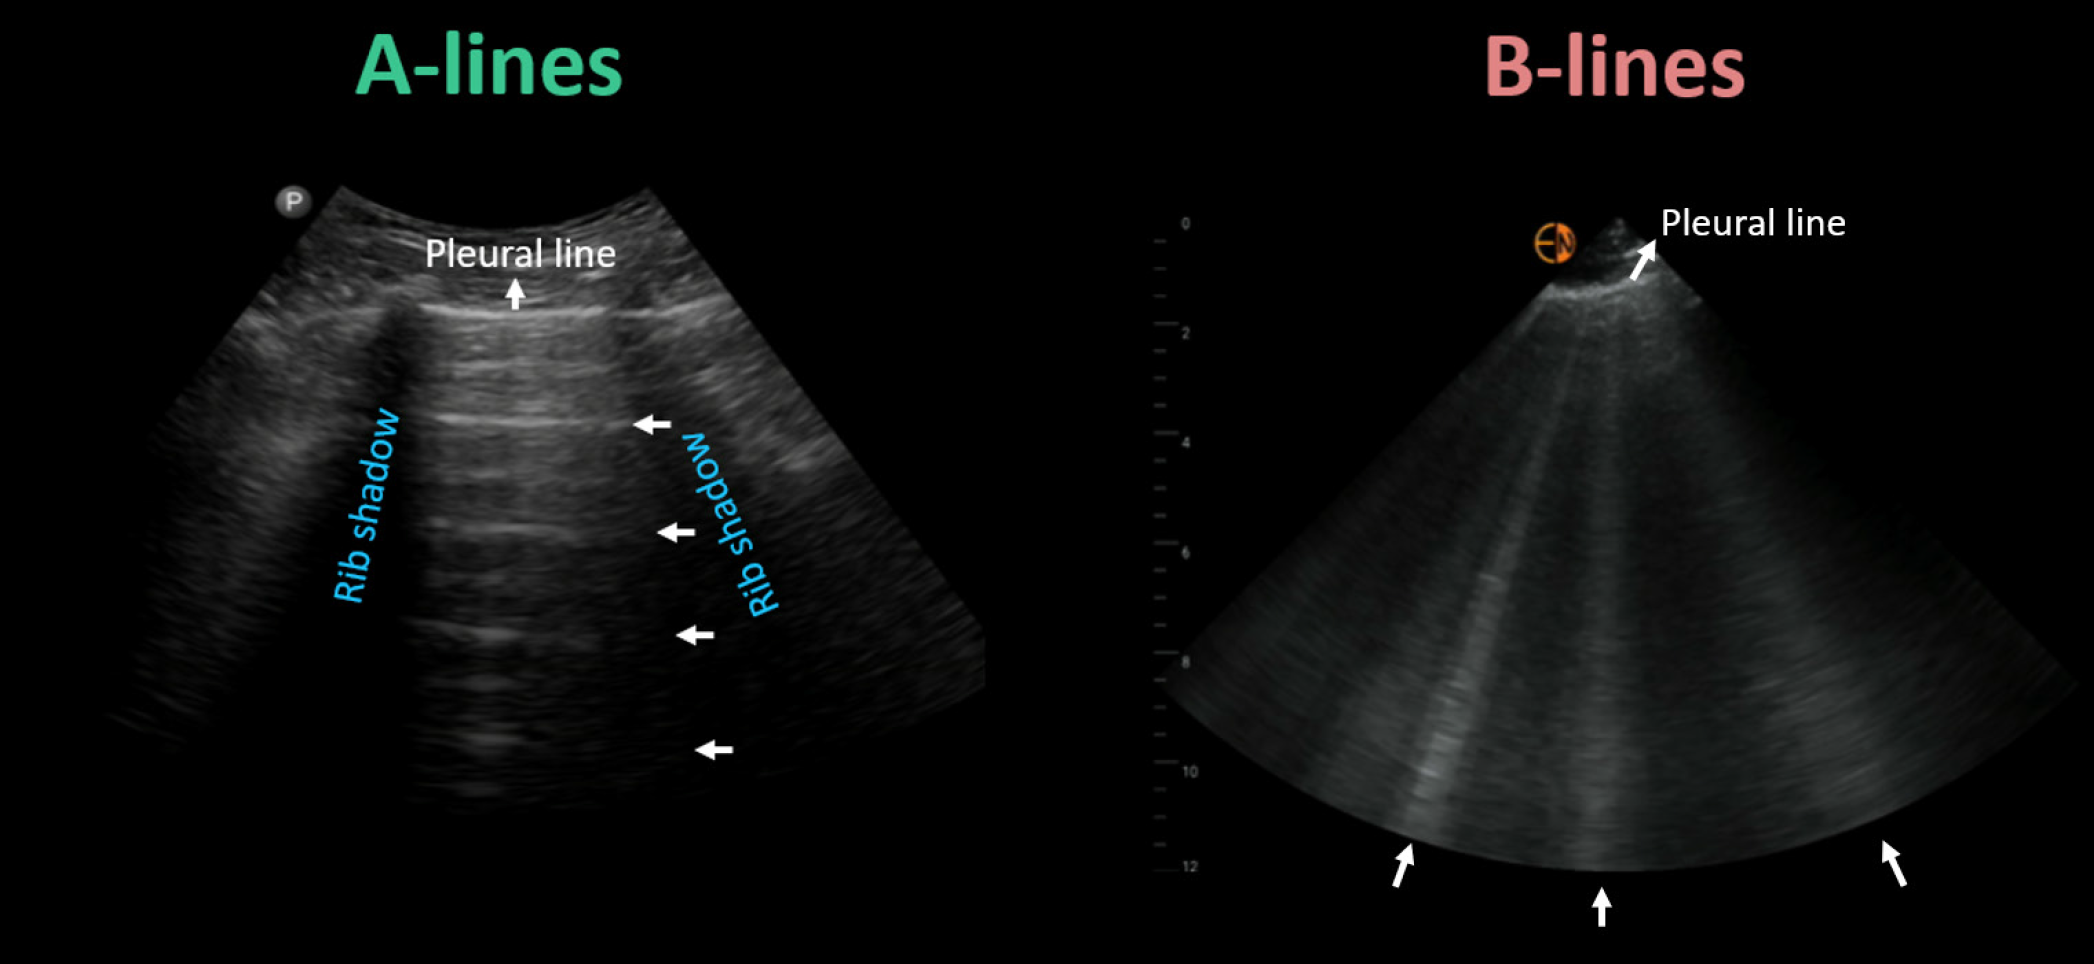
Figure 2 Key lung ultrasound findings: horizontal A-lines (normal) and vertical B-lines (abnormal).
Citation: Argaiz ER, Romero-Gonzalez G, Rola P, Spiegel R, Haycock KH, Koratala A. Bedside Ultrasound in the Management of Cardiorenal Syndromes: An Updated Review. Cardiorenal Med 2023; 13: 372-384. Copyright ©Karger Publishers 2023. Published by Karger Publishers.
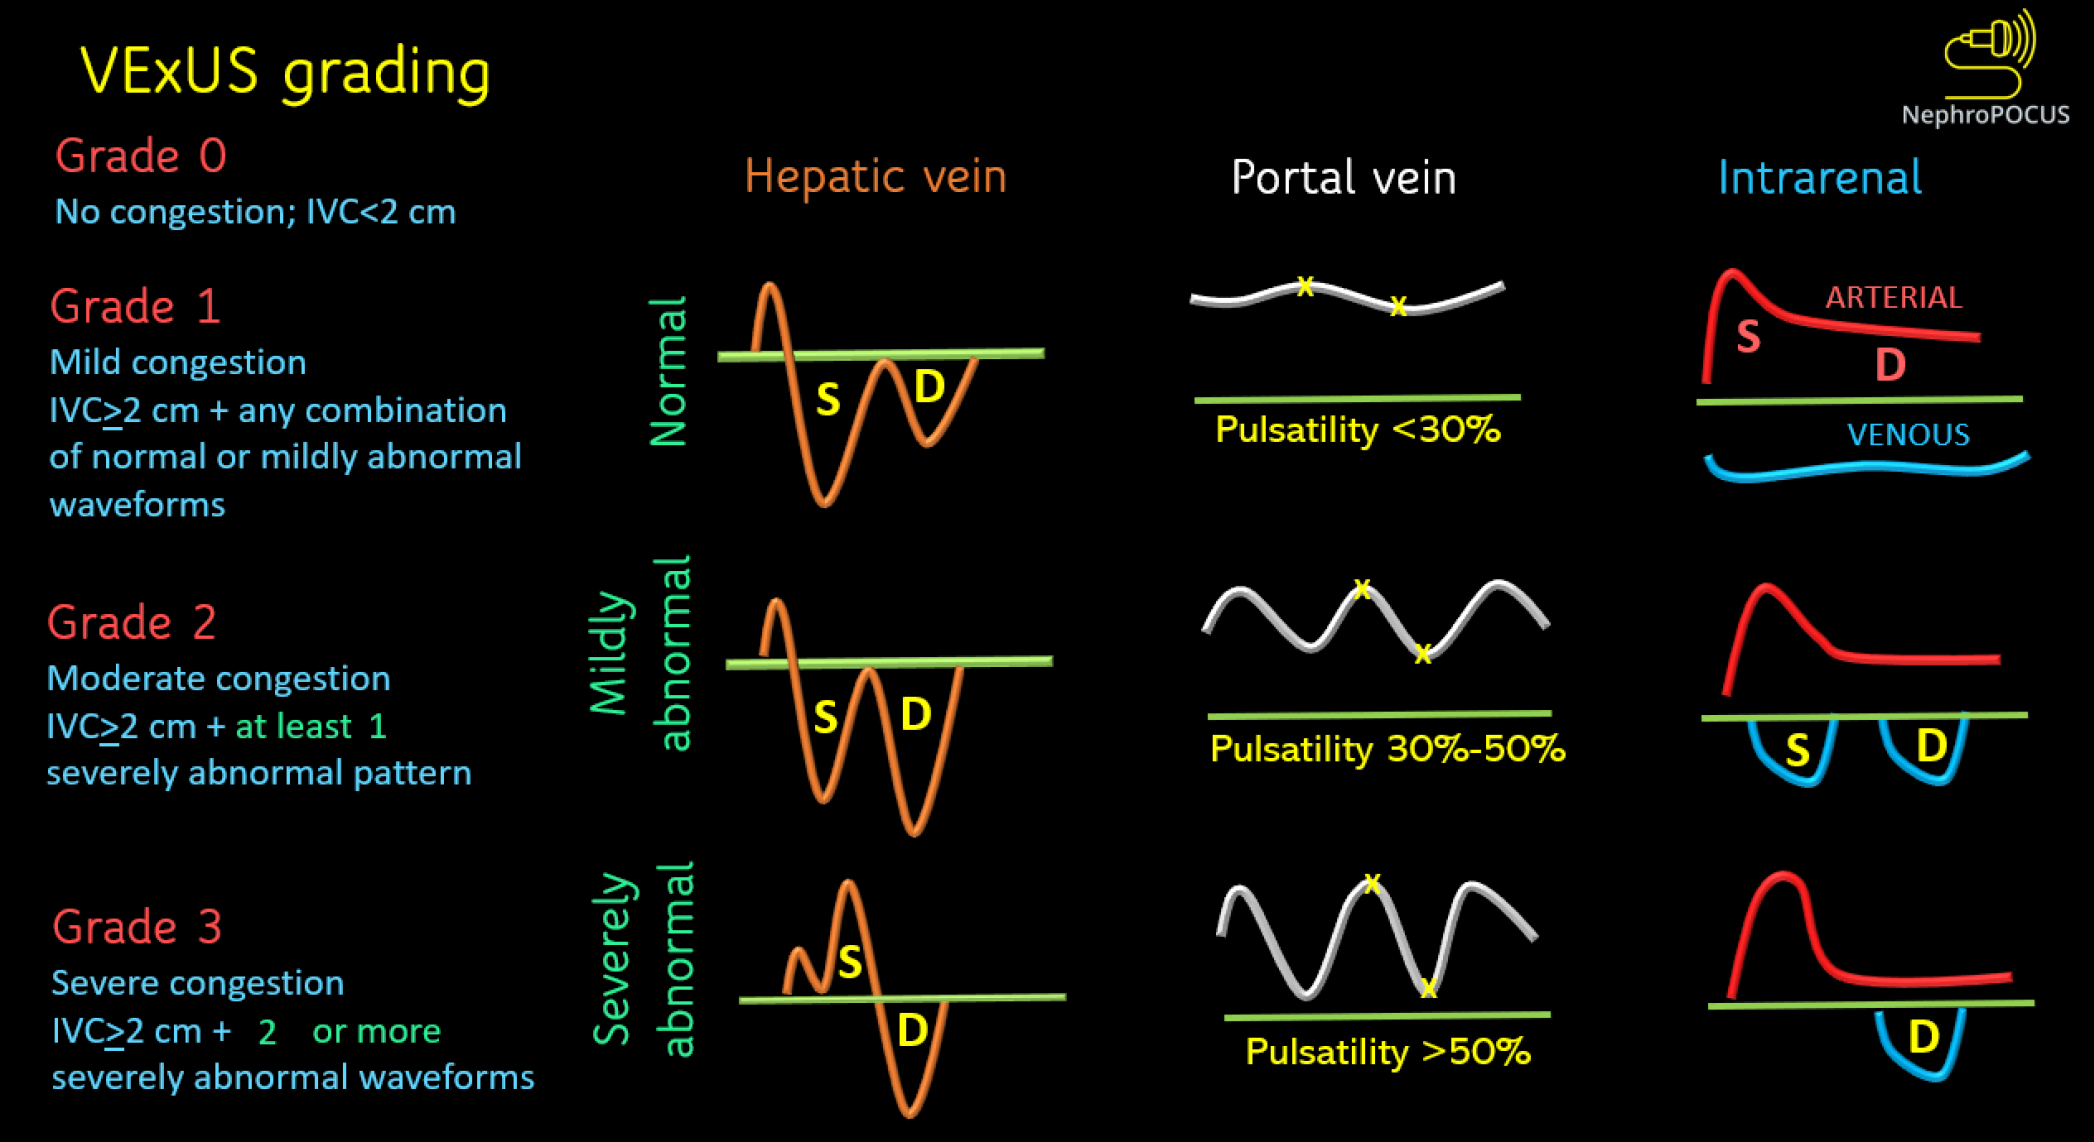
Figure 3 Venous excess ultrasound grading system.
When the diameter of inferior vena cava is more than or equal to 2 cm, three grades of congestion are defined based on the severity of abnormalities on hepatic, portal, and renal parenchymal venous Doppler. Hepatic vein Doppler is considered mildly abnormal when the systolic (S) wave is smaller than the diastolic (D) wave, but still below the baseline; it is considered severely abnormal when the S-wave is reversed. Portal vein Doppler is considered mildly abnormal when the pulsatility is 30% to 50%, and severely abnormal when it is ≥ 50%. Asterisks represent points of pulsatility measurement. Renal parenchymal vein Doppler is mildly abnormal when it is pulsatile with distinct S and D components, and severely abnormal when it is monophasic with D-only pattern. VExUS: Venous excess ultrasound. Reused from NephroPOCUS.com with permission (https://nephropocus.com/about/).
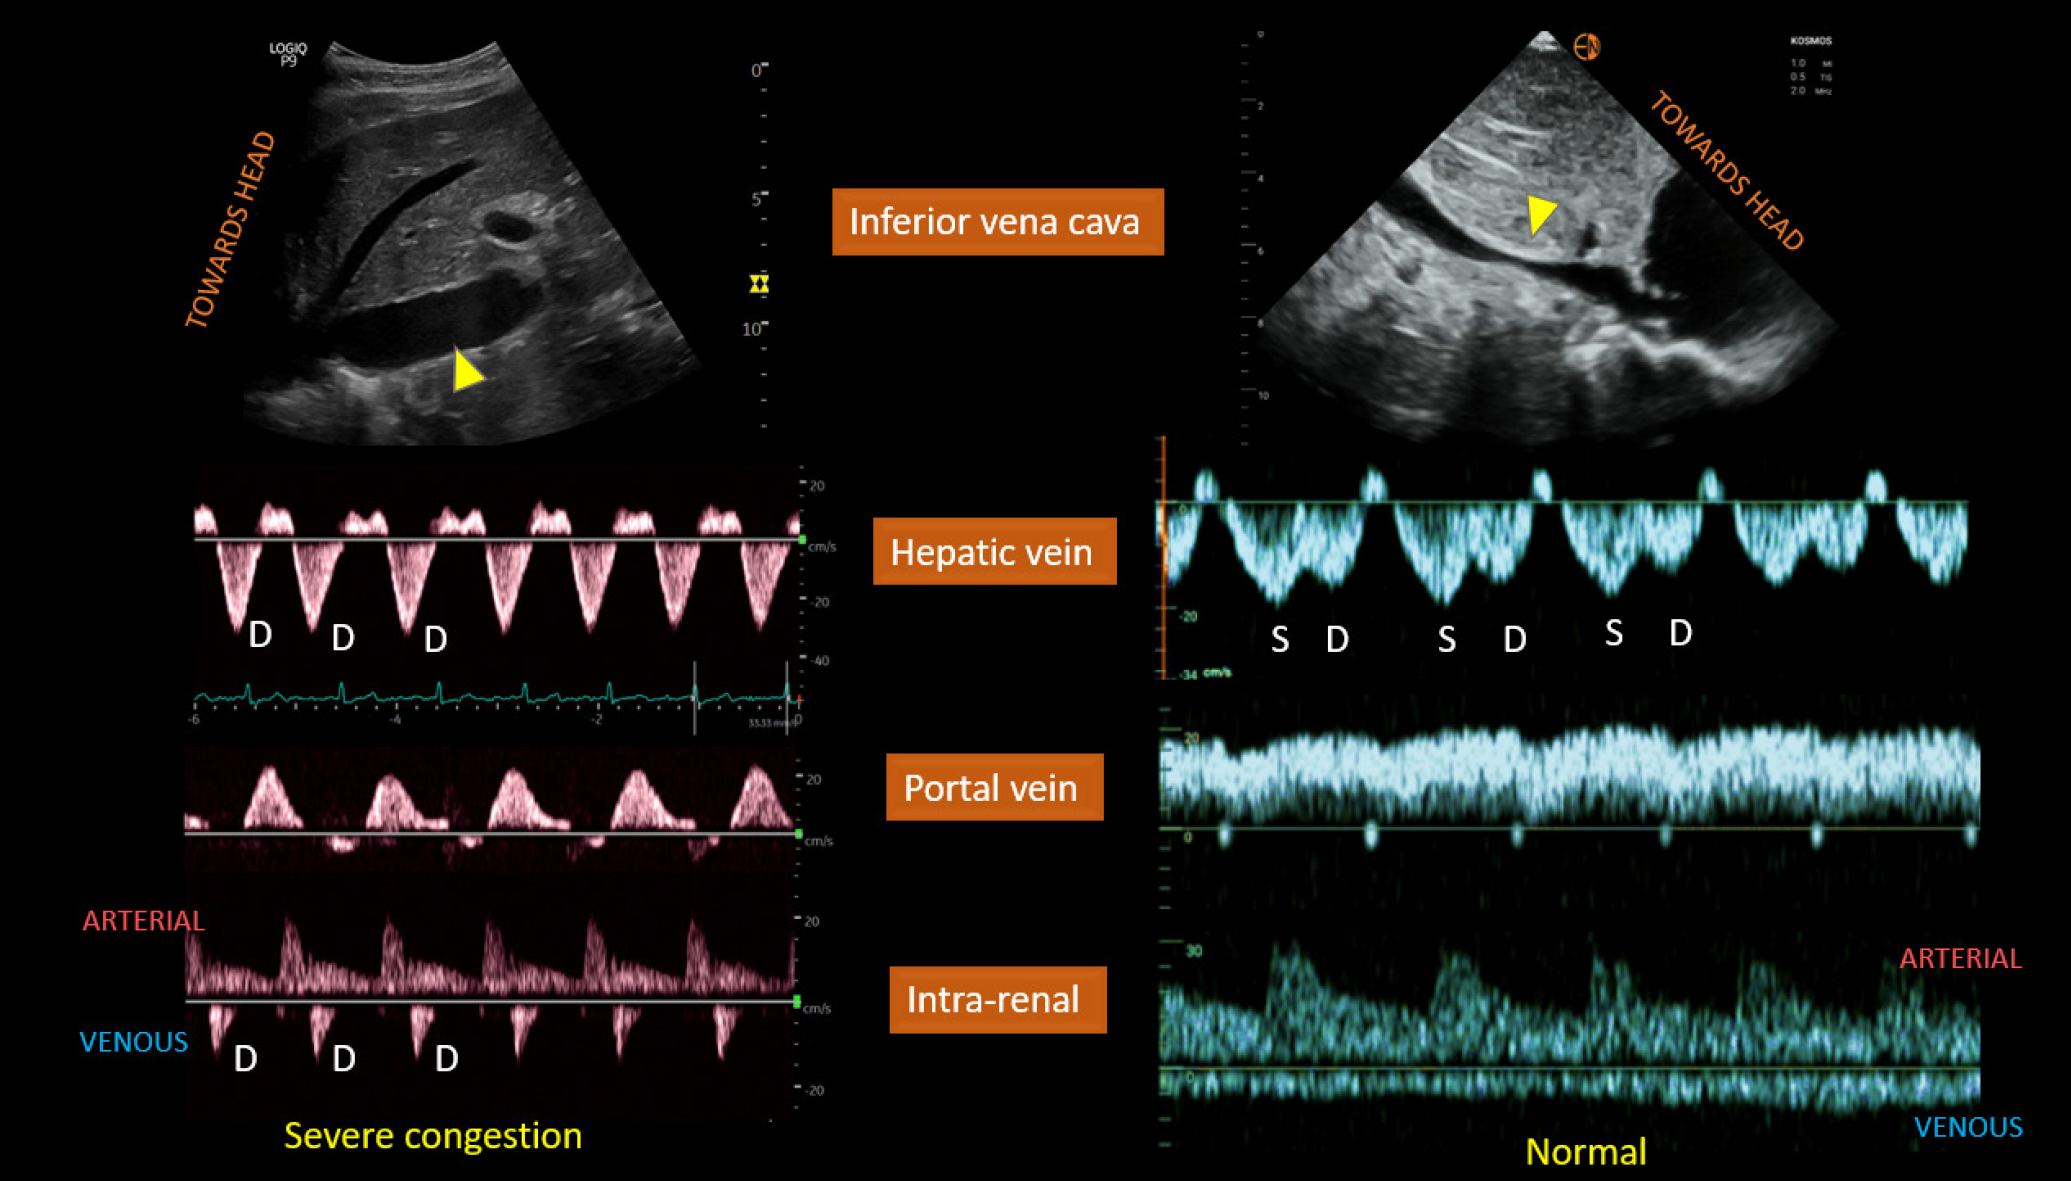
Figure 4 Left panel.
Plethoric inferior vena cava (IVC) (arrowhead), only diastolic (D) wave below-the-baseline on hepatic vein Doppler, pulsatile portal vein Doppler, and D-only or monophasic renal parenchymal vein Doppler obtained from a patient with fluid overload and severe venous congestion; right panel: normal-appearing IVC with < 2 cm diameter (arrowhead) and normal venous waveforms. Citation: Koratala A, Ronco C, Kazory A. Diagnosis of Fluid Overload: From Conventional to Contemporary Concepts. Cardiorenal Med. 2022; 12: 141-154. Copyright ©Silverchair Publisher 2022. Published by Karger Publishers.
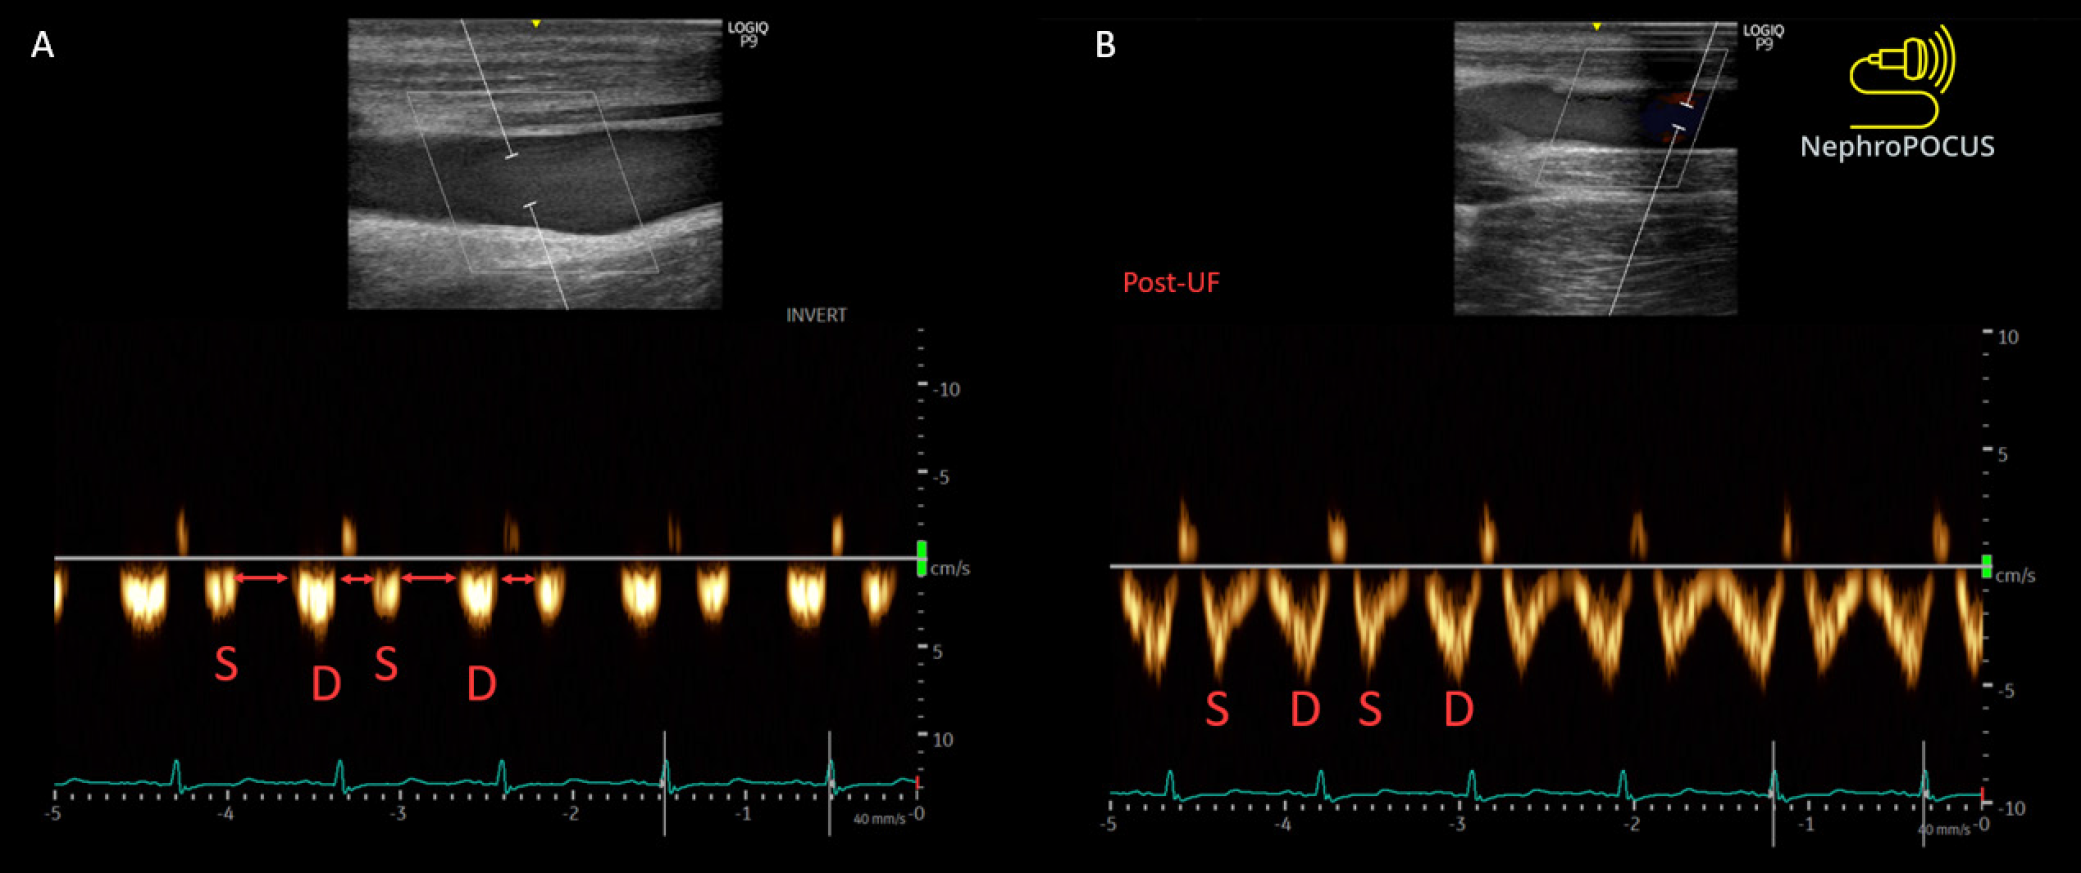
Figure 5 Improvement in the femoral vein stasis index (i.
e., reduced venous flow interruptions (red arrows) after fluid removal in a dialysis patient. S = systolic wave, D = diastolic wave. Reused from NephroPOCUS.com with permission (https://nephropocus.com/about/).
- Citation: Khan AA, Saeed H, Haque IU, Iqbal A, Du D, Koratala A. Point-of-care ultrasonography spotlight: Could venous excess ultrasound serve as a shared language for internists and intensivists? World J Crit Care Med 2024; 13(2): 93206
- URL: https://www.wjgnet.com/2220-3141/full/v13/i2/93206.htm
- DOI: https://dx.doi.org/10.5492/wjccm.v13.i2.93206


