Copyright
©2012 Baishideng.
World J Crit Care Med. Aug 4, 2012; 1(4): 106-122
Published online Aug 4, 2012. doi: 10.5492/wjccm.v1.i4.106
Published online Aug 4, 2012. doi: 10.5492/wjccm.v1.i4.106
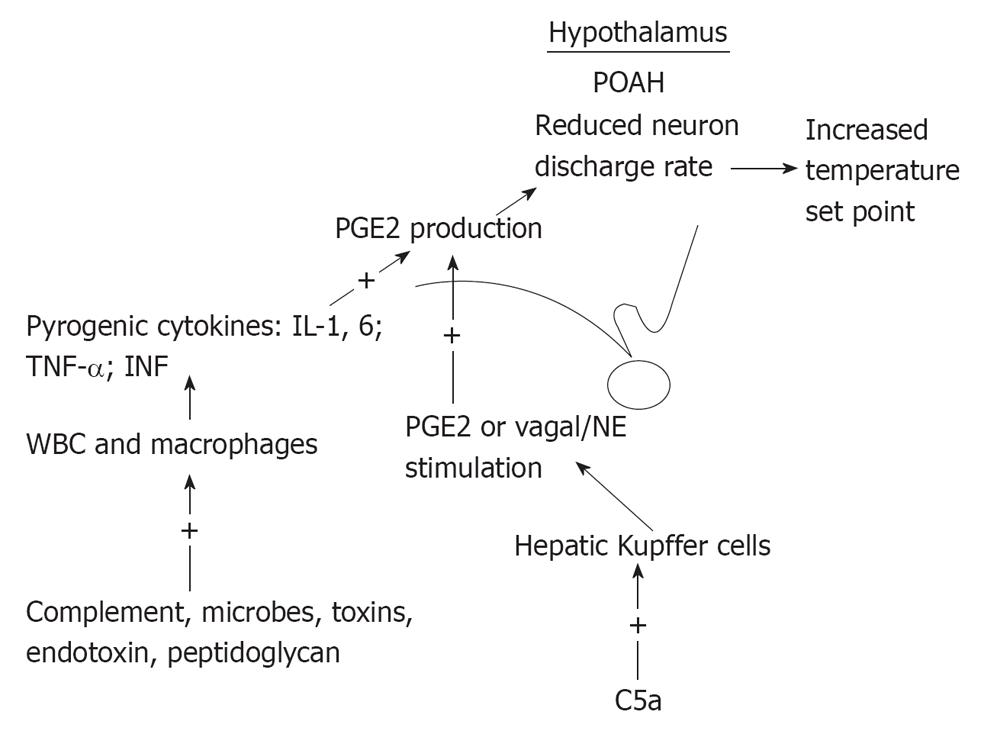
Figure 1 Schematic of fever production.
POAH: Pre-optic area of the anterior hypothalamus; IL: Interleukin; TNF: Tumor necrosis factor; INF: Interferon; WBC: White blood cell; PGE2: Prostaglandin E2; NE: Norepinephrine.
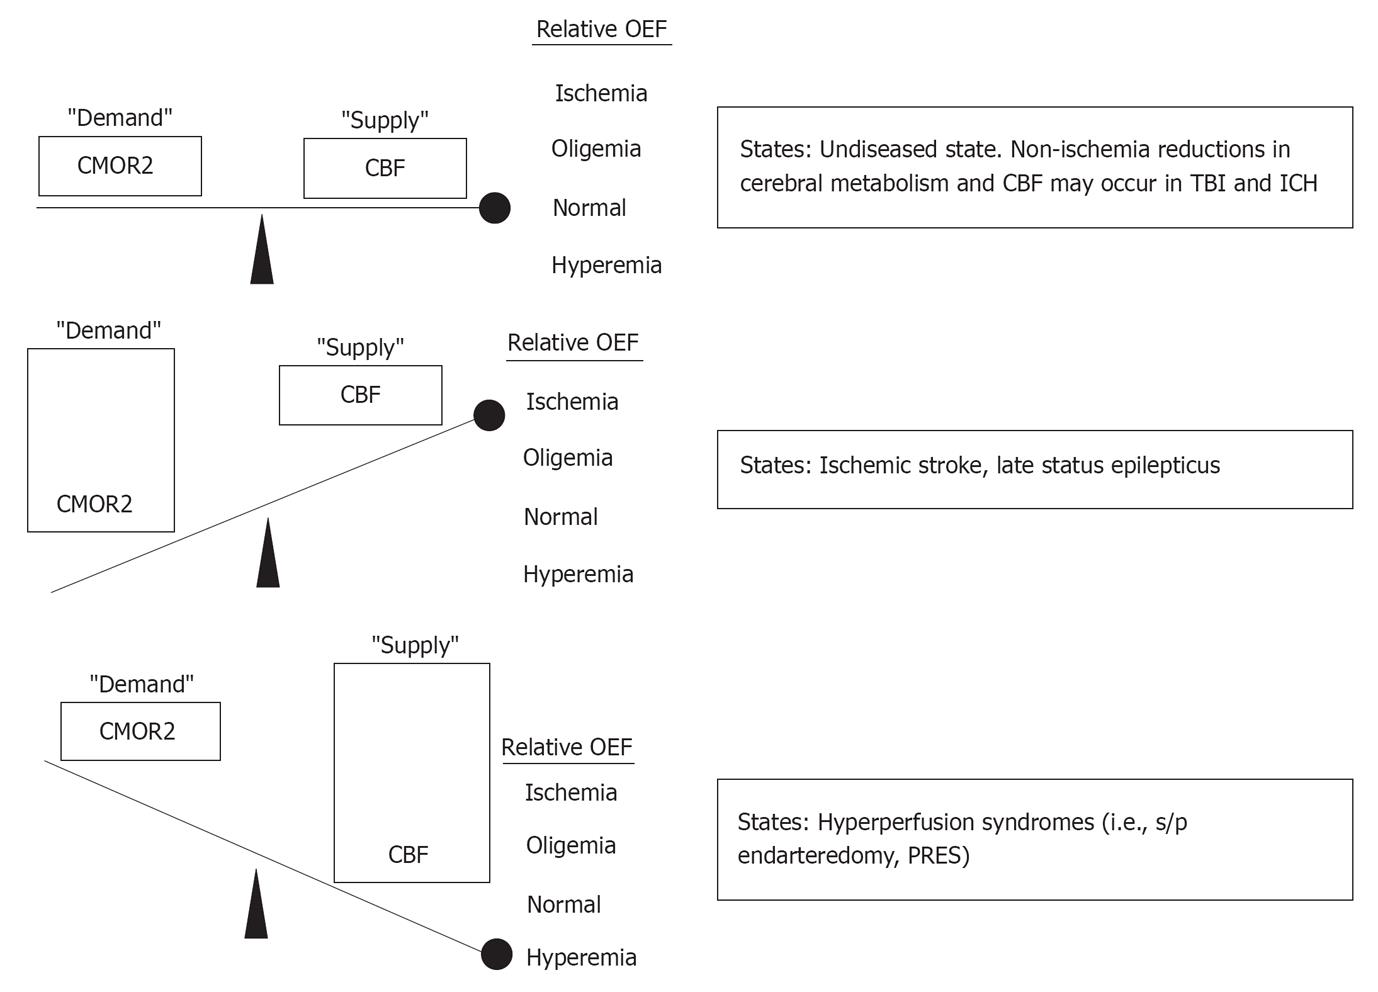
Figure 2 Metabolic pattern of common neurocritical care unit disease.
CBF: Cerebral blood flow; TBI: Traumatic brain injury; ICH: Intracerebral hemorrhage.
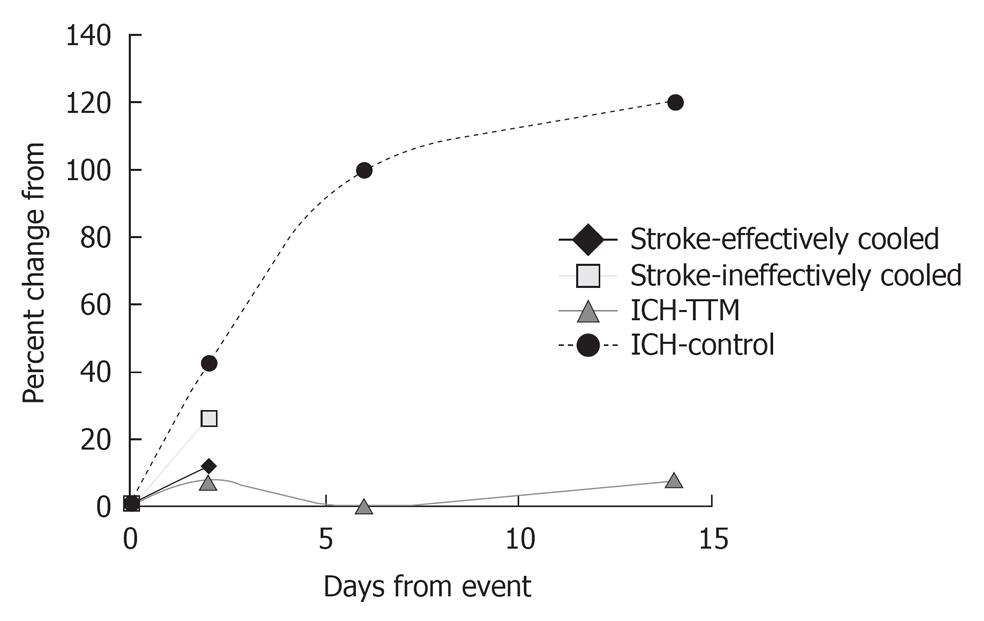
Figure 3 Approximate percent increases in cerebral edema, over time, in stroke and intensive care unit patients treated with and without targeted temperature management.
Changes between stroke patients effectively and ineffectively cooled, and changes between intensive care unit patients receiving targeted temperature management (TTM) and controls not receiving TTM, are significant. Stroke patients day two measurements are between 36-48 h. ICH: Intracerebral hemorrhage.
- Citation: Corry JJ. Use of hypothermia in the intensive care unit. World J Crit Care Med 2012; 1(4): 106-122
- URL: https://www.wjgnet.com/2220-3141/full/v1/i4/106.htm
- DOI: https://dx.doi.org/10.5492/wjccm.v1.i4.106


