Copyright
©2014 Baishideng Publishing Group Inc.
World J Surg Proced. Jul 28, 2014; 4(2): 48-54
Published online Jul 28, 2014. doi: 10.5412/wjsp.v4.i2.48
Published online Jul 28, 2014. doi: 10.5412/wjsp.v4.i2.48
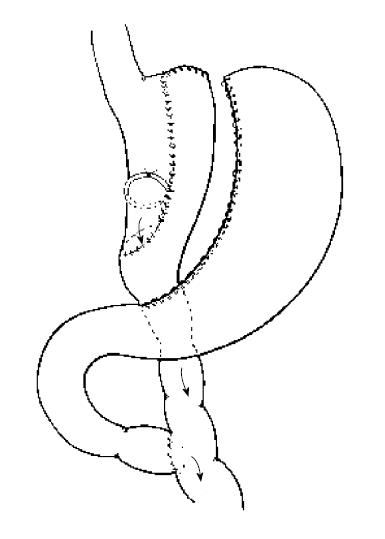
Figure 1 Schematic diagram of Fobi Pouch Gastric Bypass.
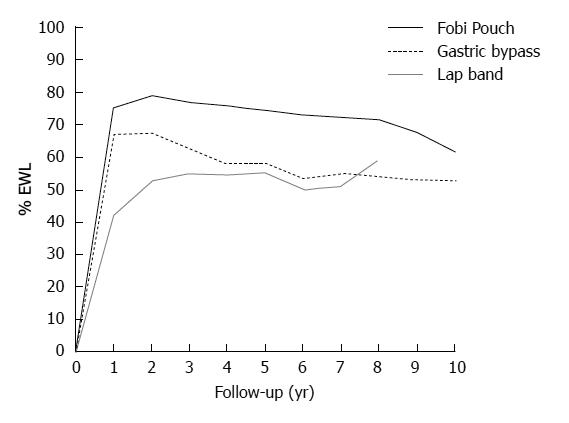
Figure 2 Medium - long-term weight loss data for banded gastric bypass (Fobi Pouch), standard gastric bypass and Laparoscopic adjustable banding.
Data from systematic review by O’Brien et al[10] 2006. (%EWL on the x axis refers to the percentage of pre-operative weight in excess of ideal body weight, which has been lost at any one point in time, shown on the y axis.
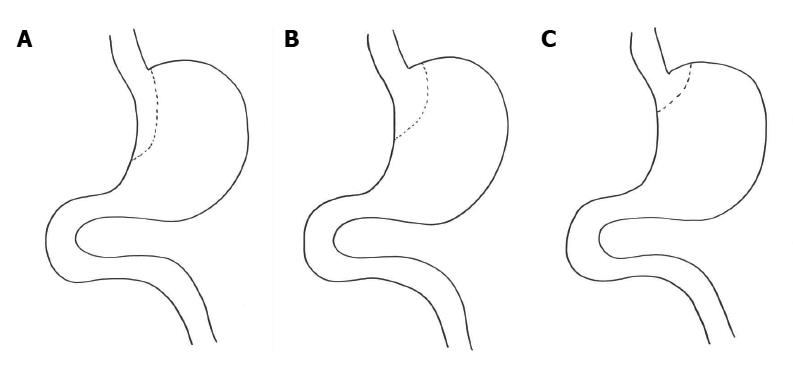
Figure 3 Schematic representations of possible configurations of gastric pouch.
A: Shows a long narrow pouch based on the lesser curve; B: Shows a rather wider and shorter pouch based on the lesser curve; C: Shows a very small pouch formed by stapling just beyond the oesophago-gastric junction.
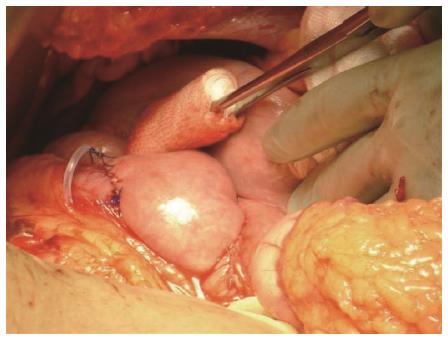
Figure 4 Operative photo showing the loose placement of a 6.
5 cm silastic ring proximal to the gastro-jejunal anastomosis.
- Citation: Stubbs RS, Sarvepalli R. What makes a gastric bypass a good gastric bypass? Opinion and hypothesis. World J Surg Proced 2014; 4(2): 48-54
- URL: https://www.wjgnet.com/2219-2832/full/v4/i2/48.htm
- DOI: https://dx.doi.org/10.5412/wjsp.v4.i2.48


