Copyright
©2013 Baishideng Publishing Group Co.
World J Surg Proced. Nov 28, 2013; 3(3): 47-53
Published online Nov 28, 2013. doi: 10.5412/wjsp.v3.i3.47
Published online Nov 28, 2013. doi: 10.5412/wjsp.v3.i3.47
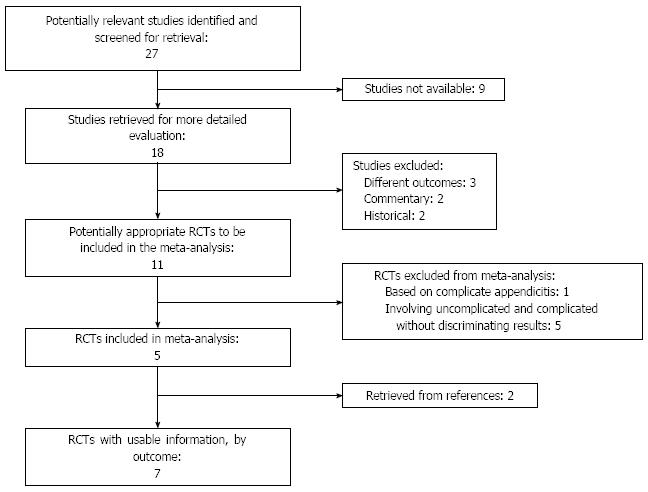
Figure 1 Flow-chart of the study selection process.
RCTs: Randomized controlled trials.
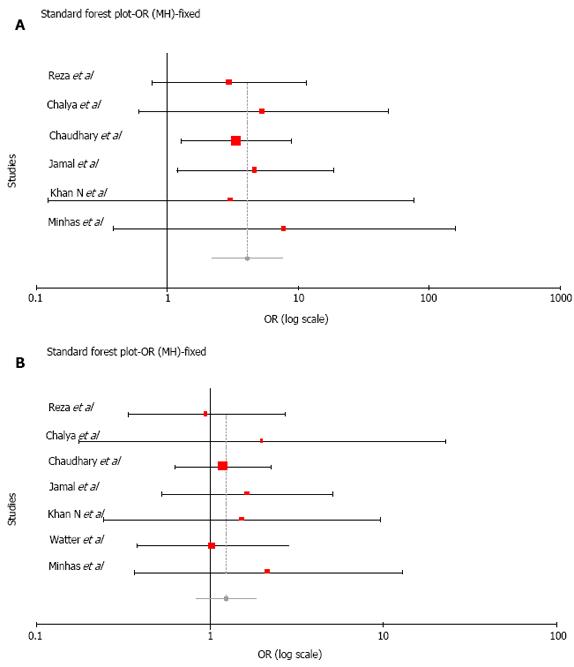
Figure 2 Forest plot graph showing results on the analysis of postoperative among simple ligation and stump invagination.
A: Ileus; B: Wound infections.
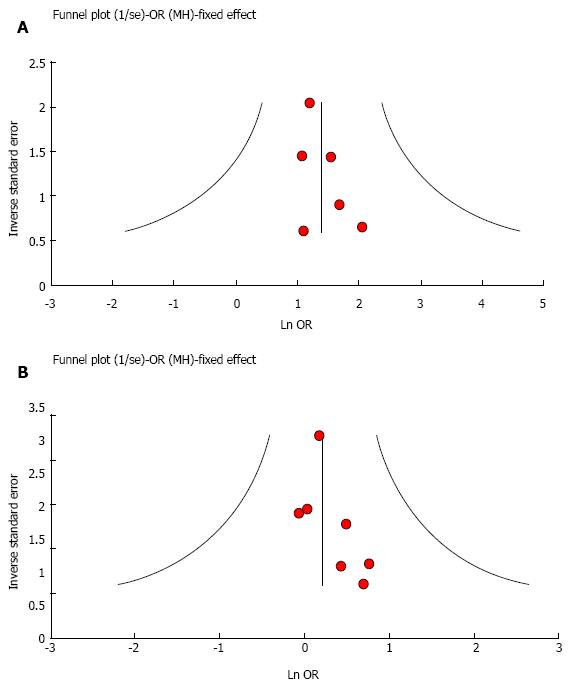
Figure 3 Funnel plot graph showing heterogeneity analysis on postoperative among simple ligation and stump invagination.
A: Ileus; B: Wound infections.
- Citation: Gravante G, Yahia S, Sorge R, Mathew G, Kelkar A. Back to basics: A meta-analysis of stump management during open appendicectomy for uncomplicated acute appendicitis. World J Surg Proced 2013; 3(3): 47-53
- URL: https://www.wjgnet.com/2219-2832/full/v3/i3/47.htm
- DOI: https://dx.doi.org/10.5412/wjsp.v3.i3.47


