Copyright
©The Author(s) 2016.
World J Immunol. Jul 27, 2016; 6(2): 105-118
Published online Jul 27, 2016. doi: 10.5411/wji.v6.i2.105
Published online Jul 27, 2016. doi: 10.5411/wji.v6.i2.105
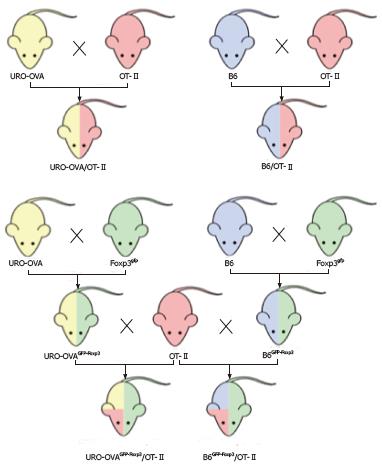
Figure 1 Animal crossbreeding.
URO-OVA/OT-II mice were generated through crossbreeding of URO-OVA mice with OT-II mice. B6/OT-II mice were generated through crossbreeding of B6 mice with OT-II mice. URO-OVAGFP-Foxp3 mice were generated through crossbreeding of URO-OVA mice with Foxp3gfp mice. B6GFP-Foxp3 mice were generated through crossbreeding of B6 mice with Foxp3gfp mice. Both URO-OVAGFP-Foxp3 and B6GFP-Foxp3 mice were further crossed with OT-II mice to generate URO-OVAGFP-Foxp3/OT-II and B6GFP-Foxp3/OT-II mice, respectively. URO: Urothelium; OVA: Ovalbumin.
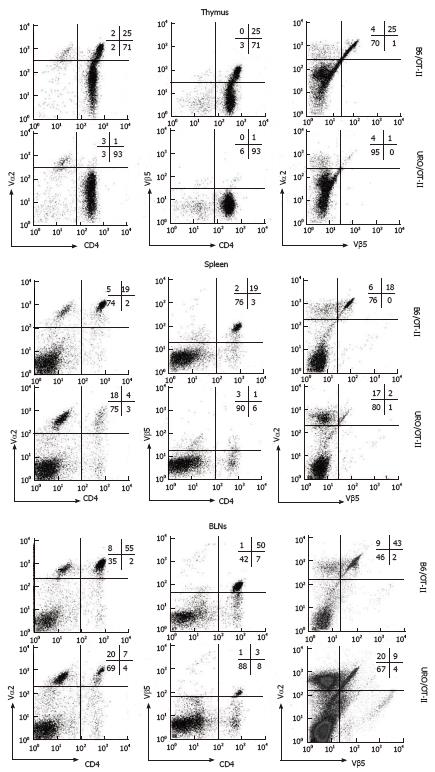
Figure 2 Clonal deletion of OT-II CD4+ T cells in urothelium-ovalbumin/OT-II mice.
Cells from the thymus (top panel), spleen (middle panel), and BLNs (bottom panel) of URO-OVA/OT-II mice (8 wk) were analyzed for surface CD4, Vα2 and Vβ5 by flow cytometry. Age-matched B6/OT-II mice were included for comparison. Gate was set on lymphocytes according to scatter criteria. Percentages of single- and double-positive cells are indicated. Results are representative of 3 separate experiments consisting of 4-6 mice per group. URO/OT-II: Urothelium-ovalbumin/OT-II mice.
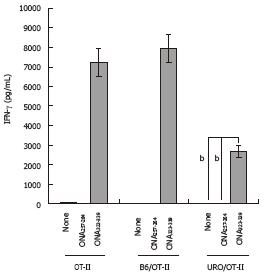
Figure 3 Deletion-escaped OT-II CD4+ T cells retain responsiveness to ovalbumin.
Splenocytes from URO-OVA/OT-II mice (8 wk) were cultured alone or in the presence of OVA257-264 peptide (10 μg/mL) or OVA323-339 peptide (10 μg/mL) for 3 d, followed by ELISA analysis of IFN-γ production in culture supernatants. Splenocytes from age-matched OT-II and B6/OT-II mice were included for comparison. Data are presented as the mean ± SD from duplicate determinations. bP < 0.001 compared with non-stimulated or OVA257-264-stimulated splenocytes (two-tailed Student’s t test). URO/OT-II: Urothelium-ovalbumin/OT-II mice.
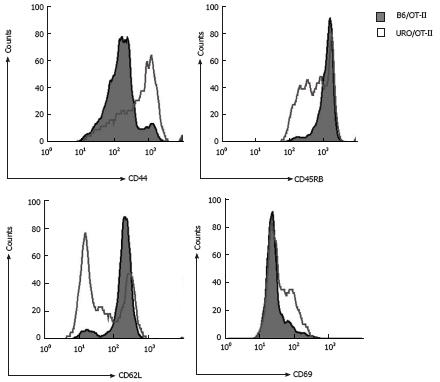
Figure 4 OT-II CD4+ T cells gain activation in the bladder draining lymph nodes of urothelium-ovalbumin/OT-II mice.
BLN cells of URO-OVA/OT-II mice (8 wk) were analyzed for surface CD44, CD45RB, CD62L, and CD69 by flow cytometry. Age-matched B6/OT-II mice were included for comparison. Gate was set on CD4+ T cells. Results are representative of 3 separate experiments consisting of 5 mice per group. Filled histograms: B6/OT-II mice; Gray line histograms: URO-OVA/OT-II mice. URO/OT-II: Urothelium-ovalbumin/OT-II mice; BLN: Bladder draining lymph nodes.
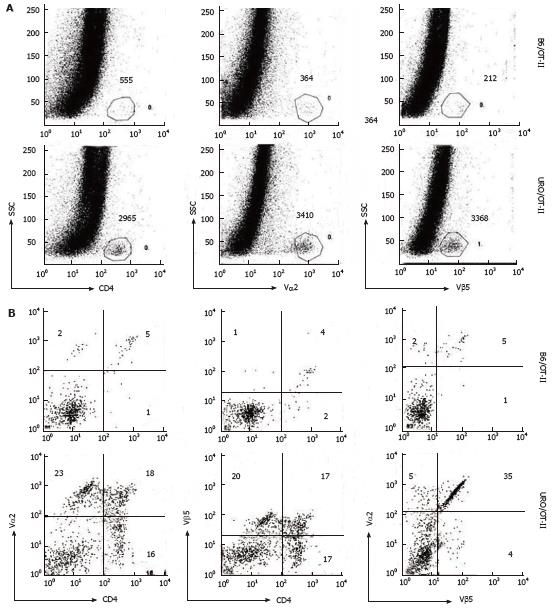
Figure 5 OT-II CD4+ T cells infiltrate into the bladders of urothelium-ovalbumin/OT-II mice.
Bladder single-cell suspensions were prepared from URO-OVA/OT-II mice (8 wk) and analyzed for surface CD4, Vα2 and Vβ5 by flow cytometry. Age-matched B6/OT-II mice were included for comparison. Gate was set on lymphocytes according to scatter criteria. Total numbers of CD4+, Vα2+ and Vβ5+ cells per bladder are indicated in (A) and percentages of single- and double-positive cells per bladder indicated in (B). Results are representative of 3 separate experiments consisting of 5-8 mice per group. URO/OT-II: Urothelium-ovalbumin/OT-II mice.
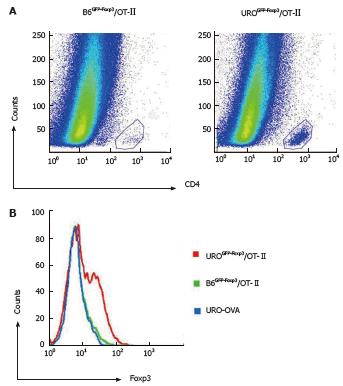
Figure 6 Bladder infiltrating CD4+ T cells consist of Treg cells in urothelium-ovalbuminGFP-Foxp3/OT-II mice.
Bladder single-cell suspensions were prepared from URO-OVAGFP-Foxp3/OT-II mice (8 wk) and analyzed by flow cytometry. Age-matched B6GFP-Foxp3/OT-II mice were included for comparison. A: Flow cytometric analysis of bladder infiltrating CD4+ T cells. Gate was set on lymphocytes according to scatter criteria; B: Flow cytometric analysis of bladder infiltrating GFP-positive CD4+ T cells (i.e., Foxp3+CD4+ T cells). Gate was set on CD4+ T cells. Results are representative of 3 separate experiments consisting of 6 mice per group. UROGFP-Foxp3/OT-II: Urothelium-ovalbuminGFP-Foxp3/OT-II mice.
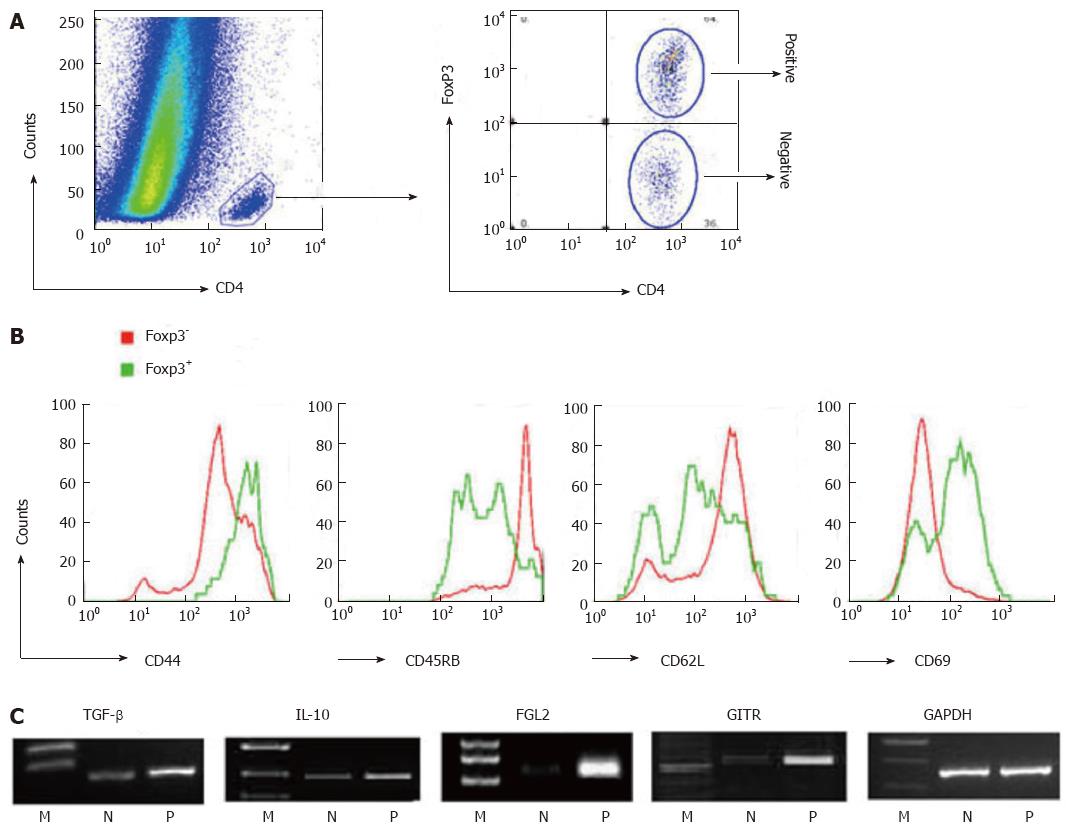
Figure 7 Bladder infiltrating CD4+ Treg cells are functionally active and express inhibitory effector molecules in urothelium-ovalbuminGFP-Foxp3/OT-II mice.
Bladder single-cell suspensions were prepared from URO-OVAGFP-Foxp3/OT-II mice (8 wk) and analyzed by flow cytometry or sorted for GFP-positive (Foxp3+) and GFP-negative (Foxp3-) CD4+ T cells. A: Bladder infiltrating CD4+ T cells consist of both GFP-positive (Foxp3+) and GFP-negative (Foxp3-) populations by flow cytometry. Gate was set on lymphocytes according to scatter criteria; B: Flow cytometric analysis of surface CD44, CD45RB, CD62L and CD69 on bladder infiltrating GFP-positive (Foxp3+) and GFP-negative (Foxp3-) CD4+ T cells. Gate was set on CD4+ T cells; C: RT-PCR analysis of TGF-β, IL-10, FGL2 and GITR mRNAs in bladder infiltrating GFP-positive (Foxp3+) and GFP-negative (Foxp3-) CD4+ T cells. GAPDH was used as an internal control. M: Marker; N: GFP-negative (Foxp3-) CD4+ T cells; P: GFP-positive (Foxp3+) CD4+ T cells; UROGFP-Foxp3/OT-II: Urothelium-ovalbuminGFP-Foxp3/OT-II mice; RT-PCR: Reverse transcriptase-polymerase chain reaction; TGF: Transforming growth factor; GITR: Glucocorticoid-induced tumor necrosis factor receptor.
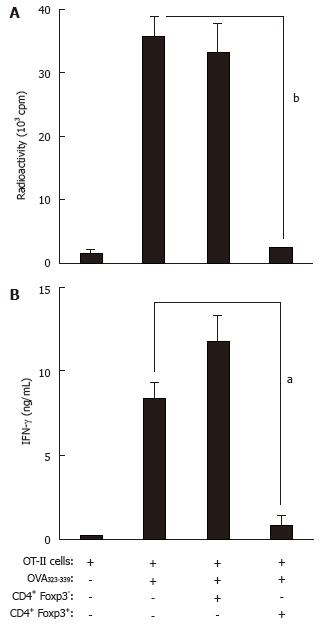
Figure 8 Treg cells from urothelium-ovalbuminGFP-Foxp3/OT-II mice are suppressive to ovalbumin-specific CD4+ T cells.
A: OT-II splenocytes were incubated alone or in the presence of OVA323-339 peptide (10 μg/mL), GFP-positive (Foxp3+) CD4+ T cells (at a 1:1 ratio), and/or GFP-negative (Foxp3-) CD4+ T cells (at a 1:1 ratio) sorted from URO-OVAGFP-Foxp3/OT-II mice for 3 d. Proliferation was assessed by labeling the cultures with 3H-thymidine for the final 18 h. Data are presented as the mean ± SD from triplicate cultures. bP < 0.001 compared with OT-II cells stimulated with OVA323-339 peptide alone (two-tailed Student’s t test); B: Culture supernatants from a parallel plate were collected after 3-d incubation and analyzed for IFN-γ by ELISA. Data are presented as the mean ± SD from duplicate cultures. aP < 0.05 compared with OT-II cells stimulated with OVA323-339 peptide alone (two-tailed Student’s t test). UROGFP-Foxp3/OT-II: Urothelium-ovalbuminGFP-Foxp3/OT-II mice.
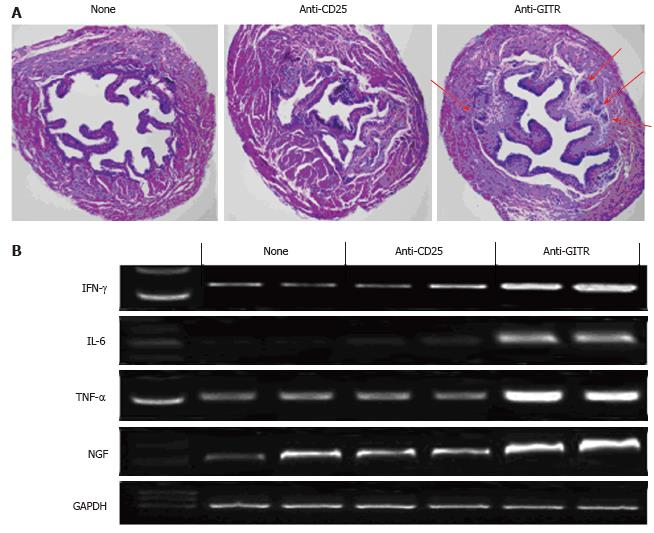
Figure 9 Depletion of CD4+ Treg cells results in bladder autoimmune inflammation in urothelium-ovalbuminGFP-Foxp3/OT-II mice.
URO-OVAGFP-Foxp3/OT-II mice were treated with anti-CD25 or anti-GITR mAb every other day beginning at 6 wk of age and sacrificed for analysis at 10 wk. A: Bladder histological H and E staining. The slides are representative of 12 bladders for each of anti-CD25 and anti-GITR mAb treated groups. Cellular infiltration is indicated by red arrows. The bladder of an untreated mouse is included for comparison. The summary of bladder histological inflammation is shown in Table 1; B: RT-PCR analysis of IFN-γ, IL-6, TNF-α and NGF mRNA expressions in the bladders of mice treated with anti-CD25 or anti-GITR mAb. GAPDH was used as an internal control. The bladders from untreated mice are included for comparison. UROGFP-Foxp3/OT-II: Urothelium-ovalbuminGFP-Foxp3/OT-II mice; RT-PCR: Reverse transcriptase-polymerase chain reaction; IFN: Interferon; TNF: Tumor necrosis factor; NGF: Nerve growth factor.
- Citation: Liu WJ, Luo Y. Regulatory T cells suppress autoreactive CD4+ T cell response to bladder epithelial antigen. World J Immunol 2016; 6(2): 105-118
- URL: https://www.wjgnet.com/2219-2824/full/v6/i2/105.htm
- DOI: https://dx.doi.org/10.5411/wji.v6.i2.105


