Copyright
©The Author(s) 2017.
World J Clin Urol. Mar 24, 2017; 6(1): 18-26
Published online Mar 24, 2017. doi: 10.5410/wjcu.v6.i1.18
Published online Mar 24, 2017. doi: 10.5410/wjcu.v6.i1.18
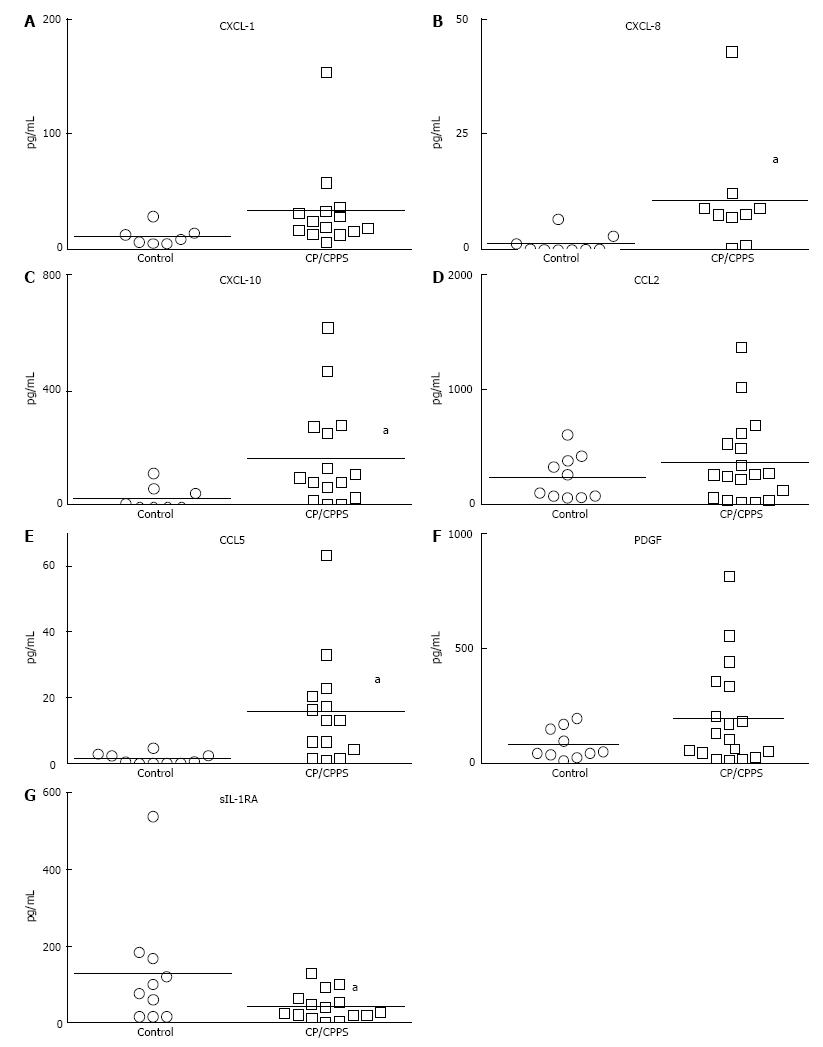
Figure 1 Comparative baseline levels of cytokines, CXC and CC chemokines and growth factors in urine obtained from asymptomatic individuals and chronic prostatitis/chronic pelvic pain syndrome patients.
A-C: Urine levels of CXCL-1, CXCL-8 and CXCL-10 chemokines at baseline were significantly elevated in CP/CPPS patients (aP < 0.05). Quantitatively, levels of CXCL-10 (169.8 ± 46.38 pg/mL vs 31.45 ± 16.83 pg/mL) that attract lymphocytes were higher relative to other CXC chemokines CXCL-1 and CXCL-8 that attract neutrophils (notice scale on y-axis). Levels of CC chemokine, CCL-5 (RANTES) also chemotactic for lymphocytes (E) were significantly elevated in CP/CPPS relative to controls (aP < 0.05). Lymphocytic infiltration previously noted in biopsy of CP/CPPS patients is also consistent with significantly lower levels of sIL-1RA in CP/CPPS (G) compared to controls (aP < 0.05). Due to high variability in control group, results were not significant with respect to CCL2 and PDGF (D and F, respectively). Horizontal bars represent mean of the group and Mann-Whitney U test was used for unpaired comparison and chemokines with significant difference appear in bold. CP/CPPS: Chronic prostatitis/ronic pelvic pain syndrome; sIL-1RA: Soluble interleukin-1 receptor antagonist.
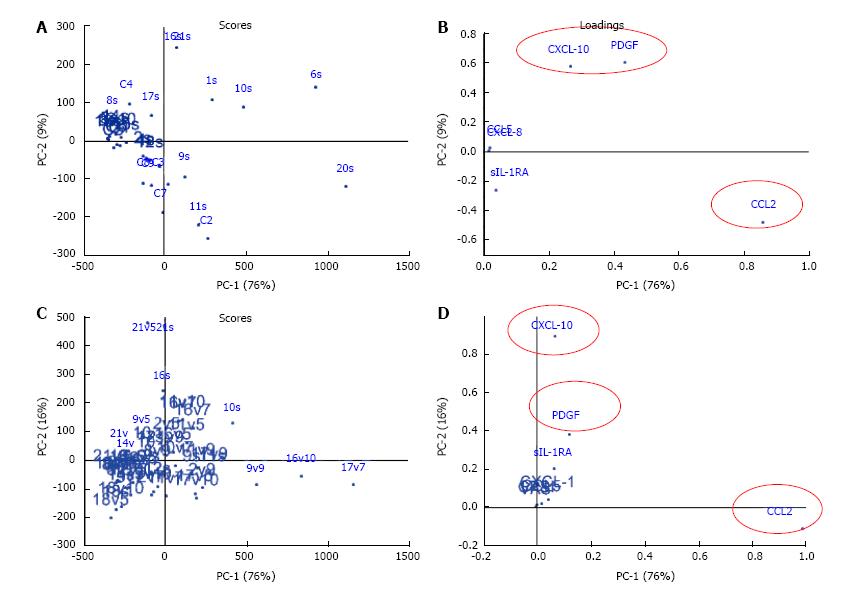
Figure 2 Visualization of principal component analysis for the cross sectional data of asymptomatic controls (C1-10) and chronic prostatitis/chronic pelvic pain syndrome patients (1 s-21 s).
At baseline (A and B) and the longitudinal treatment response data of adherent and non-adherent CP/CPPS patients (C and D), PC1 and PC2 explained 76 % and 9% of the data characteristics at baseline (A and B), respectively which in turn was explained largely by the variation in the urine levels of CCL2, CXCL-10 and PDGF. Majority of CP/CPPS mapped separately from a close cluster for controls (A), and the scatter of CP/CPPS is explained by disease heterogeneity as revealed by the variation in the levels of different chemokines in CP/CPPS at baseline (Figure 1). PCA of longitudinal data also included VAS and CPSI scores measured at each visit as variables, where each dot represents the expression profile of an individual patient at a singular timepoint identified by baseline (s), visit 5 (v5), visit7 (v7), visit 9 (v9), and final visit (v10) (C). PCA allowed grouping of patients with overall similar cytokine expression profiles at individual time points. Compared to PCA of cross-sectional data (A and B), the contribution of CCL2 was slightly increased whereas contribution of CXCL-10 was slightly reduced in PC1 of longitudinal data (Panel D). The urine levels of CXCL-1 and CCL5 together with CPSI scores only contributed < 1% to both PC1 and PC2 scores. PC: Principal components; PDGF: Platelet derived growth factor.
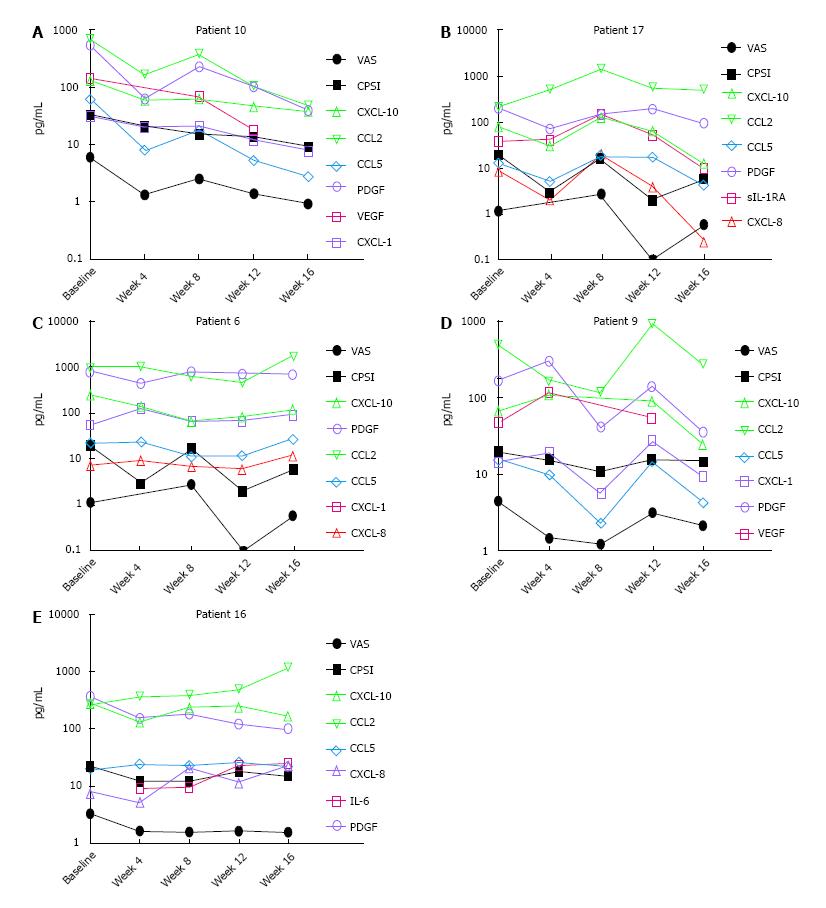
Figure 3 Significant improvement in clinical outcome measures was noted post treatment in adherent chronic prostatitis/chronic pelvic pain syndrome patients.
A-E: The disease heterogeneity and variability in response to treatment in CP/CPPS patients is highlighted by different urinary chemokines correlating with the clinical outcome scores measured at each visit (VAS and CPSI) in different treatment adherent Patients 6, 9, 10, 16 and 17 at baseline and week 4, 8, 12 and 16 after starting treatment. Lower VAS in Patient 10 strongly correlated with reduced urine levels of CXCL-10 (triangle; Pearson r = 0.97; P = 0.003), CCL2 (Inverted triangle; r = 0.97; P = 0.005), CCL5 (diamond; r = 0.99; P < 0.0001), VEGF (square; r = 0.98; P = 0.003) and PDGF (circular; r = 0.99; P < 0.0001) at various time points and CPSI scores correlated with CXCL-10 (triangle; Pearson r = 0.96; P = 0.009), CCL2 (Inverted triangle; r = 0.86; P = 0.05), CCL 5 (diamond; r = 0.91; P = 0.03), VEGF (square; r = 0.80; P = 0.1), PDGF (circular; r = 0.86; P = 0.06) and CXCL-1 (rs = 0.9; P = 0.08) (A). In contrast, in Patient 17, only VAS scores showed strong correlation with CXCL-10 (triangle) (Pearson r = 0.84; P = 0.07), IL-8 (triangle) (r = 0.94; P = 0.01) and sIL-1RA (square) (r = 82; P = 0.08) (B) and CPSI showed Spearman rs coefficient of 0.4-0.5 for PDGF, CXCL-10 and CXCL-8 without any significance. In Patient 6 (C), reduced CXCL-10 (triangle) linearly correlated with lower VAS (r = 0.89; P = 0.04) and CPSI (r = 0.82; P = 0.08) wheera PDGF (circular) was non-linearly correlated with VAS (rs = 0.89; P = 0.08) and CPSI (rs = 0.9; P = 0.08). In Patient 9 (D), lower CCL5 (diamond) strongly correlated with VAS (r = 0.80; P = 0.09) and CPSI (r = 0.86; P = 0.05) whereas CCL2 (inverted triangle) shown non-linear correlation withVAS (rs = 0.9; P = 0.08). In Patient 16 (E), PDGF (circular) correlated with VAS (r = 0.95; P = 0.01) and CPSI correlated with CXCL-10 (triangle) (rs = 0.82; P = 0.13) Notice the log-scale on the y-axis in all the panels. The units of pg/mL only apply to chemokines and not to VAS and CPSI scores. PDGF: Platelet derived growth factor; VAS: Visual analog scale; CPSI: Chronic Prostatitis Symptom Index; IL: Interleukin; VEGF: Vascular endothelial growth factor.
- Citation: Tyagi P, Killinger K, McLennan G, Jayabalan N, Chancellor M, Peters KM. Urine chemokine levels correlate with treatment response to phosphodiesterase 4 inhibitor in prostatitis. World J Clin Urol 2017; 6(1): 18-26
- URL: https://www.wjgnet.com/2219-2816/full/v6/i1/18.htm
- DOI: https://dx.doi.org/10.5410/wjcu.v6.i1.18


