Copyright
©2014 Baishideng Publishing Group Inc.
World J Clin Urol. Nov 24, 2014; 3(3): 351-357
Published online Nov 24, 2014. doi: 10.5410/wjcu.v3.i3.351
Published online Nov 24, 2014. doi: 10.5410/wjcu.v3.i3.351
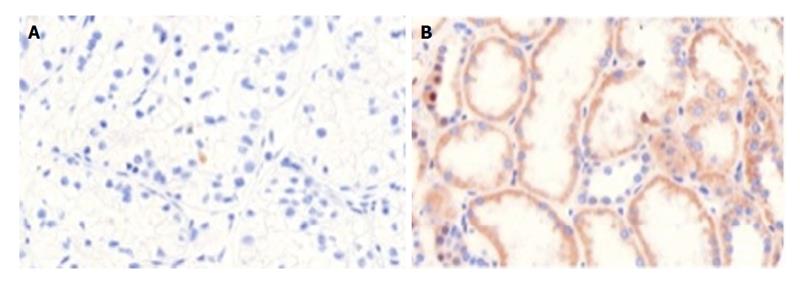
Figure 1 Histopathological staining results of malignant (pT2) renal tissue (A) and of a control sample (B) (haematoxylin and eosin staining, magnification factor: 40 ×).
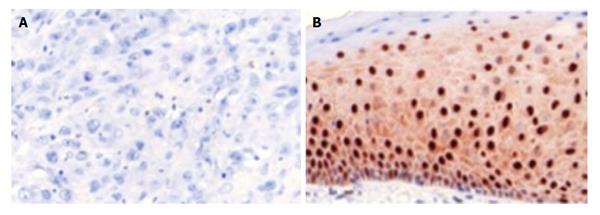
Figure 2 Histopathological staining results of malignant (pT3) penile tissue (A) and of a control sample (B) (haematoxylin and eosin staining, magnification factor: 40 ×).
Figure 3 Percentual distribution of core intensity (A), cytoplasmatic-(B) and programmed cell death 4 staining results in correlation to renal cell carcinoma subtype and controls.
Left weak/negative staining, right strong/positive staining result. RCC: Renal cell carcinoma; ccRCC: Clear cell RCC; pRCC: Papillary RCC; chRCC: Chromophobe RCC; sRCC: Sarcomatoid RCC.
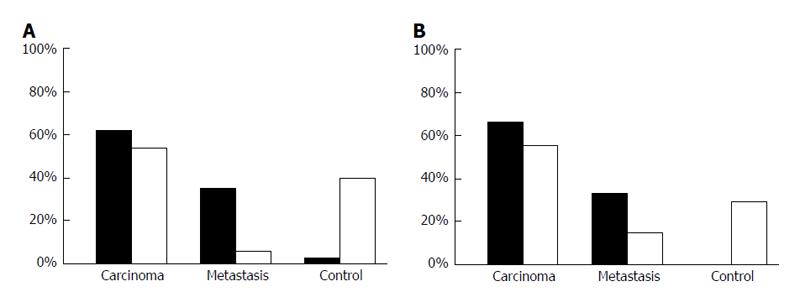
Figure 4 Percentual distribution of core (A) and cytoplasmic programmed cell death 4 (B) levels in penile carcinoma tissue compared to metastasies and controls.
Left weak/negative staining, right strong/positive staining result.
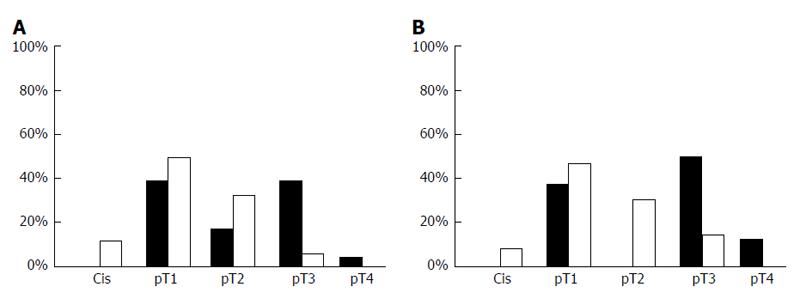
Figure 5 Percentual distribution of core (A) and cytoplasmatic (B) programmed cell death 4 staining results in correlation to T-stage of penile carcinoma and controls.
Left weak/negative staining, right strong/positive staining result.
Figure 6 Percentual distribution of core (A) and cytoplasmatic (B) programmed cell death 4 staining results in correlation to Seminoma-, non-seminomatous germ cell tumor and controls.
Left weak/negative staining, right strong/positive staining result. NSGCT: Non-seminomatous germ cell tumor.
- Citation: Fischer N, Göke F, Kahl P, Splittstößer V, Lankat-Buttgereit B, Müller SC, Ellinger J. Programmed cell death protein 4 expression in renal cell carcinoma, penile carcinoma and testicular germ cell cancer. World J Clin Urol 2014; 3(3): 351-357
- URL: https://www.wjgnet.com/2219-2816/full/v3/i3/351.htm
- DOI: https://dx.doi.org/10.5410/wjcu.v3.i3.351


