


Published online Sep 9, 2024. doi: 10.5409/wjcp.v13.i3.94721
Revised: June 28, 2024
Accepted: July 10, 2024
Published online: September 9, 2024
Processing time: 159 Days and 7.6 Hours
Insulin resistance and obesity present significant challenges in pediatric populations. Selenoprotein P1 (SEPP1) serves as a biomarker for assessing sele
To ascertain SEPP1 blood levels in children and adolescents diagnosed with obesity and to assess its correlation with insulin resistance and adiposity indices.
170 children participated in this study, including 85 diagnosed with obesity and an equal number of healthy counterparts matched for age and sex. Each participant underwent a comprehensive medical evaluation, encompassing a detailed medical history, clinical examination, and anthropometric measurements like waist circumference and waist-to-height ratio. Furthermore, routine blood tests were conducted, including serum SEPP1, visceral adiposity index (VAI), and Homeostatic Model Assessment of Insulin Resistance (HOMA-IR) level.
Our findings revealed significantly lower serum SEPP1 levels in children with obesity compared to their healthy peers. Moreover, notable negative correlations were observed between serum SEPP1 levels and body mass index, VAI, and HOMA-IR.
The study suggests that SEPP1 could serve as a valuable predictor for insulin resistance among children and adolescents diagnosed with obesity. This highlights the potential utility of SEPP1 in pediatric metabolic health assessment and warrants further investigation.
Core Tip: This study investigates the association between serum Selenoprotein P1 (SEPP1) levels and insulin resistance in pediatric obesity. Conducted on 170 children, the study reveals significantly lower SEPP1 levels in obese children compared to healthy peers, with notable negative correlations between SEPP1 levels and adiposity indices such as body mass index, visceral adiposity index, and Homeostatic Model Assessment of Insulin Resistance. The findings suggest SEPP1's potential as a predictor for insulin resistance in pediatric obesity, highlighting its utility in metabolic health assessment. However, further research is needed to determine the temporal relationship between SEPP1 levels and insulin resistance onset in pediatric obesity, emphasizing the importance of continued investigation in this area for clinical practice.
- Citation: Elbarky A, Ismail KG, Yousef YF, Elshafiey RMG, Elsharaby RM, El-Kaffas A, Al-Beltagi M. Selenoprotein-p and insulin resistance in children and adolescents with obesity. World J Clin Pediatr 2024; 13(3): 94721
- URL: https://www.wjgnet.com/2219-2808/full/v13/i3/94721.htm
- DOI: https://dx.doi.org/10.5409/wjcp.v13.i3.94721
Obesity among children is a significant global health concern[1]. Various factors contribute to its increasing prevalence, including personal habits, cultural beliefs, genetic predisposition, and environmental influences[2]. In addition to excessive fat accumulation, obesity is characterized by adipose tissue dysfunction, disrupting the regulation of adipocytokines and interfering with insulin action signaling pathways[3]. Insulin resistance (IR) is increasingly common in children and adolescents and is often associated with obesity and metabolic syndrome. Ethnic variations in IR prevalence underscore the importance of considering cardiovascular risks across different racial and ethnic groups, emphasizing the need for preventive strategies due to the lack of established diagnostic criteria for IR in children[4].
Selenoprotein P (SEPP1) is among the 25 human selenocysteine (Sec)-containing proteins[5]. It plays a crucial role in selenium transport to target organs, thereby reducing oxidative stress by delivering protective selenoproteins[6]. Under normal physiological conditions, SEPP1's plasma concentration remains stable, but significant changes occur in certain pathophysiological states[7]. Selenium, an essential nutrient, modulates insulin signaling and impacts carbohydrate and fat metabolism[8]. SEPP1 levels exhibit better predictive accuracy for insulin tolerance compared to fasting blood glucose or HbA1c[9]. Additionally, SEPP1 serves as a biomarker for evaluating selenium status in obesity[10]. However, research on selenium levels in obesity yields inconsistent results regarding selenium status variations among overweight and individuals with obesity and its association with metabolic risk factors[8].
Despite its utility as a selenium status indicator, no research has investigated the relationship between serum SEPP1 concentrations and insulin resistance in children[11]. Addressing this gap, our study aims to explore the link between insulin resistance and selenium status in children with obesity by assessing their serum SEPP1 levels.
This cross-sectional comparative study enrolled 170 children from the Clinical Nutrition Unit, Pediatrics Department, Tanta University Hospital, Egypt. The survey was scheduled to be conducted in November 2023. Before recruitment, a thorough a priori power analysis was conducted to ensure an adequate sample size for achieving statistical significance. Ethical approval for the study was obtained from the Ethical Committee of the Faculty of Medicine, Tanta University, Egypt (Registration NO: 36264PR424/11/23). Written consent was obtained from parents or caregivers before enrolling their children in the study.
At the onset of the study, 535 medical records of children diagnosed with obesity between January 2021 and November 2023 underwent review. Following contact with families, 62 declined participation. Of the 473 families scheduled for clinic visits, 388 children were excluded based on specific criteria. Eventually, 85 children diagnosed with obesity, according to the World Health Organization's age and sex-specific body mass index (BMI) charts, were enrolled in the study, along with 85 matched healthy controls[12].
The exclusion criteria included children below 6 years or above 16 years of age (n = 57), BMI exceeding -3 standard deviations or ≥ 40 kg/m² (n = 51), underlying endocrine or genetic causes of obesity (n = 30 and 19 respectively), complications impacting SEPP1 levels (such as polycystic ovary syndrome, non-alcoholic fatty liver disease, hypertension) (n = 96), presence of acute or chronic inflammatory processes other than obesity (n = 47), incomplete investigations (n = 43), use of medications affecting selenium status (such as steroids, anticonvulsants, antidepressants) (n = 14), and recent vitamins or minerals supplementation within the last three months (n = 31).
Medical history and physical examination: We collected demographic information and obtained family medical history related to obesity, hypertension, or diabetes. A comprehensive physical examination was conducted, which included blood pressure measurements and evaluation for clinical signs of insulin resistance. Anthropometric measurements such as weight, height, BMI, waist circumference, and waist/height ratio were determined and plotted on corresponding growth charts to assess z-scores and centiles. Z-scores indicate how many standard deviations an individual's measurement is from the mean of a reference population. Percentiles rank a measurement's position within a data distribution[13-15].
Laboratory assessment: We conducted a complete blood count, liver function tests, and a comprehensive lipid profile assessment, including serum cholesterol, triglycerides, high-density lipoprotein cholesterol (HDL), and low-density lipoprotein cholesterol (LDL). The lipid profile was analyzed using a fully automatic biochemical analyzer (Beckman, Japan, AU5800). Fasting blood glucose (FBG) was measured using glucose oxidase while fasting insulin levels were obtained through electrochemiluminescence.
Insulin resistance was calculated using the Homeostasis Model Assessment insulin resistance (HOMA-IR) index, employing the formula: HOMA-IR = fasting glucose (mg/dL) × fasting insulin (uIU/mL) / 405. HOMA-IR values exceeding 3.54 are diagnostic for insulin resistance[16]. Additionally, we utilized the visceral adiposity index (VAI) to assess metabolic and fat distribution, aiding in identifying cardiometabolic disease risks and metabolic syndrome. To calculate VAI, the following formulas were employed[17,18]:
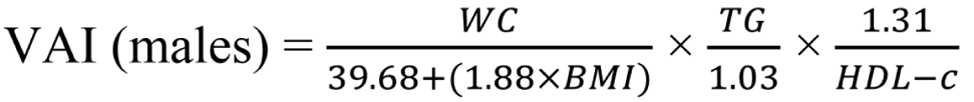
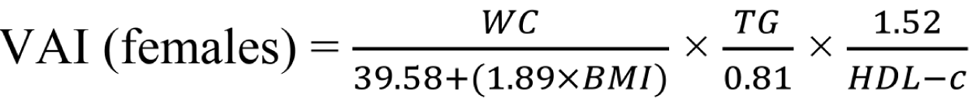
WC is measured in centimeters, BMI in kg/m2, TG and HDL-C in mmol/L[19].
Selenoprotein-P 1 level measurement: The serum levels of SEPP1 were determined utilizing the enzyme-linked immunosorbent assay (ELISA) method with a specific assay kit (Catalog No: DL-SEPP1-Hu, Glory Science, United States). This assay method is tailored to quantify SEPP1 concentrations in human serum samples, with all measurements conducted following the manufacturer's instructions to ensure accuracy and reliability. Fasting blood samples were obtained via peripheral venipuncture in the early morning and collected in plain tubes, except for the 2 mL sample designated for complete blood count, which was stored in an EDTA vacutainer tube. Subsequently, centrifugation was performed at 4 °C for 30 minutes at 1000 g to obtain serum samples. The extracted supernatant was stored at -80 °C until further analysis to prevent degradation and maintain SEPP1 stability. SEPP1 levels were quantified through ELISA following the provided assay protocol. The absorbance of the samples was measured spectrophotometrically at a specific wavelength using a microplate reader. A standard curve, generated using known SEPP1 concentrations provided in the assay kit, facilitated the determination of SEPP1 levels in the serum samples. Internal quality control measures were implemented throughout the assay procedure to ensure precision and accuracy. Duplicate measurements were conducted for each sample, and the coefficient of variation between duplicates was monitored to uphold assay reliability.
We utilized IBM Corp.'s Statistical Package for Social Sciences version 27 (IBM Corp., Armonk, NY, United States) to conduct statistical analysis. Since our numerical data were not normally distributed, descriptive statistics were presented using the median and interquartile range (IQR: 25th–75th percentiles). Categorical data were expressed as frequencies and percentages. To compare the study and control groups, we employed the non-parametric Mann-Whitney test for non-parametric data analysis. Associations between numerical variables were explored using Spearman’s rank-order correlation analysis, while Pearson’s χ2 test was utilized to assess the independence of categorical variables. The performance of SEPP1 in distinguishing participants with and without insulin resistance was evaluated using receiver operating characteristics (ROC) curve analysis. mean ± SD measurements were used for comparative purposes with findings from similar studies in the field. Logistic regression was conducted to assess variables affecting the probability of insulin resistance, while multiple linear regression assessed the effect of potentially relevant variables on SEEP1 levels. A significance level of P < 0.05 was applied to determine statistical significance in all analyses conducted.
Figure 1 shows the flow chart of the study, which involved 85 children and adolescents diagnosed with obesity, with a female-to-male ratio of 1.4: 1. The study identified a significant increase in the number of participants with obesity and a positive family history of obesity, diabetes, and hypertension. Among the participants, 48 (56.5%) exhibited acanthosis nigricans, 19 (22.4%) had gynecomastia, 13 (15.3%) presented with acne and hirsutism, and 6 (7%) had striae, buried penis, hip pain, and/or limp. Children with obesity demonstrated higher weight, height, BMI, waist circumference, weight/height ratio, and systolic blood pressure compared to their counterparts without obesity. Table 1 presents the clinical characteristics of the study group.

| Control, n = 85 | With obesity, n = 85 | P value | ||
| Age of enrolment (years) | mean ± SD | 10.35 ± 2.33 | 10.48 ± 2.34 | 0.7431 |
| Median [IQR] | 10.00 [9.00-12.00] | 10.00 [8.50-12.00] | ||
| Sex | Male | 46 (54.1) | 35 (41.2) | 0.0912 |
| Female | 39 (45.9) | 50 (58.8) | ||
| Family history | DM | 19 (22.4) | 33 (39.3) | 0.023a,3; 0.002a,3; < 0.001a,3 |
| HTN | 15 (17.9) | 34 (40.0) | ||
| Obesity | 3 (3.6) | 42 (49.4) | ||
| weight Z-score (SD) | mean ± SD | 0.12 ± 0.72 | 2.32 ± 0.28 | < 0.001a,3 |
| Median [IQR] | 0.29 [-0.33 to 0.70] | 2.30 [2.10 to 2.42] | ||
| Height Z-score (SD) | mean ± SD | -0.05 ± 0.76 | 0.78 ± 0.66 | < 0.001a,3 |
| Median [IQR] | -0.14 [-0.65 to 0.36] | 0.62 [0.24 to 1.40] | ||
| BMI (kg/m2) | mean ± SD | 18.00 ± 2.60 | 28.32 ± 3.51 | < 0.001a,3 |
| Median [IQR] | 17.80 [16.00-19.50] | 28.40 [25.80-30.50] | ||
| BMI Z-score (SD) | mean ± SD | 0.22 ± 0.78 | 2.24 ± 0.19 | < 0.001a,3 |
| Median [IQR] | 0.36 [0.00-0.82] | 2.20 [2.10-2.36] | ||
| Waist circumference (cm) | mean ± SD | 60.44 ± 3.86 | 88.08 ± 8.71 | < 0.001a,3 |
| Median [IQR] | 60.00 [57.50-62.00] | 86.00 [81.00-94.00] | ||
| Waist circumference (centile) | mean ± SD | 38.36 ± 13.27 | 96.45 ± 2.31 | < 0.001a,3 |
| Median [IQR] | 43.00 [26.30-49.10] | 97.00 [95.80-98.00] | ||
| W/H ratio | mean ± SD | 0.43 ± 0.02 | 0.60 ± 0.04 | < 0.001a,3 |
| Median [IQR] | 0.43 [0.41-0.44] | 0.60 [0.57-0.63] | ||
| W/H ratio (centile) | mean ± SD | 33.27 ± 15.93 | 95.39 ± 3.38 | < 0.001a,3 |
| Median [IQR] | 30.80 [18.70-50.00] | 96.00 [93.60-97.80] | ||
| SBP (centile) | mean ± SD | 51.76 ± 13.95 | 54.89 ± 18.98 | 0.2003 |
| Median [IQR] | 51.00 [46.00-58.00] | 55.00 [49.00-61.00] | ||
| DBP (centile) | mean ± SD | 53.72 ± 13.45 | 54.36 ± 14.80 | 1.0003 |
| Median [IQR] | 47.00 [43.00-59.00] | 51.00 [48.00-66.00] | ||
| ALT (U/L) | mean ± SD | 24.44 ± 3.54 | 24.75 ± 7.68 | 1.0003 |
| Median [IQR] | 26.00 [22.00-27.00] | 24.00 [22.00-26.00] | ||
| AST (U/L) | mean ± SD | 22.42 ± 4.20 | 23.20 ± 5.65 | 0.3003 |
| Median [IQR] | 22.00 [18.00-26.00] | 22.00 [19.00-26.00] | ||
| Total cholesterol (mg/dL) | mean ± SD | 145.91 ± 14.21 | 156.86 ± 23.93 | < 0.001a,3 |
| Median [IQR] | 146.00 [138.00-159.00] | 151.00 [143.00-165.00] | ||
| HDL-C (mg/dL) | mean ± SD | 48.25 ± 3.88 | 40.66 ± 3.03 | < 0.001a,3 |
| Median [IQR] | 47.00 [45.00-50.00] | 42.00 [40.00-42.00] | ||
| LDL-C (mg/dL) | mean ± SD | 92.71 ± 11.60 | 101.12 ± 19.68 | 0.001a,3 |
| Median [IQR] | 94.00 [82.00-104.00] | 91.00 [85.00-110.00] | ||
| Triglycerides (mg/dL) | mean ± SD | 75.65 ± 16.95 | 109.12 ± 28.24 | < 0.001a,3 |
| Median [IQR] | 73.00 [60.00-89.00] | 103.00 [89.00-115.00] | ||
| VAI | mean ± SD | 0.94 ± 0.22 | 1.70 ± 0.57 | < 0.001a,3 |
| Median [IQR] | 1.01 [0.76-1.05] | 1.63 [1.11-2.20] | ||
| Serum insulin (uIU/mL) | mean ± SD | 8.05 ± 2.09 | 17.23 ± 7.50 | < 0.001a,3 |
| Median [IQR] | 8.00 [6.20-8.90] | 17.20 [11.60-19.70] | ||
| FBS (mg/dL) | mean ± SD | 72.04 ± 6.97 | 81.37 ± 15.21 | < 0.001a,3 |
| Median [IQR] | 71.00 [68.00-74.00] | 80.00 [70.00- 5.00] | ||
| HOMA-IR | mean ± SD | 1.42 ± 0.42 | 3.51 ± 1.85 | < 0.001a,3 |
| Median [IQR] | 1.40 [1.20-1.60] | 3.50 [2.10-4.00] | ||
| SEPP1 (ng/mL) | mean ± SD | 70.97 ± 6.49 | 12.12 ± 10.92 | < 0.001a,3 |
| Median [IQR] | 69.47 [65.89-77.42] | 7.69 [5.82-13.99] | ||
| Insulin resistance | Present | 5 (5.9) | 39 (45.9) | < 0.001a,3 |
| Absent | 80 (94.1) | 46 (54.1) | ||
Among children with obesity, significant increases were observed in serum cholesterol, HDL-C, LDL-C, triglycerides, HOMA-IR, fasting blood sugar, serum insulin concentration, and VAI, as outlined in Table 1. Conversely, serum SEPP1 concentration levels were markedly lower in children with obesity compared to the control group (P < 0.001). Additionally, approximately 45.9% of children with obesity and only 5.9% of the control group exhibited insulin resistance based on HOMA-IR > 3.54, as depicted in Table 1.
Table 2 illustrates negative correlations between SEPP1 and several variables, including weight, BMI, waist circumference, weight/height ratio (W/H), W/H ratio centile, VAI, serum insulin, FBG, and HOMA-IR within the group of obese children.
| SEPP1 (ng/mL), children with obesity | ||
| rs | P value | |
| Age of enrolment (years) | -0.098 | 0.371 |
| weight Z score (SD) | -0.001 | 0.995 |
| Height Z score (SD) | 0.042 | 0.701 |
| BMI (kg/m2) | -0.338 | 0.002a |
| BMI Z score (SD) | -0.044 | 0.686 |
| Waist circumference (cm) | -0.527 | < 0.001a |
| Waist circumference (centile) | -0.183 | 0.094 |
| W/H ratio | -0.394 | < 0.001a |
| W/H ratio (centile) | -0.279 | 0.010a |
| ALT (U/L) | -0.240 | 0.027a |
| AST (U/L) | -0.219 | 0.044a |
| Total cholesterol (mg/dL) | -0.185 | 0.089 |
| HDL (mg/dL) | 0.084 | 0.443 |
| LDL (mg/dL) | 0.076 | 0.491 |
| Triglycerides (mg/dL) | -0.012 | 0.916 |
| VAI | -0.252 | 0.020a |
| Serum insulin (uIU/mL) | -0.223 | 0.040a |
| FBS mg/dL | -0.258 | 0.017a |
| HOMA-IR | -0.279 | 0.010a |
Comparison of serum SEPP1 between obese children with and without insulin resistance showed significantly lower values in those with insulin resistance (P < 0.001; Table 3). The purpose of the ROC (Receiver Operating Characteristic) curve analysis in Table 4 is to evaluate the ability of SEPP1 levels to predict obesity in children. The ROC curve helps determine the diagnostic performance of SEPP1 by calculating the Area Under the Curve (AUC), which indicates how well SEPP1 can distinguish between obese and non-obese children. ROC curve analysis indicates that serum SEPP1 significantly predicts insulin resistance in children with obesity, with a ROC AUC of 0.828, 95%CI: 0.724-0.931, P < 0.0001. The optimal cut-off value of serum SEPP1 for predicting the presence of insulin resistance was ≤ 7.5, with a sensitivity of 92.3% and specificity of 86.96% (as shown in Table 4 and Figure 2).

| Obesity children | |
| AUC | 0.828 |
| SE | 0.053 |
| 95%CI | 0.724-0.931 |
| P value | < 0.0001a |
| Cut-off value | ≤ 7.5 |
| Sensitivity (%) | 92.31 |
| Specificity (%) | 86.96 |
| PPV (%) | 85.7 |
| NPV (%) | 93.0 |
The logistic regression analyses in Table 5 aim to identify factors associated with insulin resistance in obese children. Univariate logistic regression identifies potential risk factors individually, while multivariate logistic regression determines the independent effect of each variable when adjusted for other factors. Univariate logistic regression analysis showed a significant association between insulin resistance in obese children (the outcome) and each of age at enrolment, sex, waist circumference, W/H ratio, BMI, and SEEP1 level (all P < 0.05). Multivariate logistic regression was conducted using all the variables in the univariate analysis with backward elimination. The variables that were retained within the model included sex, age at enrolment, BMI, and SEEp1 level. Higher age at enrolment and decreased SEEP level were significantly associated with a higher likelihood of insulin resistance. The final model retained sex and BMI, though their P values were above 0.05, as their exclusion from the final model considerably affected the model's performance (Table 5).
| Independent variables | Univariate regression | Multivariate regression | ||||
| P value | OR | 95%CI for OR | P value | OR | 95%CI for OR | |
| Sex (Male) | 0.018a | 0.399 | 0.186-0.855 | 0.106 | 0.384 | 0.120-1.224 |
| Age of enrolment (years) | 0.046a | 1.170 | 1.003-1.366 | 0.025a | 1.355 | 1.038-1.767 |
| Waist circumference (centile) | 0.034a | 1.150 | 1.010-1.309 | _ | _ | _ |
| W/H ratio (centile) | 0.013a | 1.154 | 1.031-1.292 | _ | _ | _ |
| BMI Z score (SD) | 0.001a | 18.684 | 4.415-79.071 | 0.101 | 13.458 | 0.600-301.944 |
| SEEP1 (ng/mL) | 0.002a | 0.837 | 0.746-0.938 | 0.007a | 0.880 | 0.803-0.966 |
Multiple linear regression analysis was conducted to assess the effect of potentially relevant variables on SEEP1 levels in obese children. The results revealed a significant decrease in SEPP1 level with increased total cholesterol, VAI, and HOMA-IR. Meanwhile, SEPP1 levels increased significantly with increased LDL-C, triglycerides, and serum insulin (Table 6).
| Variables1 | B | 95%CI | P value |
| DBP | -0.571 | -1.313 to 0.171 | 0.129 |
| Height (cm) | 0.077 | -2.640 to 2.794 | 0.955 |
| Waist circumference (cm) | 0.414 | -4.348 to 5.176 | 0.863 |
| BMI (kg/m2) | -0.542 | -1.726 to 0.643 | 0.365 |
| W/H ratio | 33.413 | -631.753 to 698.579 | 0.920 |
| ALT (U/L) | -0.100 | -0.467 to 0.267 | 0.589 |
| AST (U/L) | -0.470 | -1.005 to 0.066 | 0.085 |
| Total Cholesterol (mg/dL) | -0.321 | -0.526 to -0.117 | 0.003a |
| HDL (mg/dL) | -0.893 | -1.835 to 0.049 | 0.063 |
| LDL (mg/dL) | 0.335 | 0.089 to 0.581 | 0.008a |
| Triglycerides (mg/dL) | 0.163 | 0.016 to 0.309 | 0.030a |
| VAI | -8.340 | -15.321 to -1.359 | 0.020a |
| Serum insulin (uIU/mL) | 1.295 | 0.443 to 2.146 | 0.003a |
| HOMA-IR | -6.224 | -9.685 to -2.764 | 0.001a |
SEPP1, a hepatokine protein produced by the liver, is known for its antioxidant functions and its role in insulin sensitivity and glucose metabolism[20]. However, the relationship between SEPP1 levels and metabolic syndrome, non-alcoholic fatty liver disease, and type 2 diabetes has been a topic of conflicting results in previous studies[21-23]. Despite being a sensitive marker for measuring selenium levels, research on SEPP1 levels among children and adolescents with obesity is scarce. Our study fills this gap by investigating the relationship between SEPP1 and obesity-related parameters, including insulin resistance, in a pediatric population. What sets our research apart is its focus on the pediatric population, a unique angle compared to most existing literature on SEPP1 and metabolic health, which primarily focuses on adults. By studying children, our research provides early insights into how SEPP1 levels correlate with obesity and metabolic disturbances from a young age, which is crucial for early intervention strategies. We also took a comprehensive approach, analyzing multiple obesity-related parameters, including BMI, waist circumference, lipid profiles, and insulin resistance markers, and their association with SEPP1 levels. This comprehensive approach allows us to identify more specific relationships and potential mechanisms linking SEPP1 to metabolic health. Unlike many studies that report absolute values, we utilized Z-scores and percentiles for weight, height, and blood pressure, which provide a more standardized assessment and facilitate comparison across different age groups and populations. Our findings indicate that SEPP1 levels are significantly lower in obese children compared to non-obese controls and are inversely correlated with several obesity-related parameters, such as BMI, waist circumference, and insulin resistance markers. Lower SEPP1 levels may be an early indicator of metabolic dysregulation in obese children.
In our study, we observed significantly higher weight, height, and BMI, along with their corresponding z-scores and waist circumference, weight-height ratio, and related centiles, in children diagnosed with obesity (P < 0.001). This finding is consistent with López-Peralta et al[24], who suggested that rapid weight gain during early childhood often leads to increased height velocity and advanced bone age. Our analysis also revealed significantly lower SEPP1 levels in children with obesity (P < 0.001), with a significant negative correlation between SEPP1 level and adiposity measures such as BMI, waist circumference, and waist-to-height ratio. These results indicate that higher adiposity indices are associated with lower SEPP1 levels. The observed reduction in SEPP1 levels among obese children could be due to increased oxidative stress and inflammation, which are common in obesity and are known to affect SEPP1 expression. SEPP1 is involved in antioxidant defense, and its depletion might reflect an impaired response to oxidative stress in obese individuals[25,26].
Notably, variables like diastolic blood pressure, height, and certain liver enzyme levels did not demonstrate significant associations with SEPP1 levels in this cohort. Ko et al[27] similarly reported negative correlations between SEPP1 levels and parameters, including BMI, waist circumference, blood pressure, transaminases, and HOMA-IR. Additionally, studies by Gharipour et al[28] and di Giuseppe et al[29] reported inverse correlations between SEPP1 levels and BMI and metabolic syndrome. Furthermore, several studies have indicated lower levels of selenium biomarkers in patients with obesity[24,25]. Although our findings differed from those of Chen et al[30], Tinkov et al[8], and El-kafrawy et al[31], who reported higher SEPP1 levels in individuals with obesity, it's important to note that these studies were conducted on adults. Moreover, a meta-analysis of some of these studies reported no significant difference in SEPP1 between patients with obesity and those without[32].
The present study revealed significant correlations between SEPP1 levels and lipid profile markers such as total cholesterol, LDL, and triglycerides. Elevated levels of these lipid components were associated with changes in SEPP1 concentrations. In a meta-analysis, Yu et al[32] identified a positive correlation of SEPP1 with LDL cholesterol, although no significant correlation was observed with other glucose and lipid metabolic disease markers. Conversely, Amirkhizi et al[33] reported no significant relationship between serum SEPP levels and total cholesterol, LDL cholesterol, and HDL cholesterol. Still, they found a significant negative correlation with triglycerides in adult females with polycystic ovary syndrome.
Moreover, in the current study, insulin-related variables, including serum insulin levels and HOMA-IR, exhibited significant associations with SEPP1. Our study found a significant inverse relationship between SEPP1 levels and insulin resistance (HOMA-IR). This aligns with the hypothesis that SEPP1 plays a role in glucose metabolism and insulin signaling. Reduced SEPP1 levels may contribute to impaired insulin action and higher insulin resistance, a key feature of metabolic syndrome[34]. These findings also may suggest that dyslipidemia and insulin resistance may play crucial roles in influencing SEPP1 levels in children with obesity. The VAI is a novel cardio-metabolic risk marker reflecting the distribution of abdominal fat and dyslipidemia[17]. Consistent with the findings of El-kafrawy et al[31], our results confirmed a significantly higher VAI in children with obesity (P < 0.001). Our study also identified a significant negative correlation between SEPP1 level and BMI, waist circumference, W/H ratio, HOMA-IR, and VAI in children with obesity, similar to the findings reported by Ko et al[27] and di Giuseppe et al[29]. However, El-kafrawy et al[31] demonstrated statistically significant positive correlations of SEPP1 with serum insulin concentration, HOMA-IR, and visceral adiposity index in the group with obesity and overweight, along with significant negative associations with waist circumference.
Current research demonstrated that SEPP1 levels could serve as a predictive biomarker for insulin resistance among children with obesity, exhibiting high sensitivity and specificity. The area under the ROC curve indicated strong predictive potential, suggesting that SEPP1 measurements might assist in identifying insulin resistance in this demographic. This study revealed that a SEPP1 value of ≤ 7.5 predicts insulin resistance with 92.31% sensitivity and 86.96% specificity. El-kafrawy et al’s study on adults demonstrated an optimal cut-off value of > 5.3 mg/L, with a sensitivity of 71.23% and specificity of 82.35%[31]. Additionally, Zhang et al[26] showed that SEPP levels were higher in patients with overweight/obesity and associated with insulin resistance by HOMA-IR and clamp methods. However, they suggested that obesity, rather than insulin resistance, is central to the increase in SEPP. Obesity increases pro-inflammatory cytokines and free radicals, and SEPP1 aids in adipogenesis and guards against oxidative stress. Thus, decreased SEPP1 expression impairs antioxidant protection from ROS, leading to insulin resistance[26,35]. Several hypotheses explain SEPP1 levels in patients with obesity. Obesity alters the gut microbiota (dysbiosis) due to oxidative stress and chronic inflammatory processes, affecting selenium absorption, bioavailability, and status[36]. Hyperactive inflammation also decreases SEPP1 expression and depletes selenoproteins[37-39]. Additionally, Tinkov et al[8] found that activation of PPARα/γ during adipogenesis enhances LPR2 expression in the epithelium, linking PPARα/γ activation to the increase in SEPP1 uptake.
The factors influencing SEPP1 levels were further analyzed by multiple linear regression. Our findings indicated that lipid profile components such as total cholesterol, LDL, and triglycerides are significantly associated with SEPP1 levels. Additionally, variables associated with insulin resistance, such as VAI, serum insulin, and HOMA-IR, were significant predictors influencing SEPP1 concentrations. As SEPP1 reflects selenium status in the body, and selenium is known to affect the activity of insulin-antagonistic phosphatases, SEPP1 could potentially reflect the insulin resistance status of the body. Conversely, in diabetes, dysregulated carbohydrate metabolism may impact plasma selenium and SEPP1 levels because hepatic biosynthesis of SEPP1 is suppressed by insulin and stimulated under hyperglycemic conditions[40]. Moreover, SEPP1 levels can predict the response to the oral hypoglycemic effects of metformin, offering the potential for tailoring the treatment of insulin resistance and diabetes[41].
Given the strong association between SEPP1 levels and insulin resistance, SEPP1 could serve as a biomarker for the early identification of children at risk for developing metabolic disorders. Early detection allows for timely interventions, which are critical in preventing the progression of obesity-related complications. Further research exploring the underlying mechanisms and longitudinal studies investigating the dynamic changes in SEPP1 levels in response to interventions could provide deeper insights into its role in metabolic health among children with obesity. While our study suggests that SEPP1 levels are inversely correlated with obesity and insulin resistance, it is essential to acknow
Our findings indicate that SEPP1 could be a valuable biomarker for assessing metabolic health, particularly in identifying insulin resistance. However, several factors may explain why SEPP1 is not yet widely used in clinical practice. SEPP1 is a relatively novel biomarker in the context of metabolic disorders. More extensive research and validation studies are required to establish its utility and reliability compared to traditional markers such as fasting insulin, glucose, and HOMA-IR. The measurement of SEPP1 levels requires specific assays that may not be readily available in all clinical settings. Developing standardized, accessible, and cost-effective methods for SEPP1 measurement is crucial for its widespread adoption. Current clinical guidelines for diagnosing and managing metabolic disorders predominantly rely on well-established markers. Incorporating SEPP1 into these guidelines will require robust evidence from large-scale studies and consensus among healthcare professionals.
It's important to remember that the study was limited to a specific demographic region and had a particular sample size. This means that the results may not apply to other populations, limiting the generalizability of the findings. Also, since it was a cross-sectional study, it only provided a snapshot of associations at a single time, making it difficult to establish causal relationships or determine the directionality of observed associations between SEPP1 levels and metabolic parameters. In addition, despite efforts to control participant selection, there could be inherent biases due to exclusion criteria or recruitment methods that could influence the representation of specific subgroups within the study population. Additionally, the study relied on specific assays and measurement techniques to quantify SEPP1 levels and other metabolic parameters, which could affect the strength of the findings. Conducting the study within a single institution might limit the diversity of the population, potentially overlooking variations present in a more extensive and diverse setting. Despite efforts to control for various variables, unaccounted confounding factors or variables not included in the analysis could influence the observed associations. It's also important to note that the study didn't have longitudinal data, which could have provided a clearer understanding of the dynamic nature of the relationships between SEPP1 levels and associated metabolic parameters over time.
This study emphasizes the need for longitudinal investigations spanning diverse populations to validate the observed associations between SEPP1 levels and metabolic indices among children and adolescents with obesity. Long-term studies could unravel the temporal dynamics of SEPP1 alterations and their role in metabolic health progression. Deeper mechanistic studies are warranted to elucidate the underlying pathways linking SEPP1 with obesity-related metabolic disturbances. Investigating how SEPP1 is intricately involved in adiposity-related insulin resistance could provide pivotal mechanistic insights. Considering the predictive potential of SEPP1 for identifying insulin resistance, further research should explore its clinical applicability as a diagnostic biomarker in routine pediatric care. Establishing standardized cutoff values and validation in larger cohorts could enhance its utility in clinical practice. Engaging in interventional trials targeting SEPP1 levels could offer novel therapeutic avenues. Exploring interventions that modulate SEPP1 expression or selenium status may help attenuate metabolic disturbances in children and adolescents with obesity.
Public health efforts focusing on nutritional strategies to optimize selenium intake and maintain adequate SEPP1 levels may play a preventive role in mitigating metabolic risks among the pediatric population at risk of obesity-related complications. Emphasizing education for healthcare providers regarding the role of SEPP1 in pediatric metabolic health could aid in early screening, diagnosis, and personalized interventions for children and adolescents at risk of metabolic dysregulation. These recommendations aim to stimulate further research and translate the findings into tangible clinical and public health strategies, ultimately contributing to enhanced metabolic health outcomes among children and adolescents with obesity.
This study underscores the intricate interplay between SEPP1 levels and metabolic indices among children and adolescents diagnosed with obesity. The investigation revealed a significant inverse correlation between SEPP1 concentrations and adiposity indices, including BMI, waist circumference, and waist-to-height ratio. A noteworthy association was also established between SEPP1 and insulin resistance, indicating its potential as a predictive biomarker. The observed reduction in SEPP1 levels among children with obesity, coupled with its significant negative correlation with markers of adiposity and insulin resistance, suggests a potential role for SEPP1 in the pathophysiology of metabolic disturbances in this demographic. Notably, SEPP1 emerged as a promising predictor of insulin resistance, displaying high sensitivity and specificity, with implications for early identification and intervention strategies.
Moreover, the study highlighted associations between SEPP1 levels and lipid profile components, specifically total cholesterol, LDL, and triglycerides. These findings underscore the multifaceted relationship between SEPP1 and metabolic factors, indicating its potential as a reflective biomarker for assessing metabolic health. While providing valuable insights, this study acknowledges certain limitations inherent in its cross-sectional design and sample characteristics. Longitudinal studies with diverse populations and refined measurement techniques are warranted to validate these associations and elucidate the dynamic nature of SEPP1 in relation to metabolic health among children and adolescents with obesity. Understanding the intricate associations between SEPP1 and metabolic parameters holds promise for delineating novel avenues for early detection, targeted interventions, and tailored management strategies for mitigating metabolic dysregulation among this vulnerable population.
We thank the anonymous referees and editors for their valuable suggestions.
| 1. | Karnik S, Kanekar A. Childhood obesity: a global public health crisis. Int J Prev Med. 2012;3:1-7. [PubMed] |
| 2. | Azab SF, Saleh SH, Elsaeed WF, Elshafie MA, Sherief LM, Esh AM. Serum trace elements in obese Egyptian children: a case-control study. Ital J Pediatr. 2014;40:20. [RCA] [PubMed] [DOI] [Full Text] [Full Text (PDF)] [Cited by in Crossref: 57] [Cited by in RCA: 77] [Article Influence: 7.0] [Reference Citation Analysis (0)] |
| 3. | Jin X, Qiu T, Li L, Yu R, Chen X, Li C, Proud CG, Jiang T. Pathophysiology of obesity and its associated diseases. Acta Pharm Sin B. 2023;13:2403-2424. [RCA] [PubMed] [DOI] [Full Text] [Cited by in RCA: 163] [Reference Citation Analysis (0)] |
| 4. | Barchielli G, Capperucci A, Tanini D. The Role of Selenium in Pathologies: An Updated Review. Antioxidants (Basel). 2022;11. [RCA] [PubMed] [DOI] [Full Text] [Full Text (PDF)] [Cited by in Crossref: 39] [Cited by in RCA: 170] [Article Influence: 56.7] [Reference Citation Analysis (0)] |
| 5. | Al-Beltagi M, Bediwy AS, Saeed NK. Insulin-resistance in paediatric age: Its magnitude and implications. World J Diabetes. 2022;13:282-307. [RCA] [PubMed] [DOI] [Full Text] [Full Text (PDF)] [Cited by in CrossRef: 25] [Cited by in RCA: 21] [Article Influence: 7.0] [Reference Citation Analysis (4)] |
| 6. | Schomburg L, Orho-Melander M, Struck J, Bergmann A, Melander O. Selenoprotein-P Deficiency Predicts Cardiovascular Disease and Death. Nutrients. 2019;11. [RCA] [PubMed] [DOI] [Full Text] [Full Text (PDF)] [Cited by in Crossref: 52] [Cited by in RCA: 78] [Article Influence: 13.0] [Reference Citation Analysis (0)] |
| 7. | Tsutsumi R, Saito Y. Selenoprotein P; P for Plasma, Prognosis, Prophylaxis, and More. Biol Pharm Bull. 2020;43:366-374. [RCA] [PubMed] [DOI] [Full Text] [Cited by in Crossref: 28] [Cited by in RCA: 18] [Article Influence: 3.6] [Reference Citation Analysis (0)] |
| 8. | Tinkov AA, Ajsuvakova OP, Filippini T, Zhou JC, Lei XG, Gatiatulina ER, Michalke B, Skalnaya MG, Vinceti M, Aschner M, Skalny AV. Selenium and Selenoproteins in Adipose Tissue Physiology and Obesity. Biomolecules. 2020;10. [RCA] [PubMed] [DOI] [Full Text] [Full Text (PDF)] [Cited by in Crossref: 37] [Cited by in RCA: 74] [Article Influence: 14.8] [Reference Citation Analysis (0)] |
| 9. | Oo SM, Misu H, Saito Y, Tanaka M, Kato S, Kita Y, Takayama H, Takeshita Y, Kanamori T, Nagano T, Nakagen M, Urabe T, Matsuyama N, Kaneko S, Takamura T. Serum selenoprotein P, but not selenium, predicts future hyperglycemia in a general Japanese population. Sci Rep. 2018;8:16727. [RCA] [PubMed] [DOI] [Full Text] [Full Text (PDF)] [Cited by in Crossref: 50] [Cited by in RCA: 48] [Article Influence: 6.9] [Reference Citation Analysis (0)] |
| 10. | Combs GF Jr. Biomarkers of selenium status. Nutrients. 2015;7:2209-2236. [RCA] [PubMed] [DOI] [Full Text] [Full Text (PDF)] [Cited by in Crossref: 261] [Cited by in RCA: 264] [Article Influence: 26.4] [Reference Citation Analysis (0)] |
| 11. | Huang J, Xie L, Song A, Zhang C. Selenium Status and Its Antioxidant Role in Metabolic Diseases. Oxid Med Cell Longev. 2022;2022:7009863. [RCA] [PubMed] [DOI] [Full Text] [Full Text (PDF)] [Cited by in Crossref: 30] [Cited by in RCA: 34] [Article Influence: 11.3] [Reference Citation Analysis (0)] |
| 12. | Lister NB, Baur LA, Felix JF, Hill AJ, Marcus C, Reinehr T, Summerbell C, Wabitsch M. Child and adolescent obesity. Nat Rev Dis Primers. 2023;9:24. [RCA] [PubMed] [DOI] [Full Text] [Cited by in RCA: 193] [Reference Citation Analysis (0)] |
| 13. | Kuczmarski RJ, Ogden CL, Guo SS, Grummer-Strawn LM, Flegal KM, Mei Z, Wei R, Curtin LR, Roche AF, Johnson CL. 2000 CDC Growth Charts for the United States: methods and development. Vital Health Stat 11. 2002;1-190. [PubMed] |
| 14. | Xi B, Zong X, Kelishadi R, Litwin M, Hong YM, Poh BK, Steffen LM, Galcheva SV, Herter-Aeberli I, Nawarycz T, Krzywińska-Wiewiorowska M, Khadilkar A, Schmidt MD, Neuhauser H, Schienkiewitz A, Kułaga Z, Kim HS, Stawińska-Witoszyńska B, Motlagh ME, Ruzita AT, Iotova VM, Grajda A, Ismail MN, Krzyżaniak A, Heshmat R, Stratev V, Różdżyńska-Świątkowska A, Ardalan G, Qorbani M, Świąder-Leśniak A, Ostrowska-Nawarycz L, Yotov Y, Ekbote V, Khadilkar V, Venn AJ, Dwyer T, Zhao M, Magnussen CG, Bovet P. International Waist Circumference Percentile Cutoffs for Central Obesity in Children and Adolescents Aged 6 to 18 Years. J Clin Endocrinol Metab. 2020;105:e1569-e1583. [RCA] [PubMed] [DOI] [Full Text] [Cited by in Crossref: 41] [Cited by in RCA: 93] [Article Influence: 18.6] [Reference Citation Analysis (0)] |
| 15. | Sharma AK, Metzger DL, Daymont C, Hadjiyannakis S, Rodd CJ. LMS tables for waist-circumference and waist-height ratio Z-scores in children aged 5-19 y in NHANES III: association with cardio-metabolic risks. Pediatr Res. 2015;78:723-729. [RCA] [PubMed] [DOI] [Full Text] [Cited by in Crossref: 103] [Cited by in RCA: 151] [Article Influence: 15.1] [Reference Citation Analysis (0)] |
| 16. | Dundar C, Terzi O, Arslan HN. Comparison of the ability of HOMA-IR, VAI, and TyG indexes to predict metabolic syndrome in children with obesity: a cross-sectional study. BMC Pediatr. 2023;23:74. [RCA] [PubMed] [DOI] [Full Text] [Cited by in Crossref: 5] [Reference Citation Analysis (0)] |
| 17. | Dong Y, Bai L, Cai R, Zhou J, Ding W. Visceral adiposity index performed better than traditional adiposity indicators in predicting unhealthy metabolic phenotype among Chinese children and adolescents. Sci Rep. 2021;11:23850. [RCA] [PubMed] [DOI] [Full Text] [Full Text (PDF)] [Cited by in Crossref: 1] [Cited by in RCA: 20] [Article Influence: 5.0] [Reference Citation Analysis (0)] |
| 18. | Calcaterra V, Verduci E, Schneider L, Cena H, De Silvestri A, Vizzuso S, Vinci F, Mameli C, Zuccotti G. Sex-Specific Differences in the Relationship between Insulin Resistance and Adiposity Indexes in Children and Adolescents with Obesity. Children (Basel). 2021;8. [RCA] [PubMed] [DOI] [Full Text] [Full Text (PDF)] [Cited by in Crossref: 2] [Cited by in RCA: 12] [Article Influence: 3.0] [Reference Citation Analysis (0)] |
| 19. | Vizzuso S, Del Torto A, Dilillo D, Calcaterra V, Di Profio E, Leone A, Gilardini L, Bertoli S, Battezzati A, Zuccotti GV, Verduci E. Visceral Adiposity Index (VAI) in Children and Adolescents with Obesity: No Association with Daily Energy Intake but Promising Tool to Identify Metabolic Syndrome (MetS). Nutrients. 2021;13. [RCA] [PubMed] [DOI] [Full Text] [Full Text (PDF)] [Cited by in Crossref: 44] [Cited by in RCA: 46] [Article Influence: 11.5] [Reference Citation Analysis (0)] |
| 20. | Misu H. Pathophysiological significance of hepatokine overproduction in type 2 diabetes. Diabetol Int. 2018;9:224-233. [RCA] [PubMed] [DOI] [Full Text] [Cited by in Crossref: 9] [Cited by in RCA: 5] [Article Influence: 0.7] [Reference Citation Analysis (0)] |
| 21. | Steinbrenner H, Duntas LH, Rayman MP. The role of selenium in type-2 diabetes mellitus and its metabolic comorbidities. Redox Biol. 2022;50:102236. [RCA] [PubMed] [DOI] [Full Text] [Full Text (PDF)] [Cited by in Crossref: 14] [Cited by in RCA: 118] [Article Influence: 39.3] [Reference Citation Analysis (1)] |
| 22. | Chen Y, He X, Chen X, Li Y, Ke Y. SeP is elevated in NAFLD and participates in NAFLD pathogenesis through AMPK/ACC pathway. J Cell Physiol. 2021;236:3800-3807. [RCA] [PubMed] [DOI] [Full Text] [Cited by in Crossref: 24] [Cited by in RCA: 30] [Article Influence: 7.5] [Reference Citation Analysis (0)] |
| 23. | Day K, Seale LA, Graham RM, Cardoso BR. Selenotranscriptome Network in Non-alcoholic Fatty Liver Disease. Front Nutr. 2021;8:744825. [RCA] [PubMed] [DOI] [Full Text] [Full Text (PDF)] [Cited by in Crossref: 6] [Cited by in RCA: 26] [Article Influence: 6.5] [Reference Citation Analysis (0)] |
| 24. | López-Peralta S, Romero-Velarde E, Vásquez-Garibay EM, González-Hita M, Robles-Robles LC, Ruiz-González FJ, Pérez-Romero MA. Bone mineral density and body composition in normal weight, overweight and obese children. BMC Pediatr. 2022;22:249. [RCA] [PubMed] [DOI] [Full Text] [Full Text (PDF)] [Cited by in RCA: 19] [Reference Citation Analysis (0)] |
| 25. | Estébanez B, Huang CJ, Rivera-Viloria M, González-Gallego J, Cuevas MJ. Exercise Outcomes in Childhood Obesity-Related Inflammation and Oxidative Status. Front Nutr. 2022;9:886291. [RCA] [PubMed] [DOI] [Full Text] [Full Text (PDF)] [Cited by in Crossref: 1] [Cited by in RCA: 4] [Article Influence: 1.3] [Reference Citation Analysis (0)] |
| 26. | Zhang Y, Chen X. Reducing selenoprotein P expression suppresses adipocyte differentiation as a result of increased preadipocyte inflammation. Am J Physiol Endocrinol Metab. 2011;300:E77-E85. [RCA] [PubMed] [DOI] [Full Text] [Cited by in Crossref: 65] [Cited by in RCA: 63] [Article Influence: 4.5] [Reference Citation Analysis (0)] |
| 27. | Ko BJ, Kim SM, Park KH, Park HS, Mantzoros CS. Levels of circulating selenoprotein P, fibroblast growth factor (FGF) 21 and FGF23 in relation to the metabolic syndrome in young children. Int J Obes (Lond). 2014;38:1497-1502. [PubMed] [DOI] [Full Text] |
| 28. | Gharipour M, Sadeghi M, Salehi M, Behmanesh M, Khosravi E, Dianatkhah M, Haghjoo Javanmard S, Razavi R, Gharipour A. Association of expression of selenoprotein P in mRNA and protein levels with metabolic syndrome in subjects with cardiovascular disease: Results of the Selenegene study. J Gene Med. 2017;19. [RCA] [PubMed] [DOI] [Full Text] [Cited by in Crossref: 18] [Cited by in RCA: 23] [Article Influence: 3.3] [Reference Citation Analysis (0)] |
| 29. | di Giuseppe R, Koch M, Schlesinger S, Borggrefe J, Both M, Müller HP, Kassubek J, Jacobs G, Nöthlings U, Lieb W. Circulating selenoprotein P levels in relation to MRI-derived body fat volumes, liver fat content, and metabolic disorders. Obesity (Silver Spring). 2017;25:1128-1135. [RCA] [PubMed] [DOI] [Full Text] [Cited by in Crossref: 17] [Cited by in RCA: 22] [Article Influence: 2.8] [Reference Citation Analysis (0)] |
| 30. | Chen M, Liu B, Wilkinson D, Hutchison AT, Thompson CH, Wittert GA, Heilbronn LK. Selenoprotein P is elevated in individuals with obesity, but is not independently associated with insulin resistance. Obes Res Clin Pract. 2017;11:227-232. [RCA] [PubMed] [DOI] [Full Text] [Cited by in Crossref: 22] [Cited by in RCA: 25] [Article Influence: 3.1] [Reference Citation Analysis (0)] |
| 31. | El-Kafrawy NAF, Atta AEM, Abdelsattar S, Zewain SKED. Serum selenoprotein P in lean and obese Egyptian individuals and its relation to insulin resistance. Alex J Med. 2021;57:61-69. [RCA] [DOI] [Full Text] [Cited by in Crossref: 1] [Cited by in RCA: 1] [Article Influence: 0.3] [Reference Citation Analysis (0)] |
| 32. | Yu R, Wang Z, Ma M, Xu P, Liu L, Tinkov AA, Lei XG, Zhou JC. Associations between Circulating SELENOP Level and Disorders of Glucose and Lipid Metabolism: A Meta-Analysis. Antioxidants (Basel). 2022;11. [RCA] [PubMed] [DOI] [Full Text] [Full Text (PDF)] [Cited by in Crossref: 16] [Cited by in RCA: 18] [Article Influence: 6.0] [Reference Citation Analysis (0)] |
| 33. | Amirkhizi F, Khalese-Ranjbar B, Mansouri E, Hamedi-Shahraki S, Asghari S. Correlations of selenium and selenoprotein P with asymmetric dimethylarginine and lipid profile in patients with polycystic ovary syndrome. J Trace Elem Med Biol. 2023;75:127101. [RCA] [PubMed] [DOI] [Full Text] [Cited by in Crossref: 1] [Cited by in RCA: 5] [Article Influence: 2.5] [Reference Citation Analysis (0)] |
| 34. | Misu H, Takamura T, Takayama H, Hayashi H, Matsuzawa-Nagata N, Kurita S, Ishikura K, Ando H, Takeshita Y, Ota T, Sakurai M, Yamashita T, Mizukoshi E, Yamashita T, Honda M, Miyamoto K, Kubota T, Kubota N, Kadowaki T, Kim HJ, Lee IK, Minokoshi Y, Saito Y, Takahashi K, Yamada Y, Takakura N, Kaneko S. A liver-derived secretory protein, selenoprotein P, causes insulin resistance. Cell Metab. 2010;12:483-495. [RCA] [PubMed] [DOI] [Full Text] [Cited by in Crossref: 474] [Cited by in RCA: 432] [Article Influence: 28.8] [Reference Citation Analysis (0)] |
| 35. | Wondmkun YT. Obesity, Insulin Resistance, and Type 2 Diabetes: Associations and Therapeutic Implications. Diabetes Metab Syndr Obes. 2020;13:3611-3616. [RCA] [PubMed] [DOI] [Full Text] [Full Text (PDF)] [Cited by in Crossref: 115] [Cited by in RCA: 372] [Article Influence: 74.4] [Reference Citation Analysis (0)] |
| 36. | Cavedon E, Manso J, Negro I, Censi S, Serra R, Busetto L, Vettor R, Plebani M, Pezzani R, Nacamulli D, Mian C. Selenium Supplementation, Body Mass Composition, and Leptin Levels in Patients with Obesity on a Balanced Mildly Hypocaloric Diet: A Pilot Study. Int J Endocrinol. 2020;2020:4802739. [RCA] [PubMed] [DOI] [Full Text] [Full Text (PDF)] [Cited by in Crossref: 18] [Cited by in RCA: 30] [Article Influence: 6.0] [Reference Citation Analysis (0)] |
| 37. | Matoušková P, Hanousková B, Skálová L. MicroRNAs as Potential Regulators of Glutathione Peroxidases Expression and Their Role in Obesity and Related Pathologies. Int J Mol Sci. 2018;19. [RCA] [PubMed] [DOI] [Full Text] [Full Text (PDF)] [Cited by in Crossref: 26] [Cited by in RCA: 48] [Article Influence: 6.9] [Reference Citation Analysis (0)] |
| 38. | Hosseini B, Saedisomeolia A, Allman-Farinelli M. Association Between Antioxidant Intake/Status and Obesity: a Systematic Review of Observational Studies. Biol Trace Elem Res. 2017;175:287-297. [RCA] [PubMed] [DOI] [Full Text] [Cited by in Crossref: 67] [Cited by in RCA: 74] [Article Influence: 9.3] [Reference Citation Analysis (0)] |
| 39. | Bellinger FP, Raman AV, Reeves MA, Berry MJ. Regulation and function of selenoproteins in human disease. Biochem J. 2009;422:11-22. [RCA] [PubMed] [DOI] [Full Text] [Full Text (PDF)] [Cited by in Crossref: 307] [Cited by in RCA: 273] [Article Influence: 17.1] [Reference Citation Analysis (0)] |
| 40. | Steinbrenner H. Interference of selenium and selenoproteins with the insulin-regulated carbohydrate and lipid metabolism. Free Radic Biol Med. 2013;65:1538-1547. [RCA] [PubMed] [DOI] [Full Text] [Cited by in Crossref: 109] [Cited by in RCA: 130] [Article Influence: 10.8] [Reference Citation Analysis (0)] |
| 41. | Takeshita Y, Tanaka T, Takayama H, Kita Y, Goto H, Nakano Y, Saito Y, Takamura T. Circulating selenoprotein P levels predict glucose-lowering and insulinotropic effects of metformin, but not alogliptin: A post-hoc analysis. J Diabetes Investig. 2023;14:230-235. [RCA] [PubMed] [DOI] [Full Text] [Full Text (PDF)] [Cited by in Crossref: 1] [Reference Citation Analysis (0)] |