Copyright
©The Author(s) 2024.
World J Clin Pediatr. Dec 9, 2024; 13(4): 98472
Published online Dec 9, 2024. doi: 10.5409/wjcp.v13.i4.98472
Published online Dec 9, 2024. doi: 10.5409/wjcp.v13.i4.98472
Figure 1 Graphs of influential diagnostic measures.
A: Detection using Cook’s distance method; B: Detection using leverage method; C: Detection using covariance ratio method; D: Detection using modified Cook’s distance method; E: Detection using Andrew’s Pregibon method; F: Detection using Walsh’s distance method.
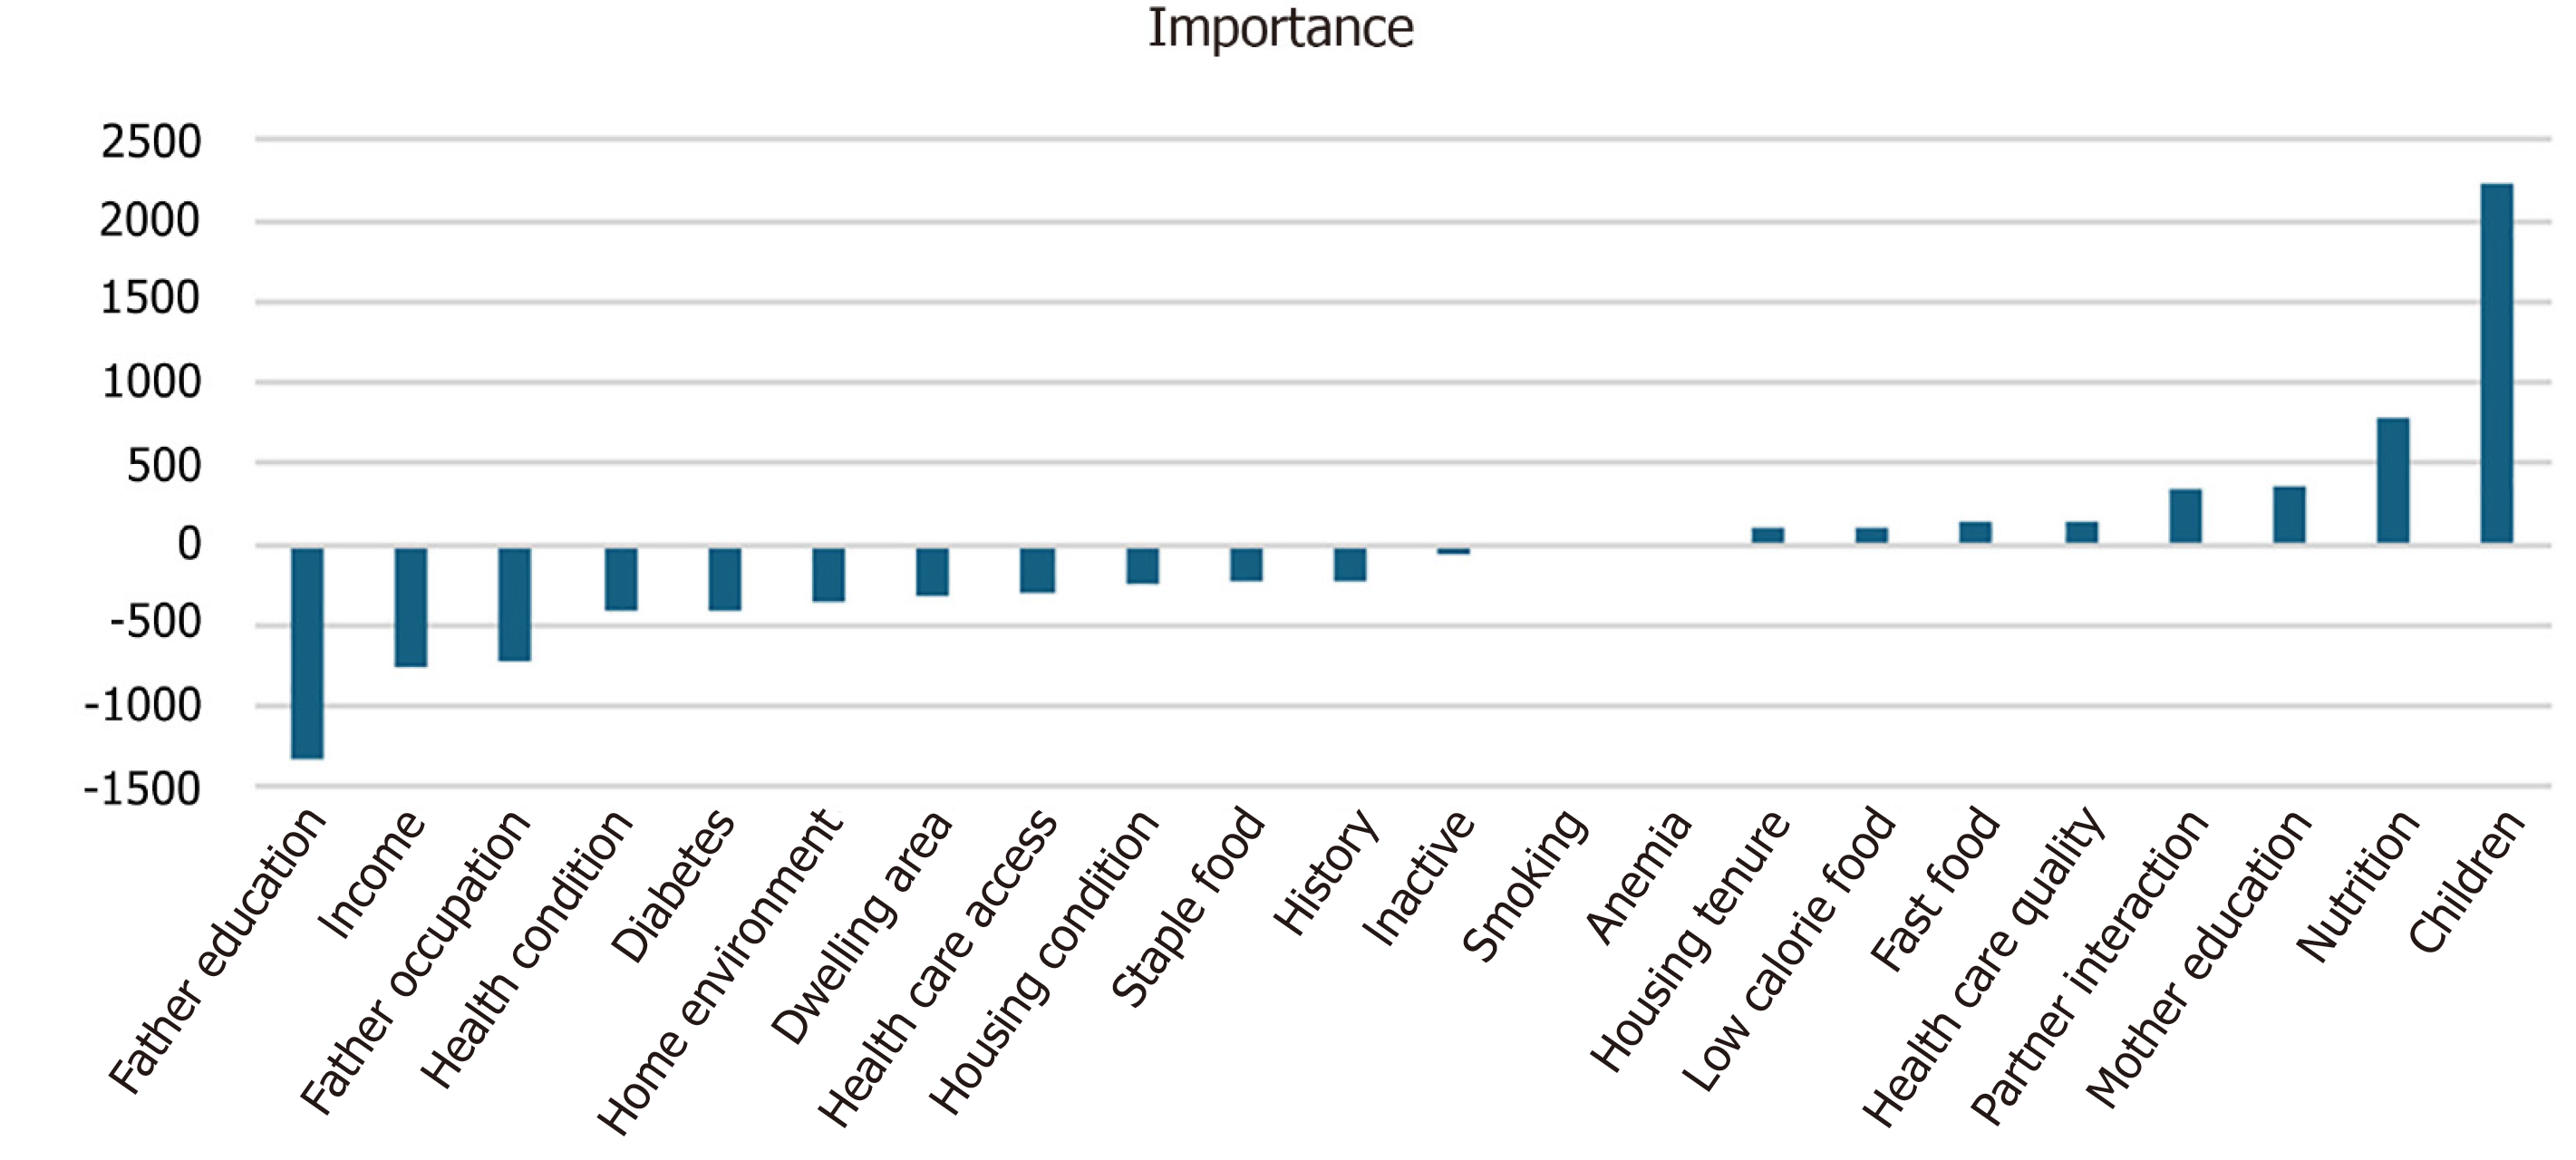
Figure 2 Weights according to importance of variables by artificial neural network.
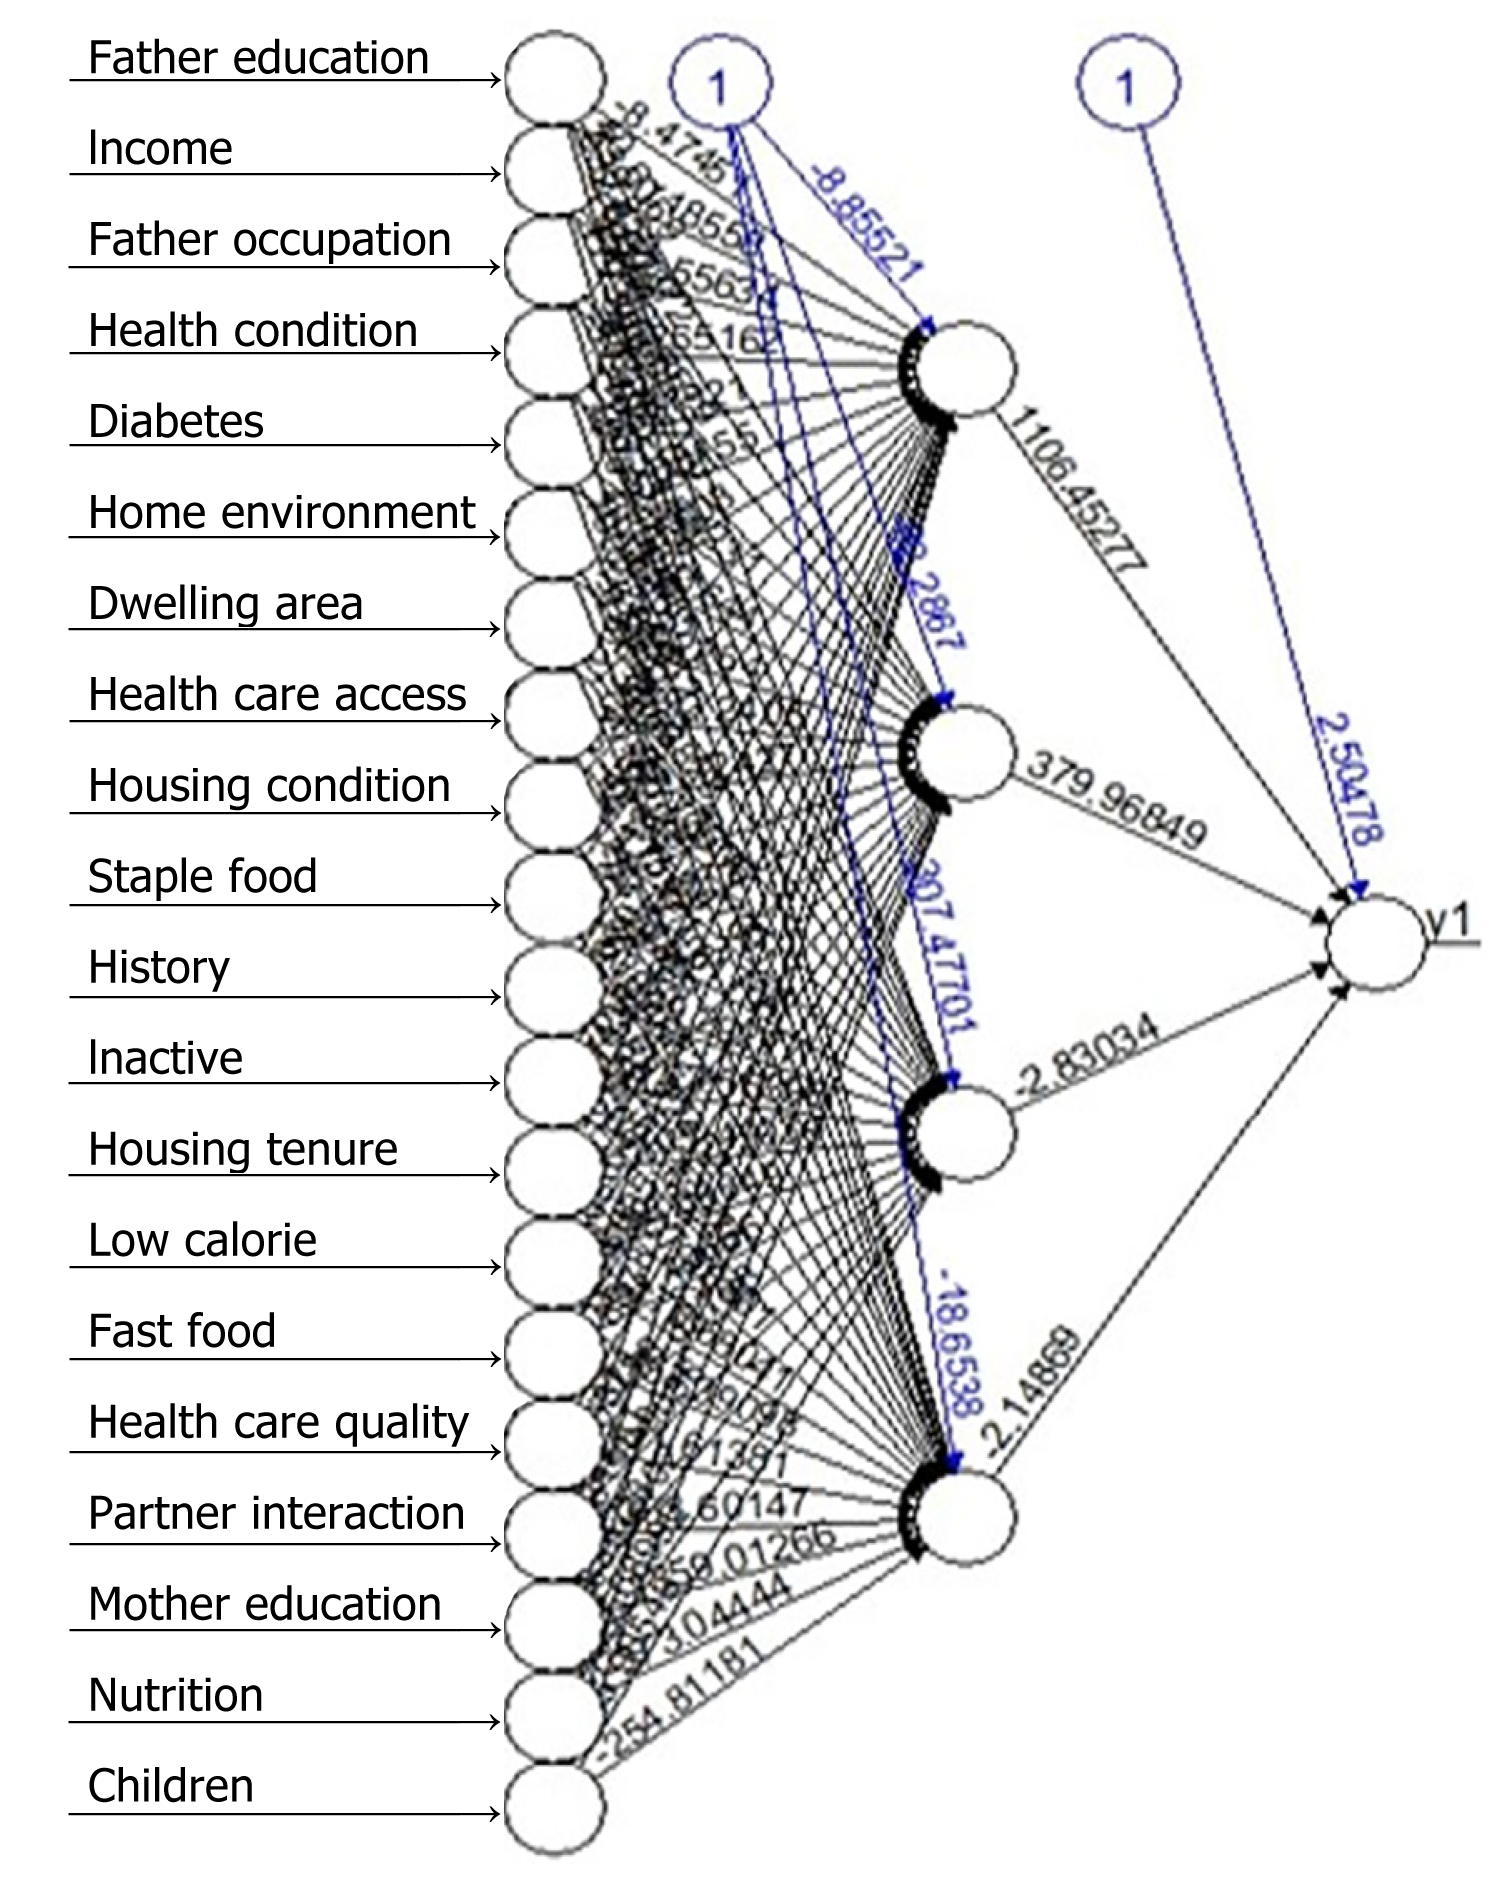
Figure 3 Modeling structure of artificial neural network with weights of each node.
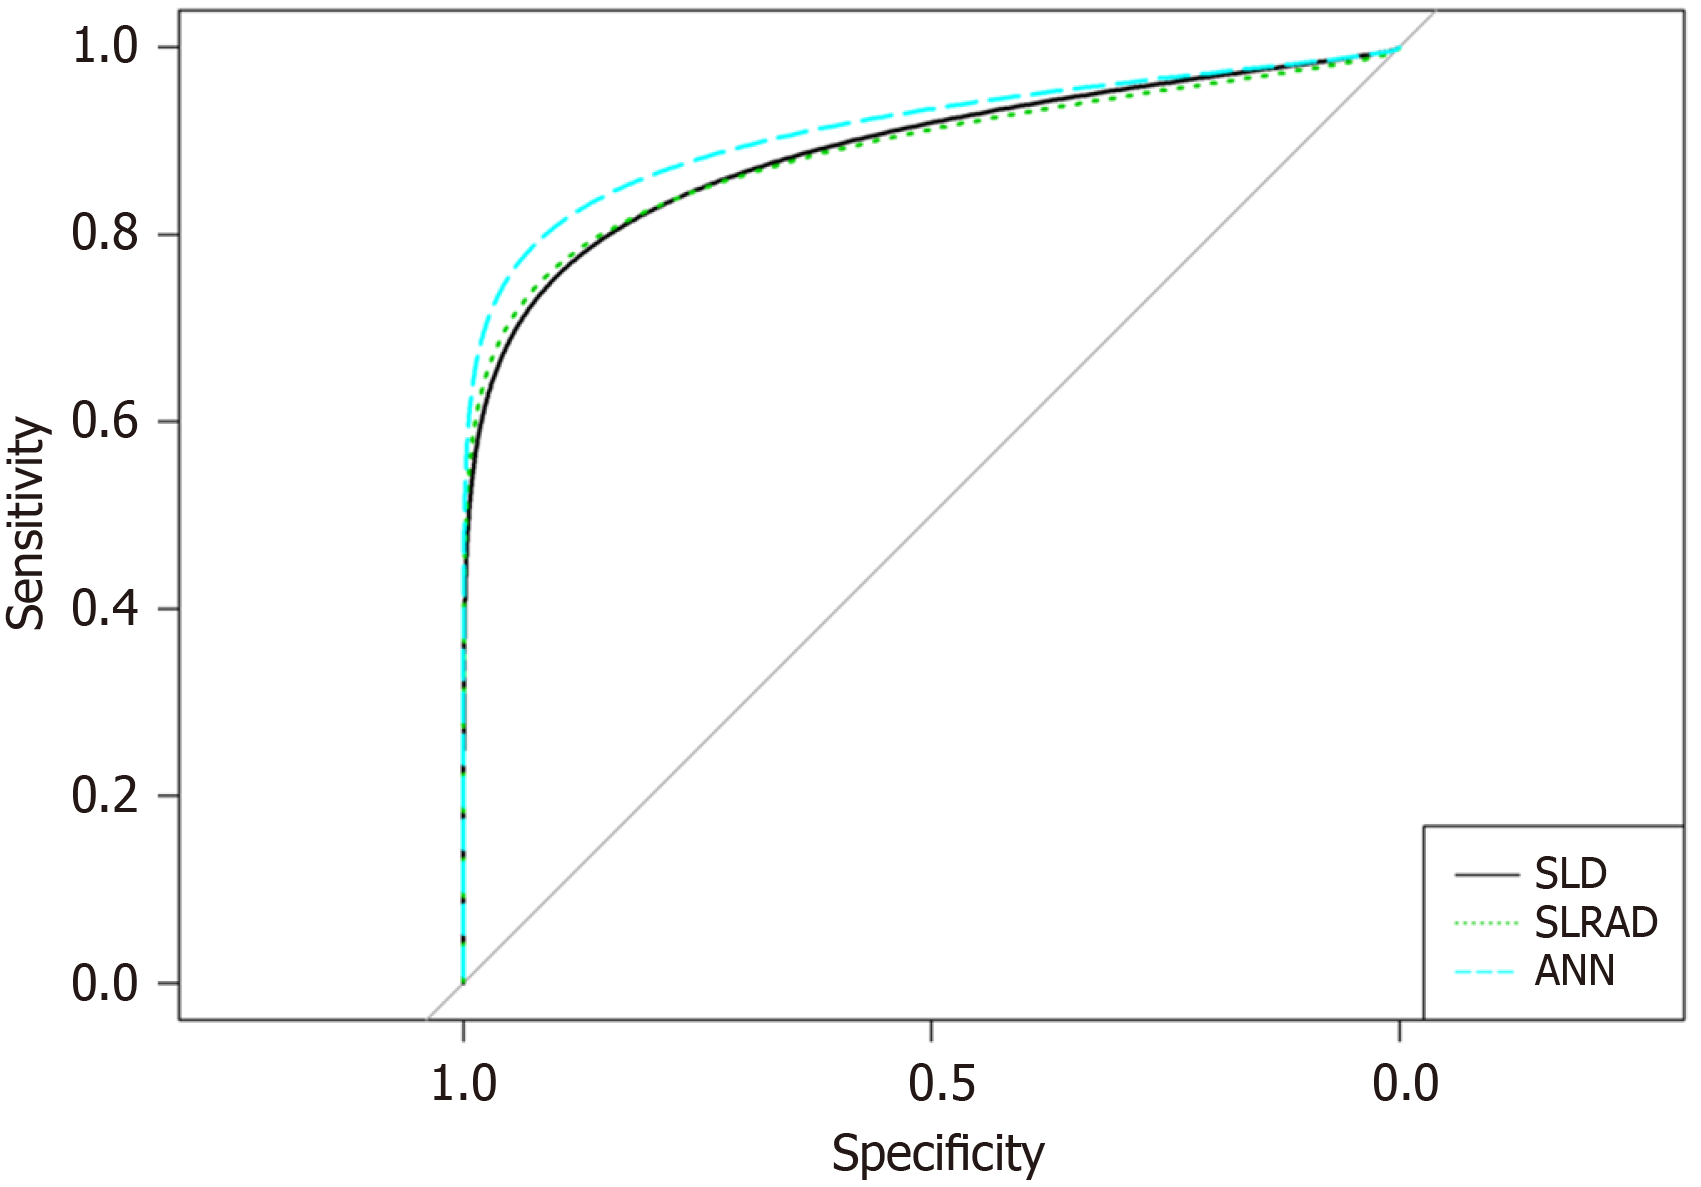
Figure 4 Receiver operating characteristic curves for comparison of subset logistic regression, subset logistic regression after deletion, and artificial neural network model.
SLR: Subset logistic regression; SLRAD: Subset logistic regression after deletion; ANN: Artificial neural network.
- Citation: Shahid S, Khurram H, Lim A, Shabbir MF, Billah B. Prediction of cyanotic and acyanotic congenital heart disease using machine learning models. World J Clin Pediatr 2024; 13(4): 98472
- URL: https://www.wjgnet.com/2219-2808/full/v13/i4/98472.htm
- DOI: https://dx.doi.org/10.5409/wjcp.v13.i4.98472


