Copyright
©The Author(s) 2024.
World J Clin Pediatr. Sep 9, 2024; 13(3): 96018
Published online Sep 9, 2024. doi: 10.5409/wjcp.v13.i3.96018
Published online Sep 9, 2024. doi: 10.5409/wjcp.v13.i3.96018
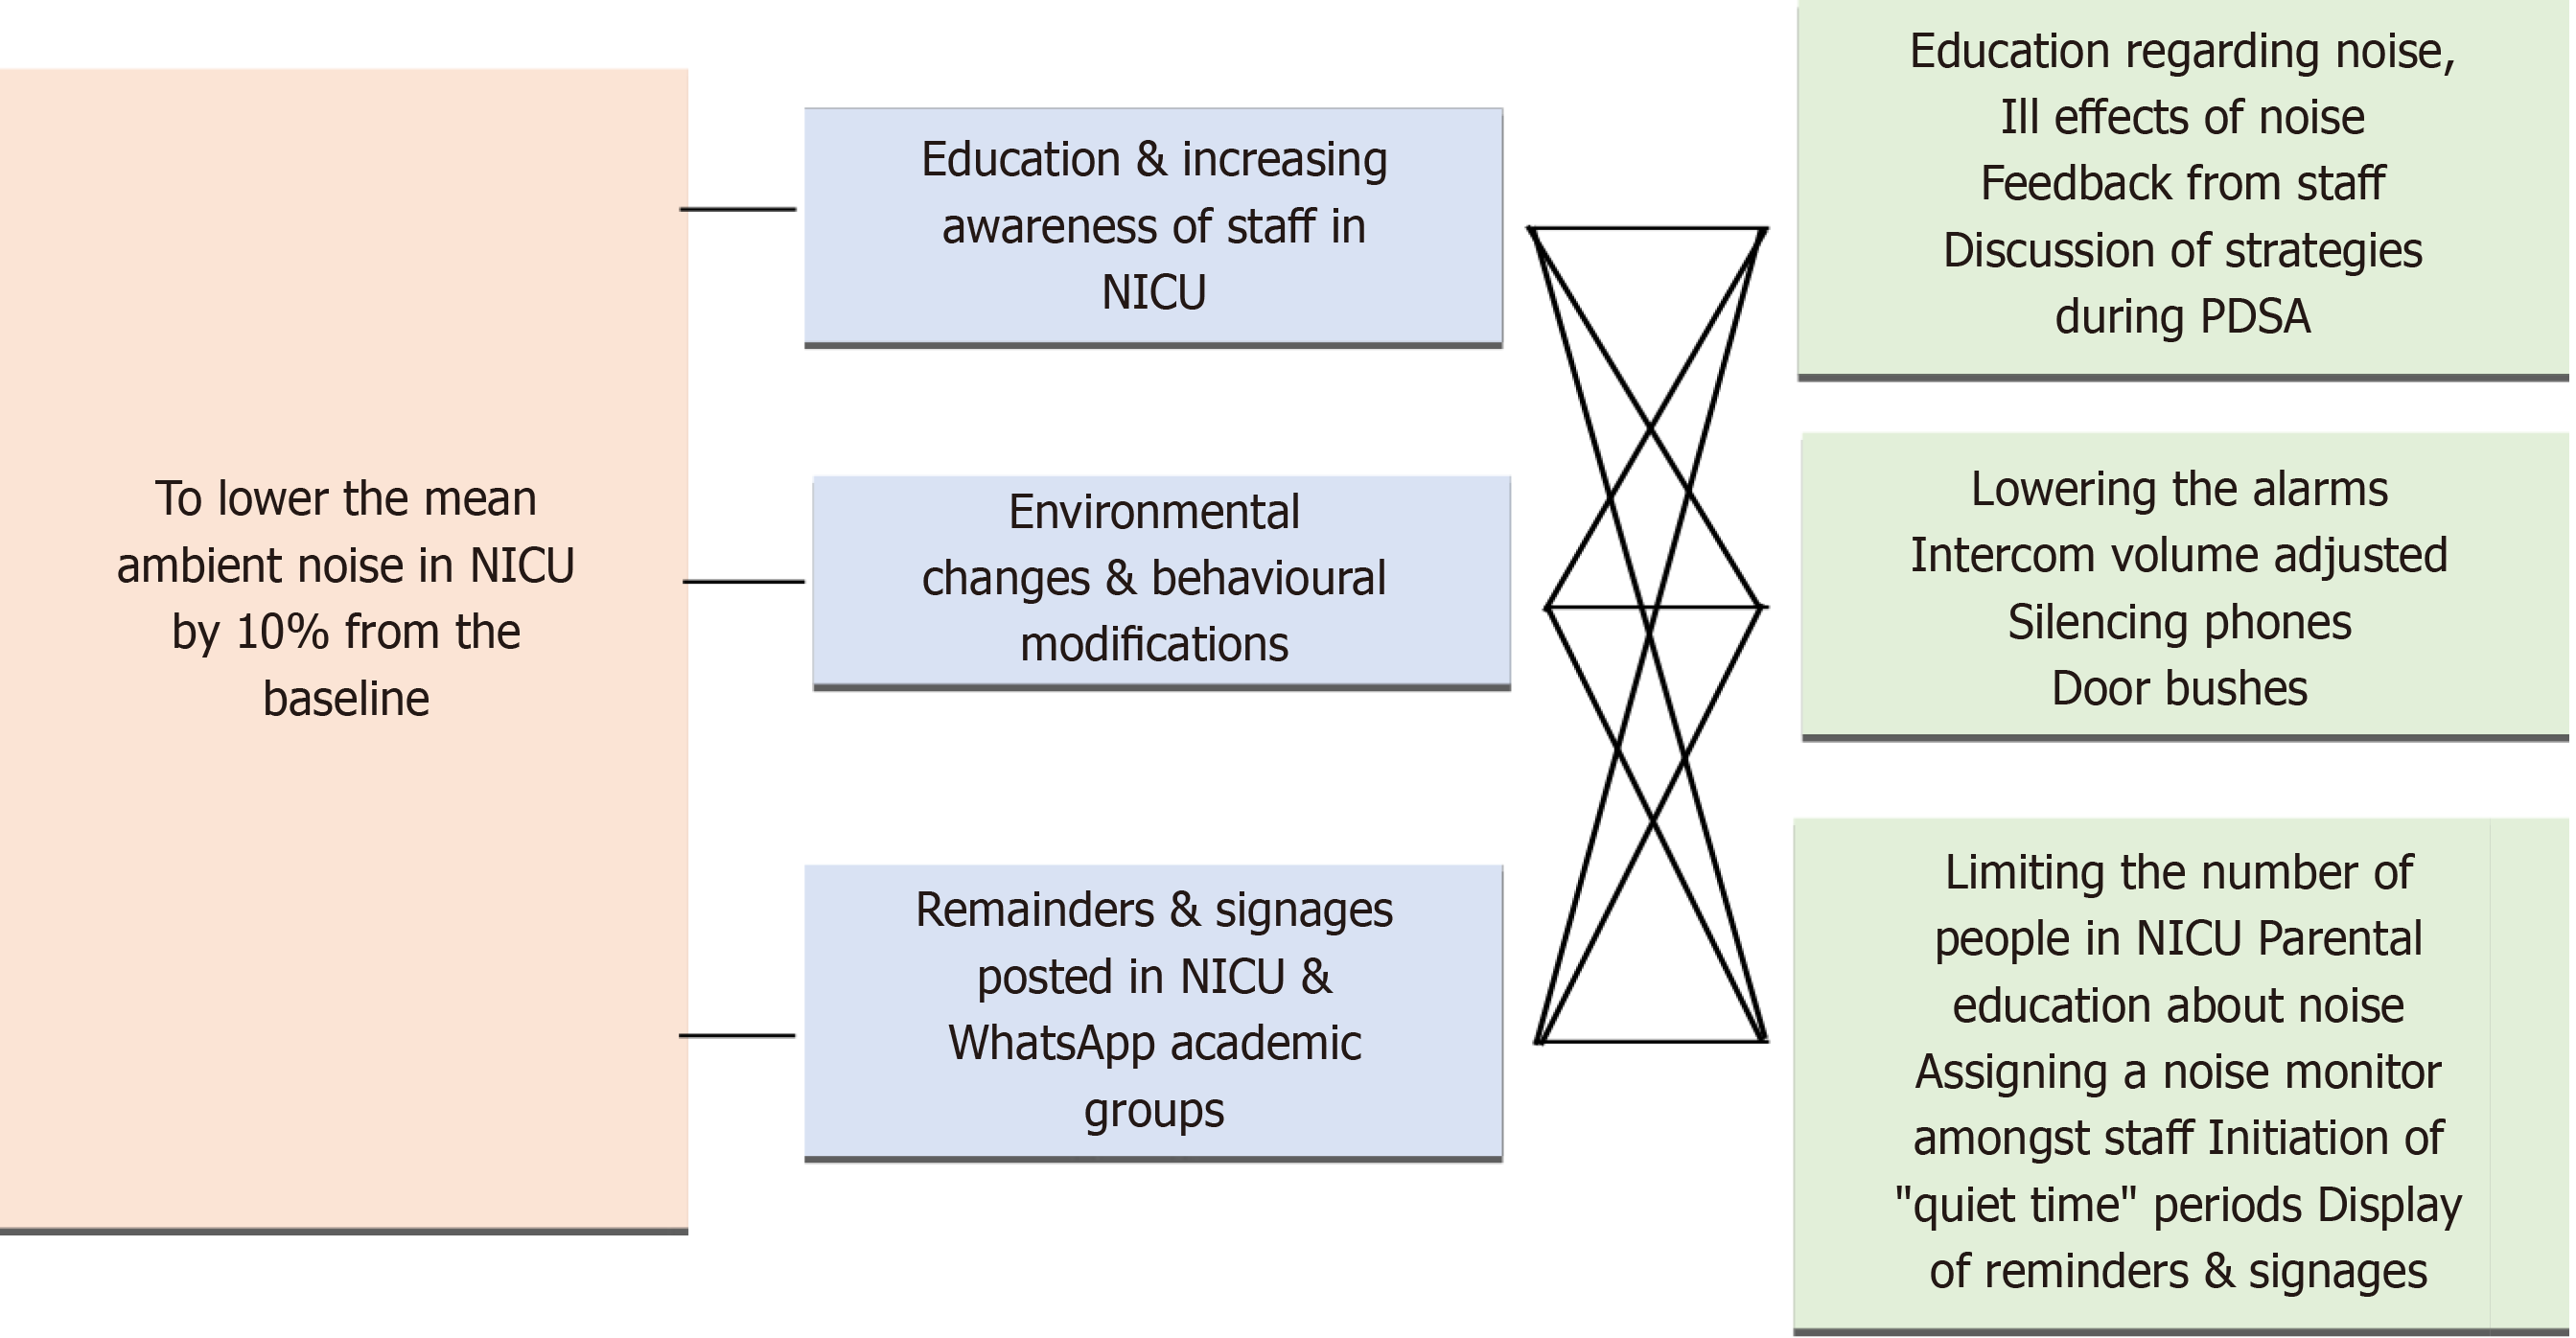
Figure 1 Key driver diagram.
NICU: Neonatal intensive care unit; PDSA: Plan-Do-Study-Act.
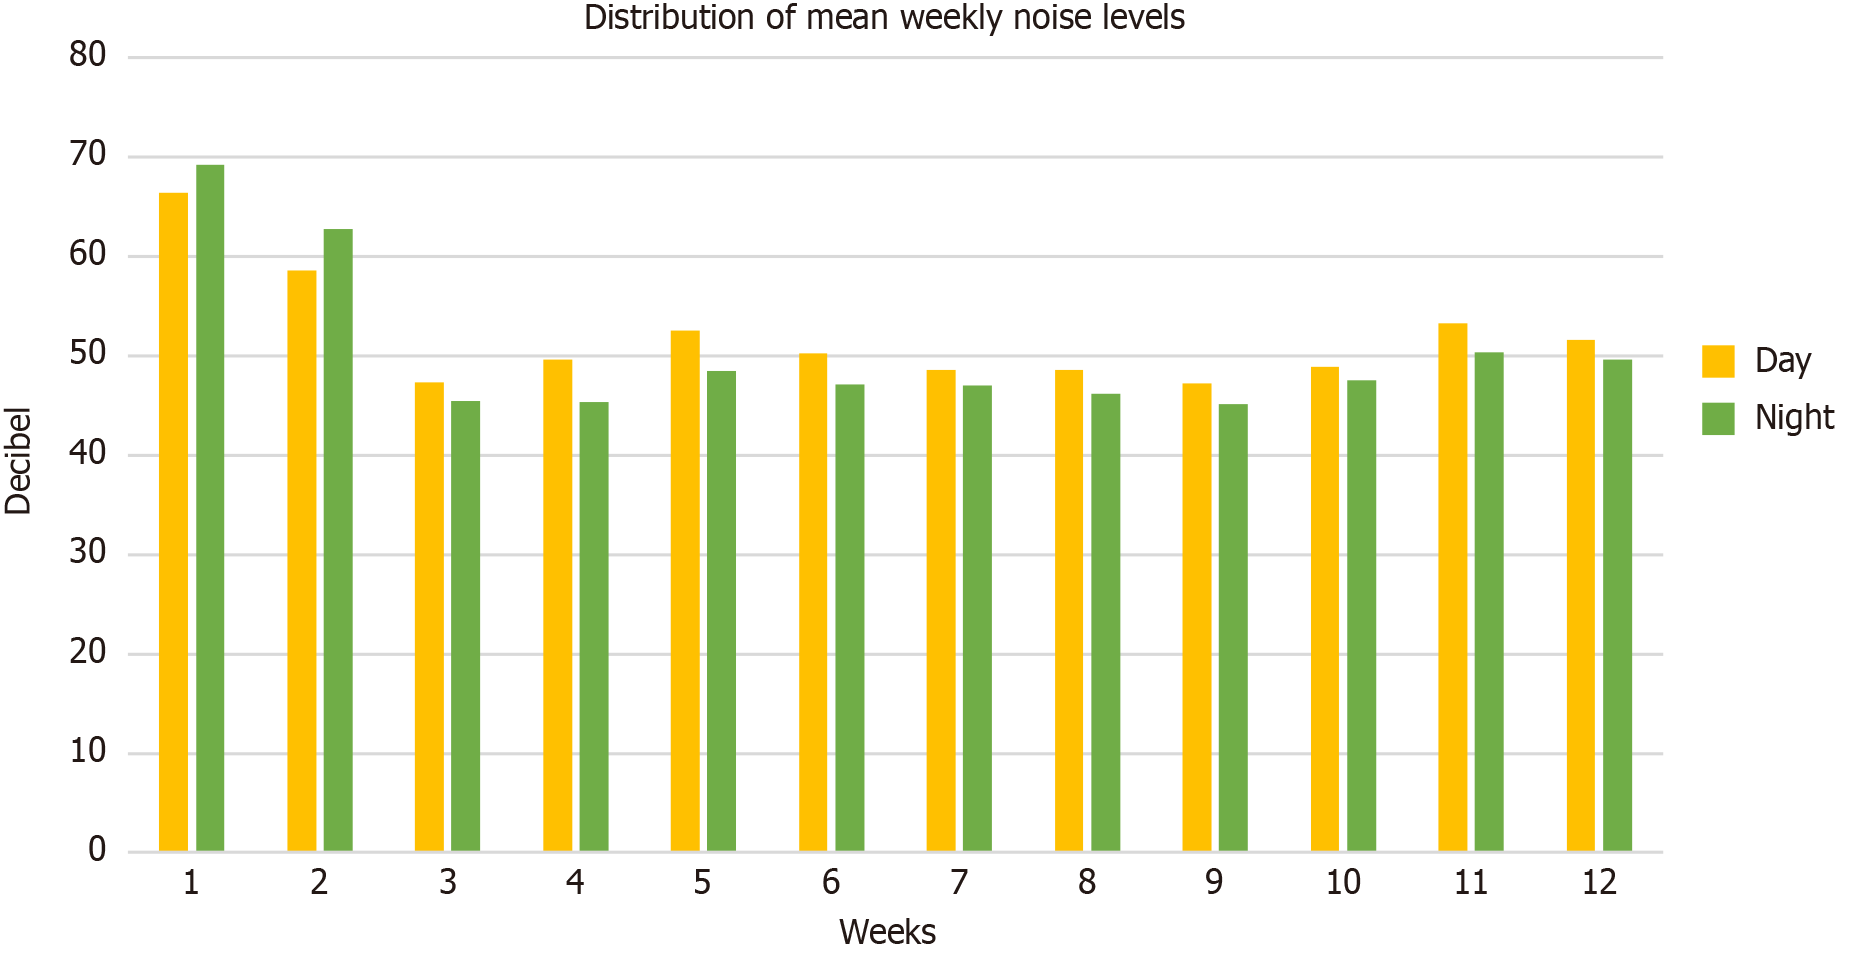
Figure 2 Hourly average noise level during the day and at night.
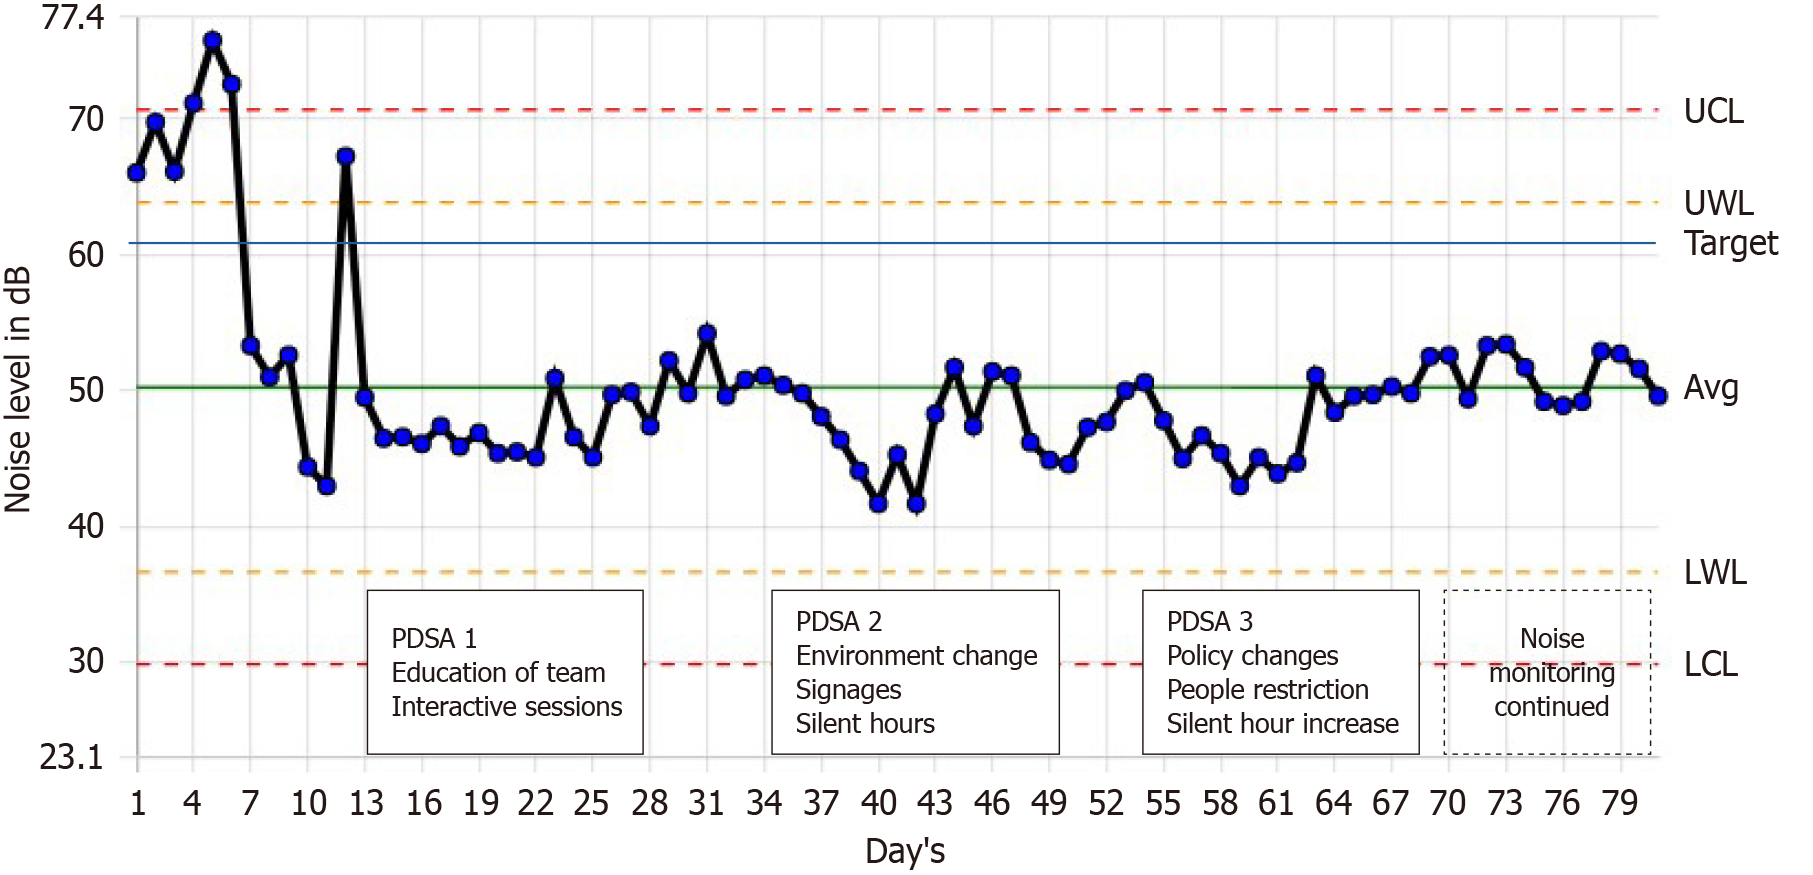
Figure 3 Control chart of the daily average ambient noise level.
Avg: Average; dB: Decibel; LCL: Lower control limit; LWL: Lower warning limit; PDSA: Plan-Do-Study-Act; UCL: Upper control limit; UWL: Upper warning limit.
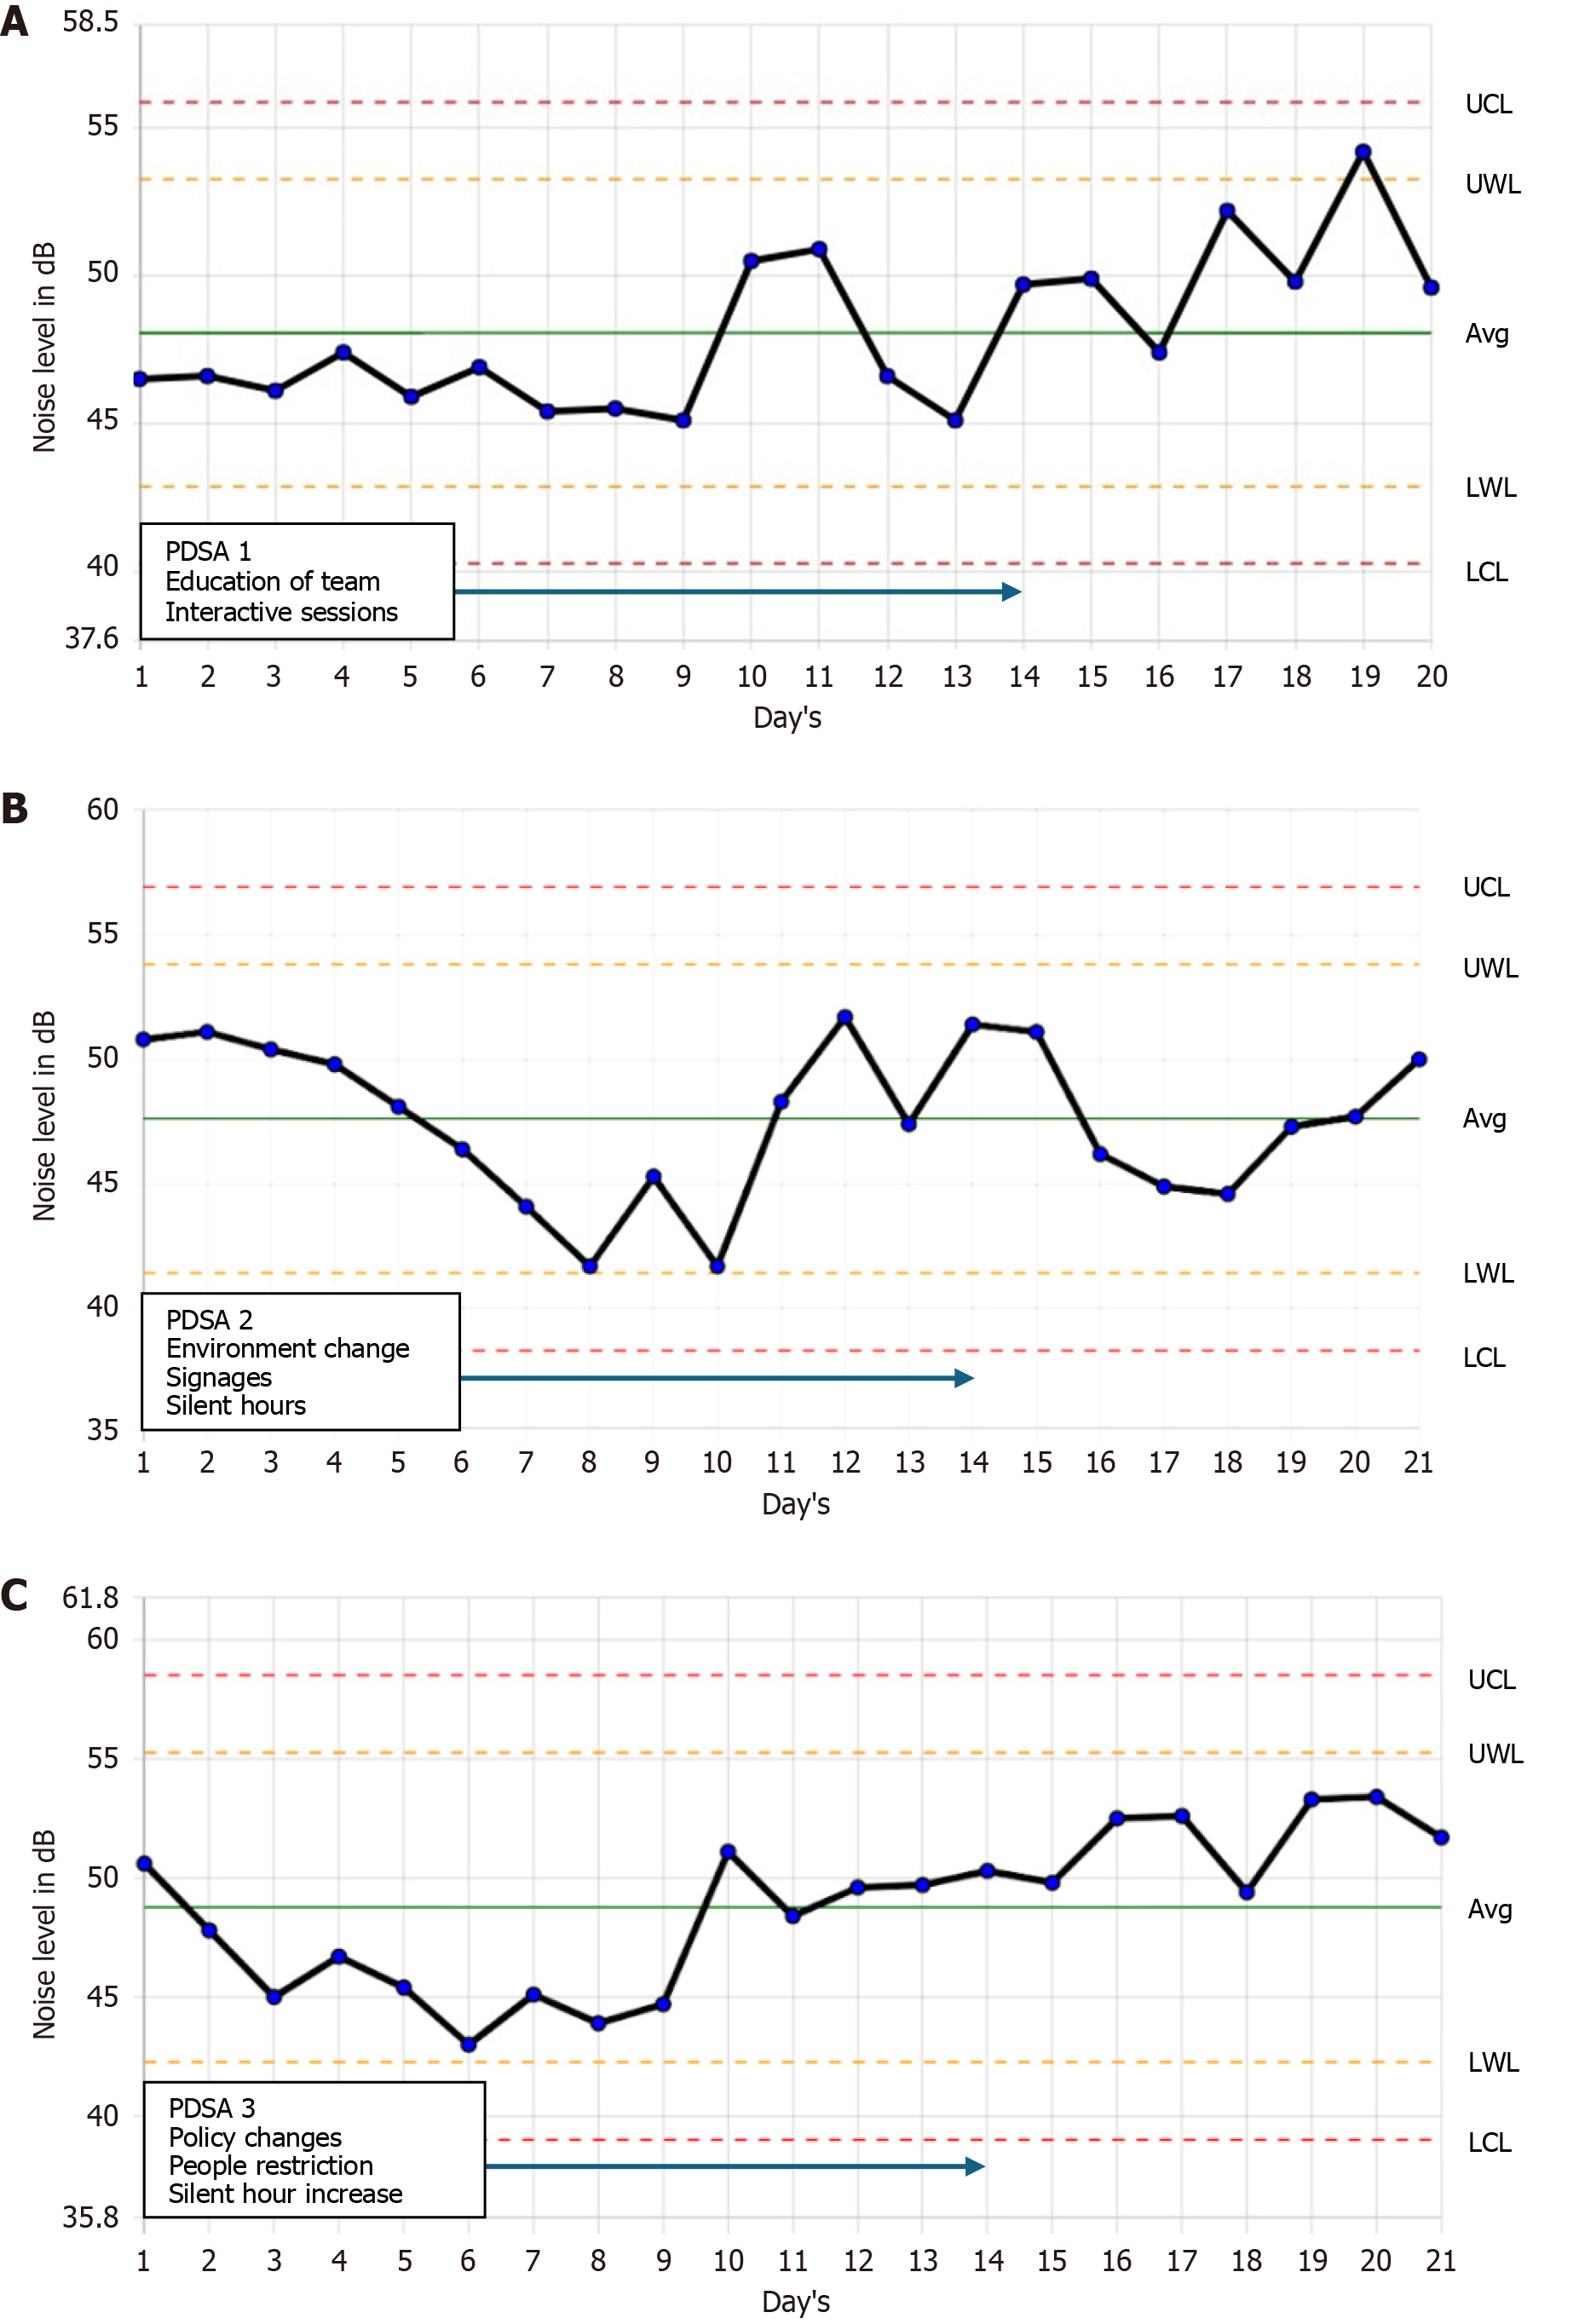
Figure 4 Control chart of the daily average ambient noise level.
A: Plan-Do-Study-Act (PDSA) cycle 1; B: PDSA cycle 2; C: PDSA cycle 3. Avg: Average; dB: Decibel; LCL: Lower control limit; LWL: Lower warning limit; UCL: Upper control limit; UWL: Upper warning limit.
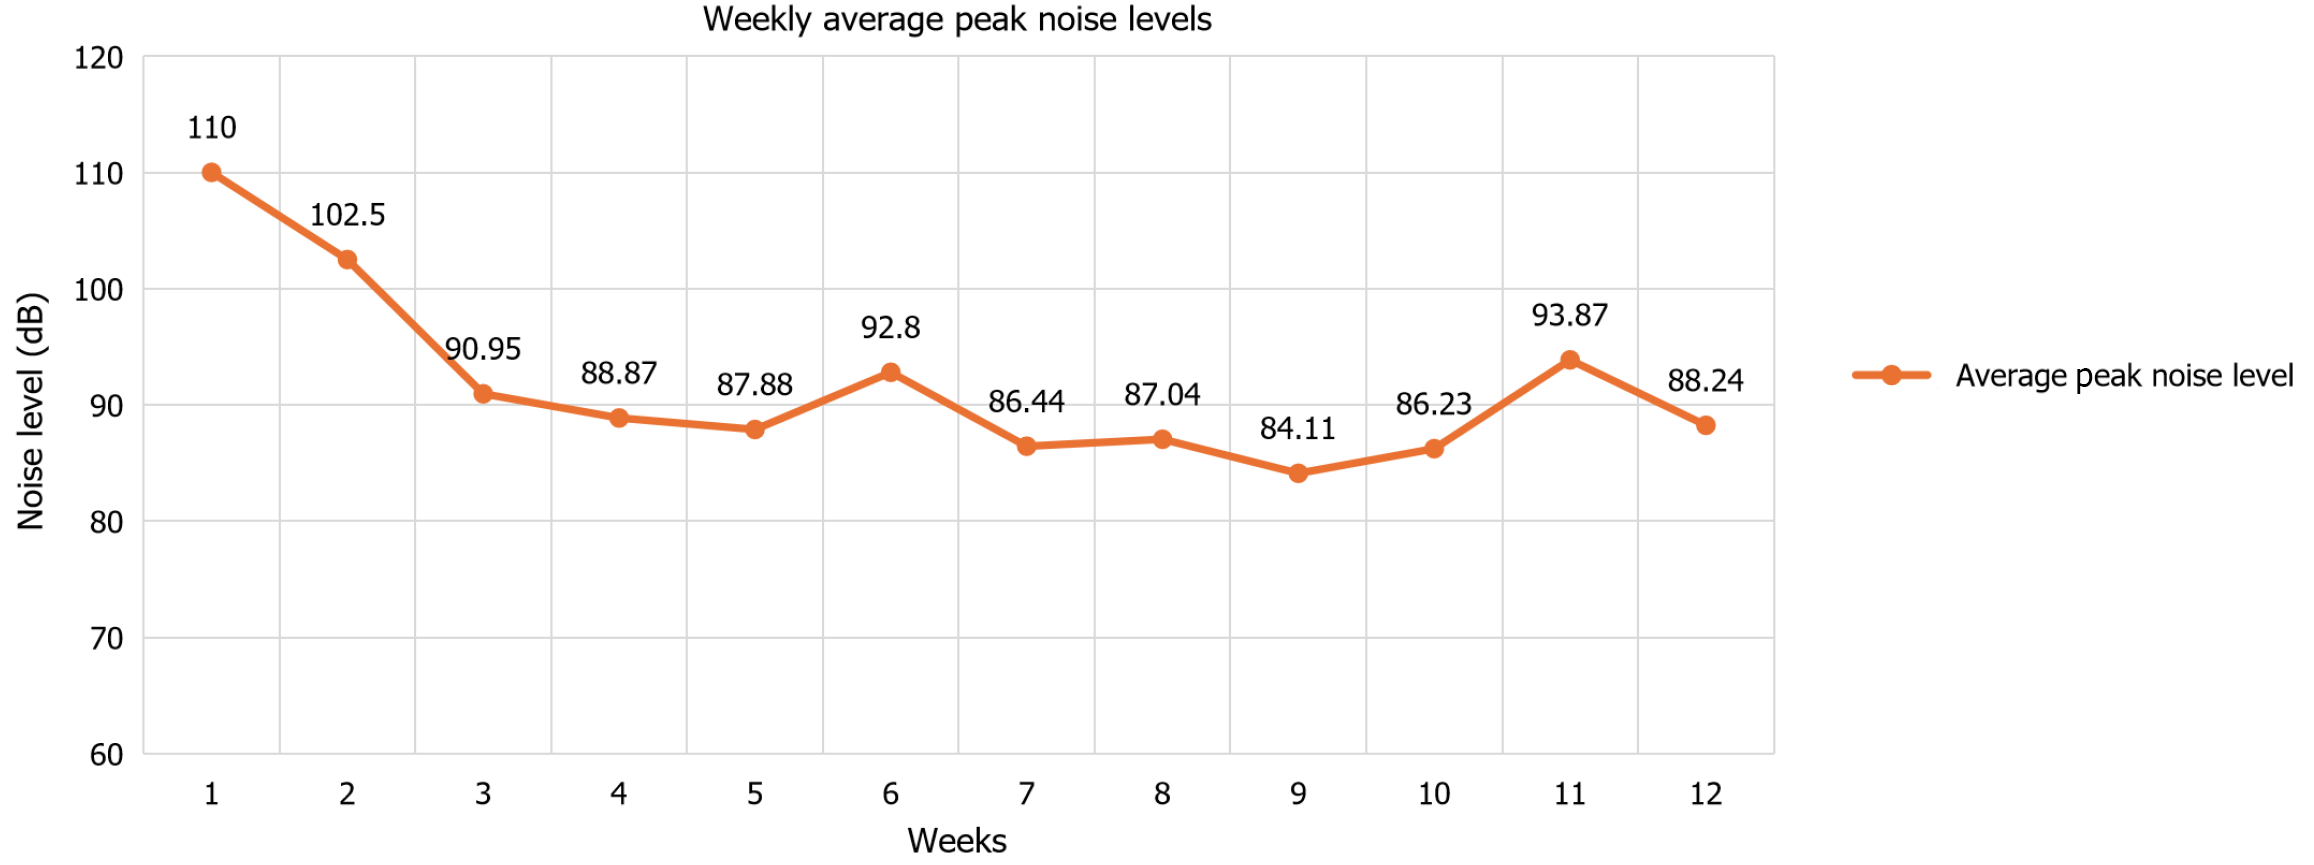
Figure 5 Run chart of weekly average peak noise level.
- Citation: Rangaswamy DR, Kamble N, Veeramachaneni A. Quieting the neonatal intensive care unit: A quality improvement initiative. World J Clin Pediatr 2024; 13(3): 96018
- URL: https://www.wjgnet.com/2219-2808/full/v13/i3/96018.htm
- DOI: https://dx.doi.org/10.5409/wjcp.v13.i3.96018


