Copyright
©The Author(s) 2023.
World J Clin Pediatr. Mar 9, 2023; 12(2): 25-37
Published online Mar 9, 2023. doi: 10.5409/wjcp.v12.i2.25
Published online Mar 9, 2023. doi: 10.5409/wjcp.v12.i2.25
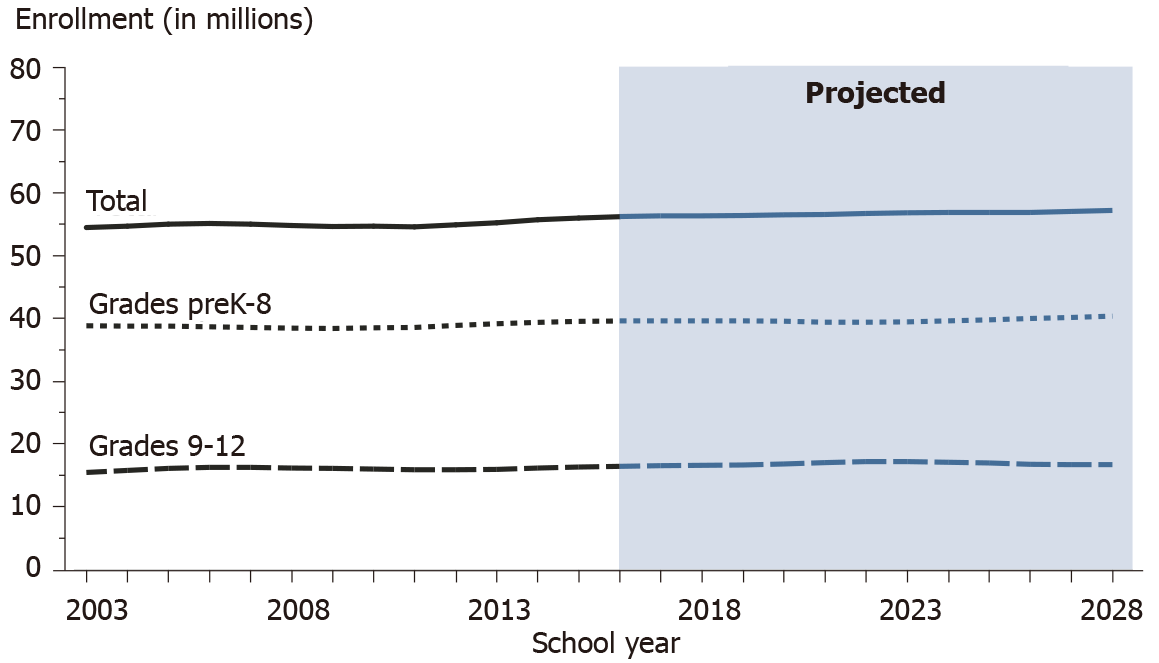
Figure 1 Actual and projected numbers for enrollment in elementary and secondary schools, by grade level: Fall 2003 through fall 2028.
Pre-K: Pre-kindergarten. Citation: Hussar WJ, Bailey TM. Projections of education statistics to 2028. Washington: National Center for Education Statistics. Copyright © U.S. Department of Education 2020. Published by National Center for Education Statistics. The authors have obtained the permission for figure using from the National Center for Education Statistics (Supplementary material).
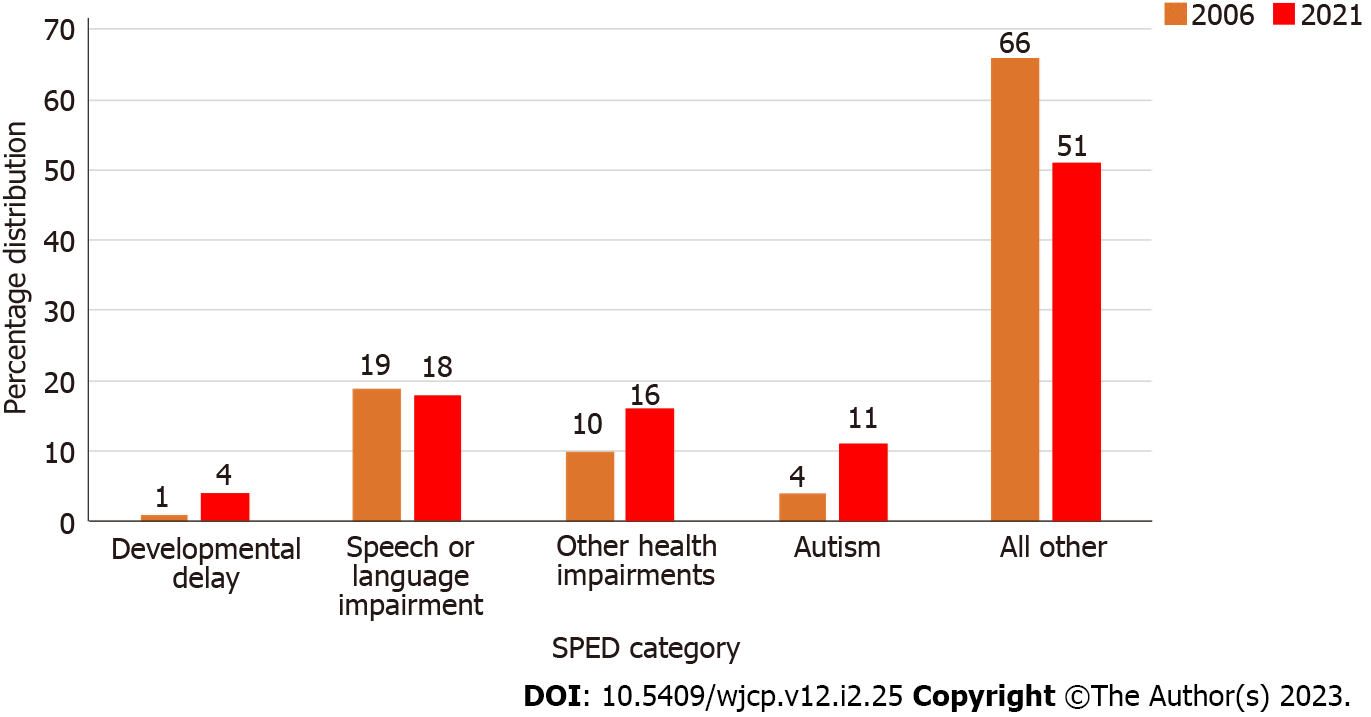
Figure 2 Percentage distribution of American children receiving special education services, 2006 and 2021.
SPED: Special education.
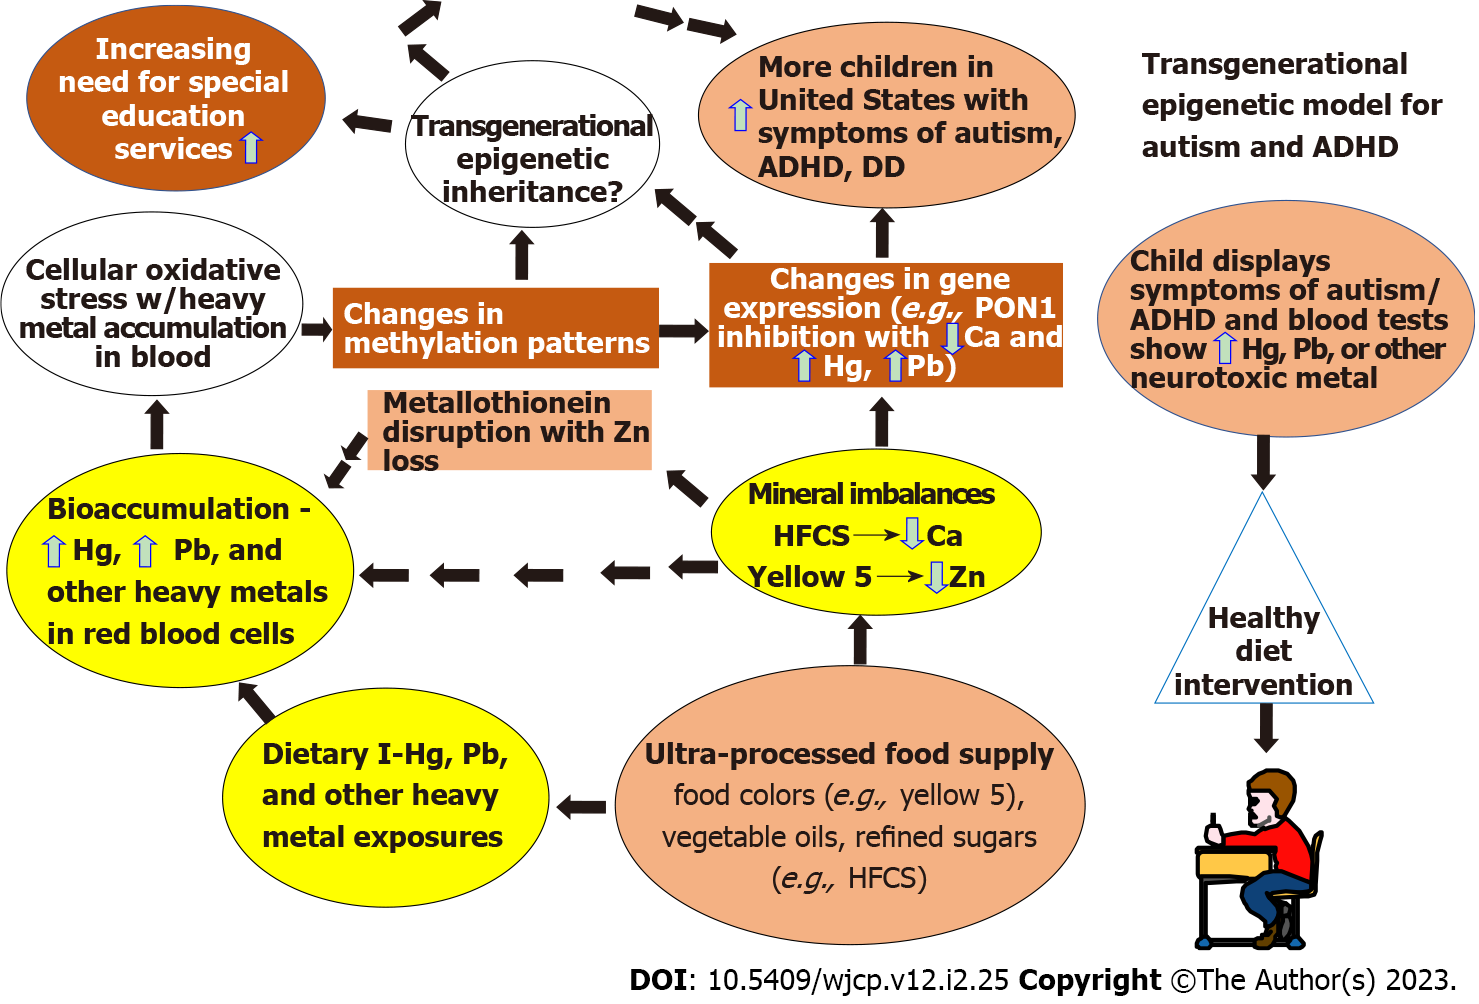
Figure 3 Transgenerational epigenetic model for autism and attention deficit/hyperactivity disorder.
ADHD: Attention deficit/hyperactivity disorder; HFCS: High fructose corn syrup; I-Hg: Inorganic mercury; Pb: Lead; Ca: Calcium; Zn: Zinc; PON1: Paraoxonase; DD: Developmental delay.
- Citation: Dufault RJ, Crider RA, Deth RC, Schnoll R, Gilbert SG, Lukiw WJ, Hitt AL. Higher rates of autism and attention deficit/hyperactivity disorder in American children: Are food quality issues impacting epigenetic inheritance? World J Clin Pediatr 2023; 12(2): 25-37
- URL: https://www.wjgnet.com/2219-2808/full/v12/i2/25.htm
- DOI: https://dx.doi.org/10.5409/wjcp.v12.i2.25


