Copyright
©The Author(s) 2022.
World J Clin Pediatr. May 9, 2022; 11(3): 270-288
Published online May 9, 2022. doi: 10.5409/wjcp.v11.i3.270
Published online May 9, 2022. doi: 10.5409/wjcp.v11.i3.270
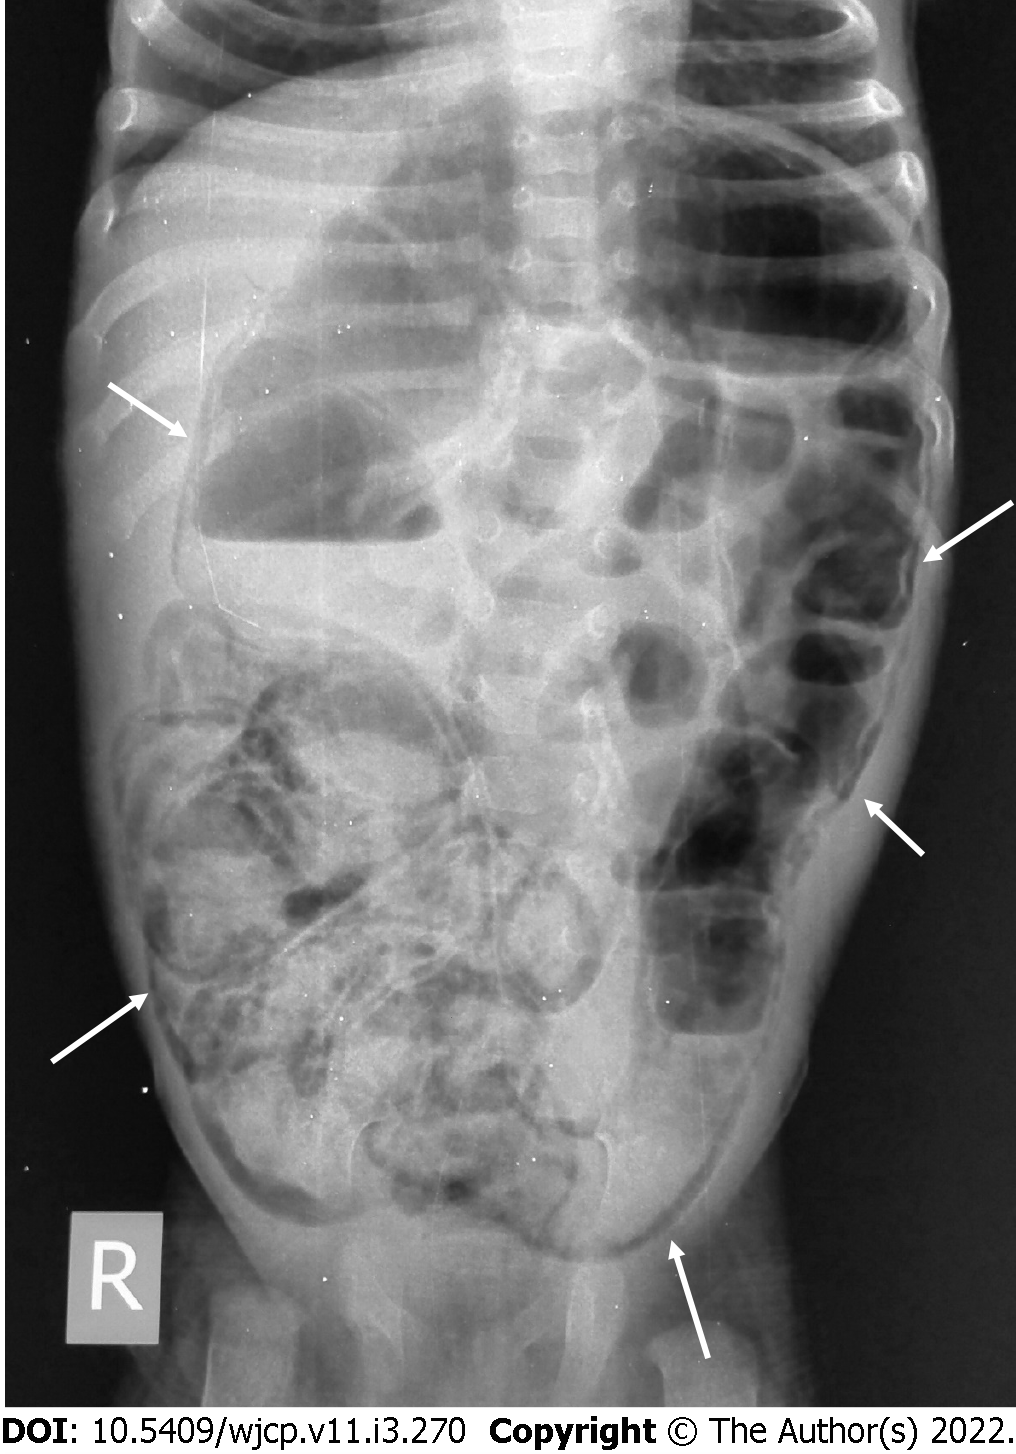
Figure 1 Abdominal X-ray in an infant with necrotizing enterocolitis showing diffuse intramural air (arrows).
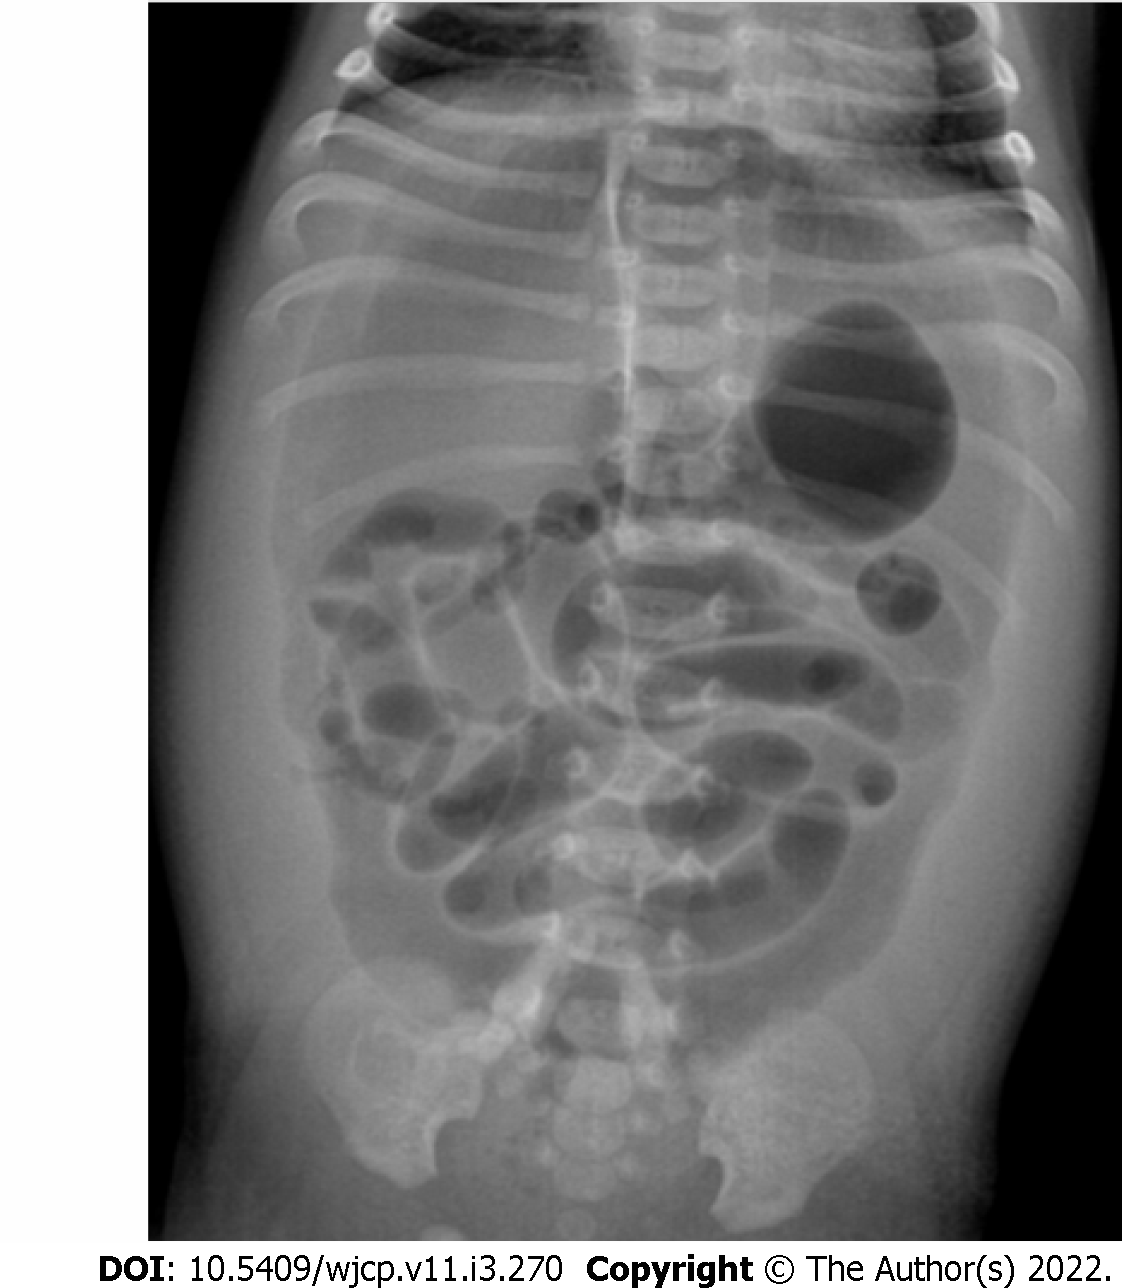
Figure 2 Abdominal X-ray in an infant with necrotizing enterocolitis showing free air.
The gas is seen outlining both sides of the bowel wall, i.e., gas is seen within the bowel lumen as well as in the abdominal cavity. This sign is called Rigler sign and is suggestive of large amount of pneumoperitoneum.
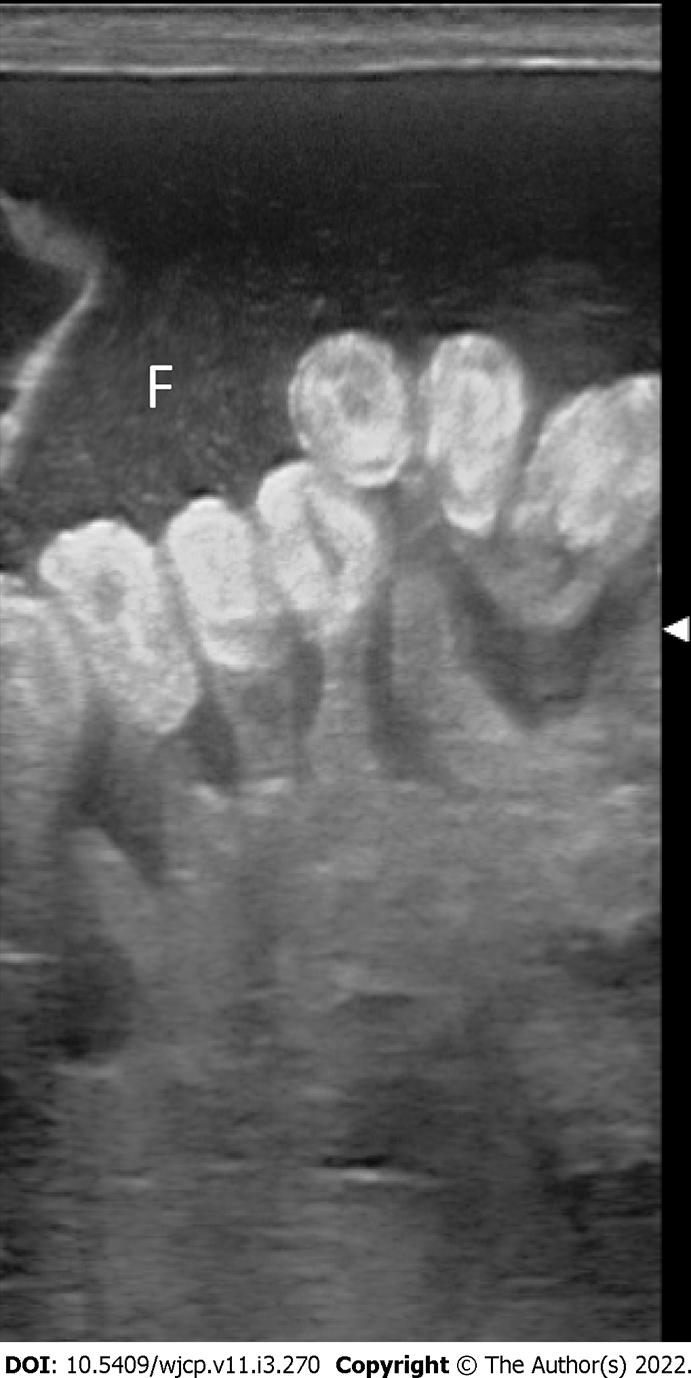
Figure 3 Ultrasound in an infant with complicated necrotizing enterocolitis showing diffusely echogenic bowel walls.
In addition, free fluid (F) with internal echoes is also seen.
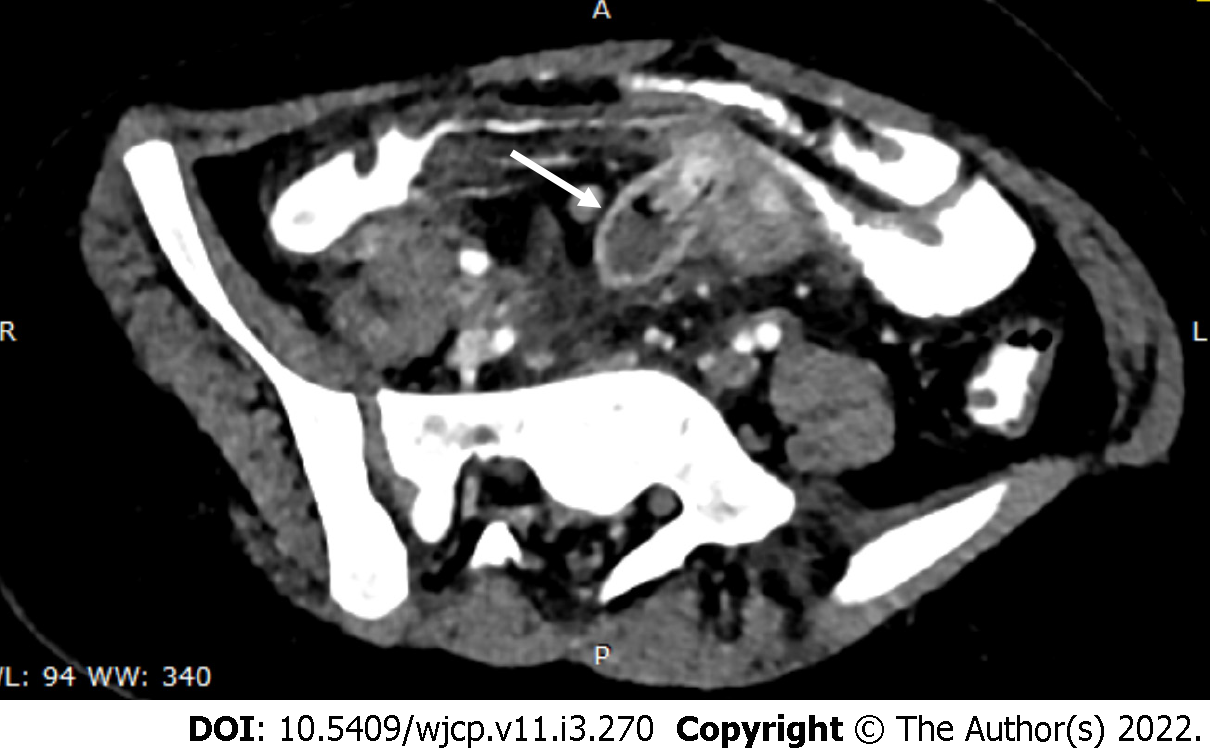
Figure 4 Axial computed tomography image showing blind ending tubular structure (arrow) in the midline in the mesentery coursing towards adjacent ileal loop suggestive of Meckel’s diverticulum.
Inflammation is also seen in the surrounding mesentery.
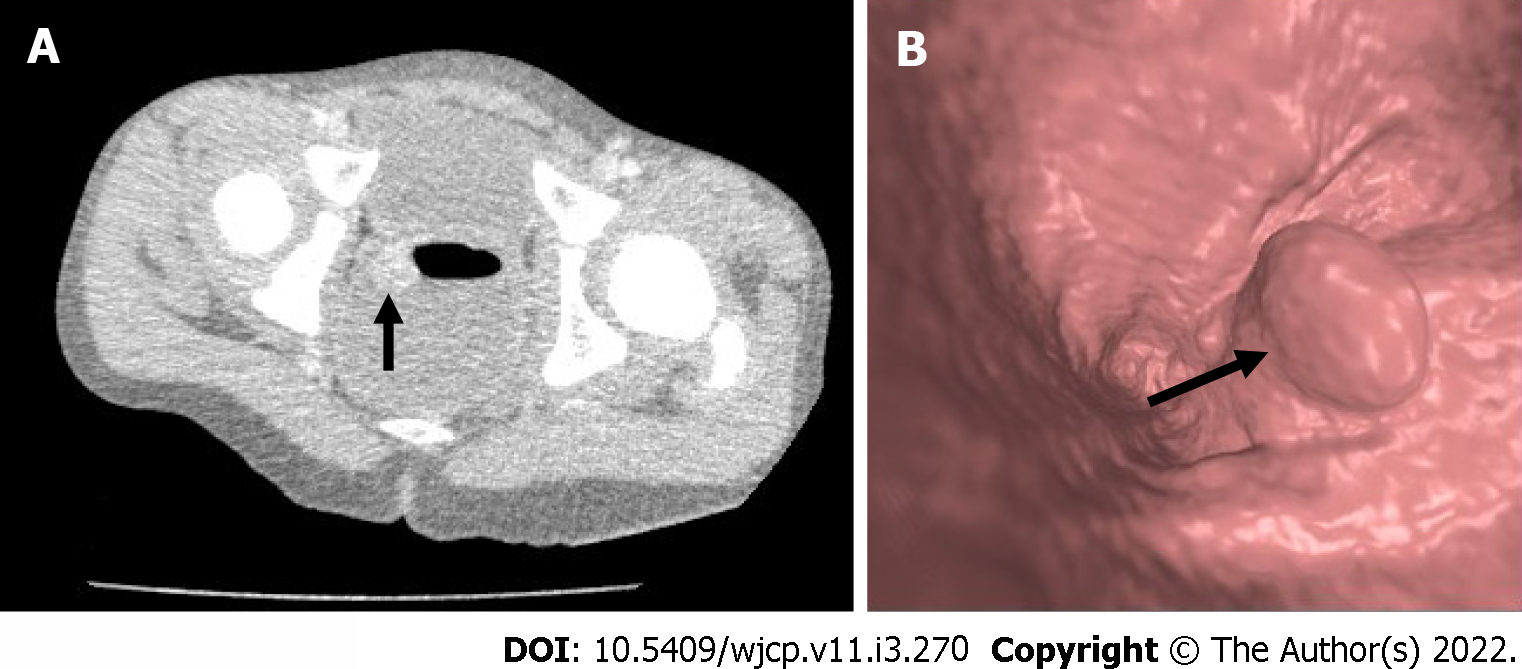
Figure 5 Axial contrast enhanced computed tomography colonoscopy image.
A: in a child with bleeding per rectum showing an enhancing polypoidal soft tissue (arrow) suggestive of a rectal polyp, as well as endoluminal colonoscopy image B: in another child showing a rectal polyp (arrow).
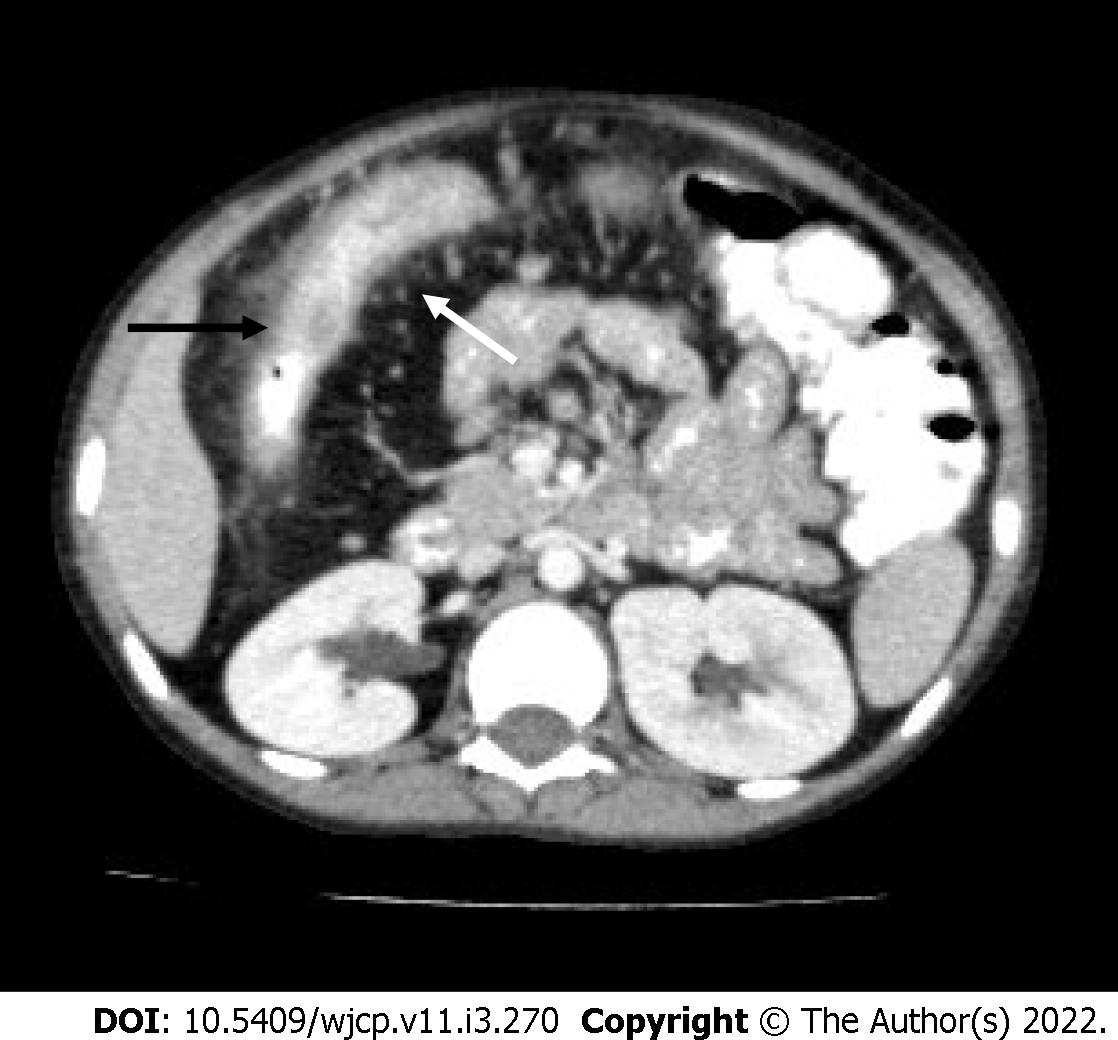
Figure 6 Axial contrast enhanced computed tomography image in a child with Crohn’s disease showing mesenteric fat proliferation with increased vascularity (white arrow) with mural thickening and enhancement in the adjacent bowel loop (black arrow).
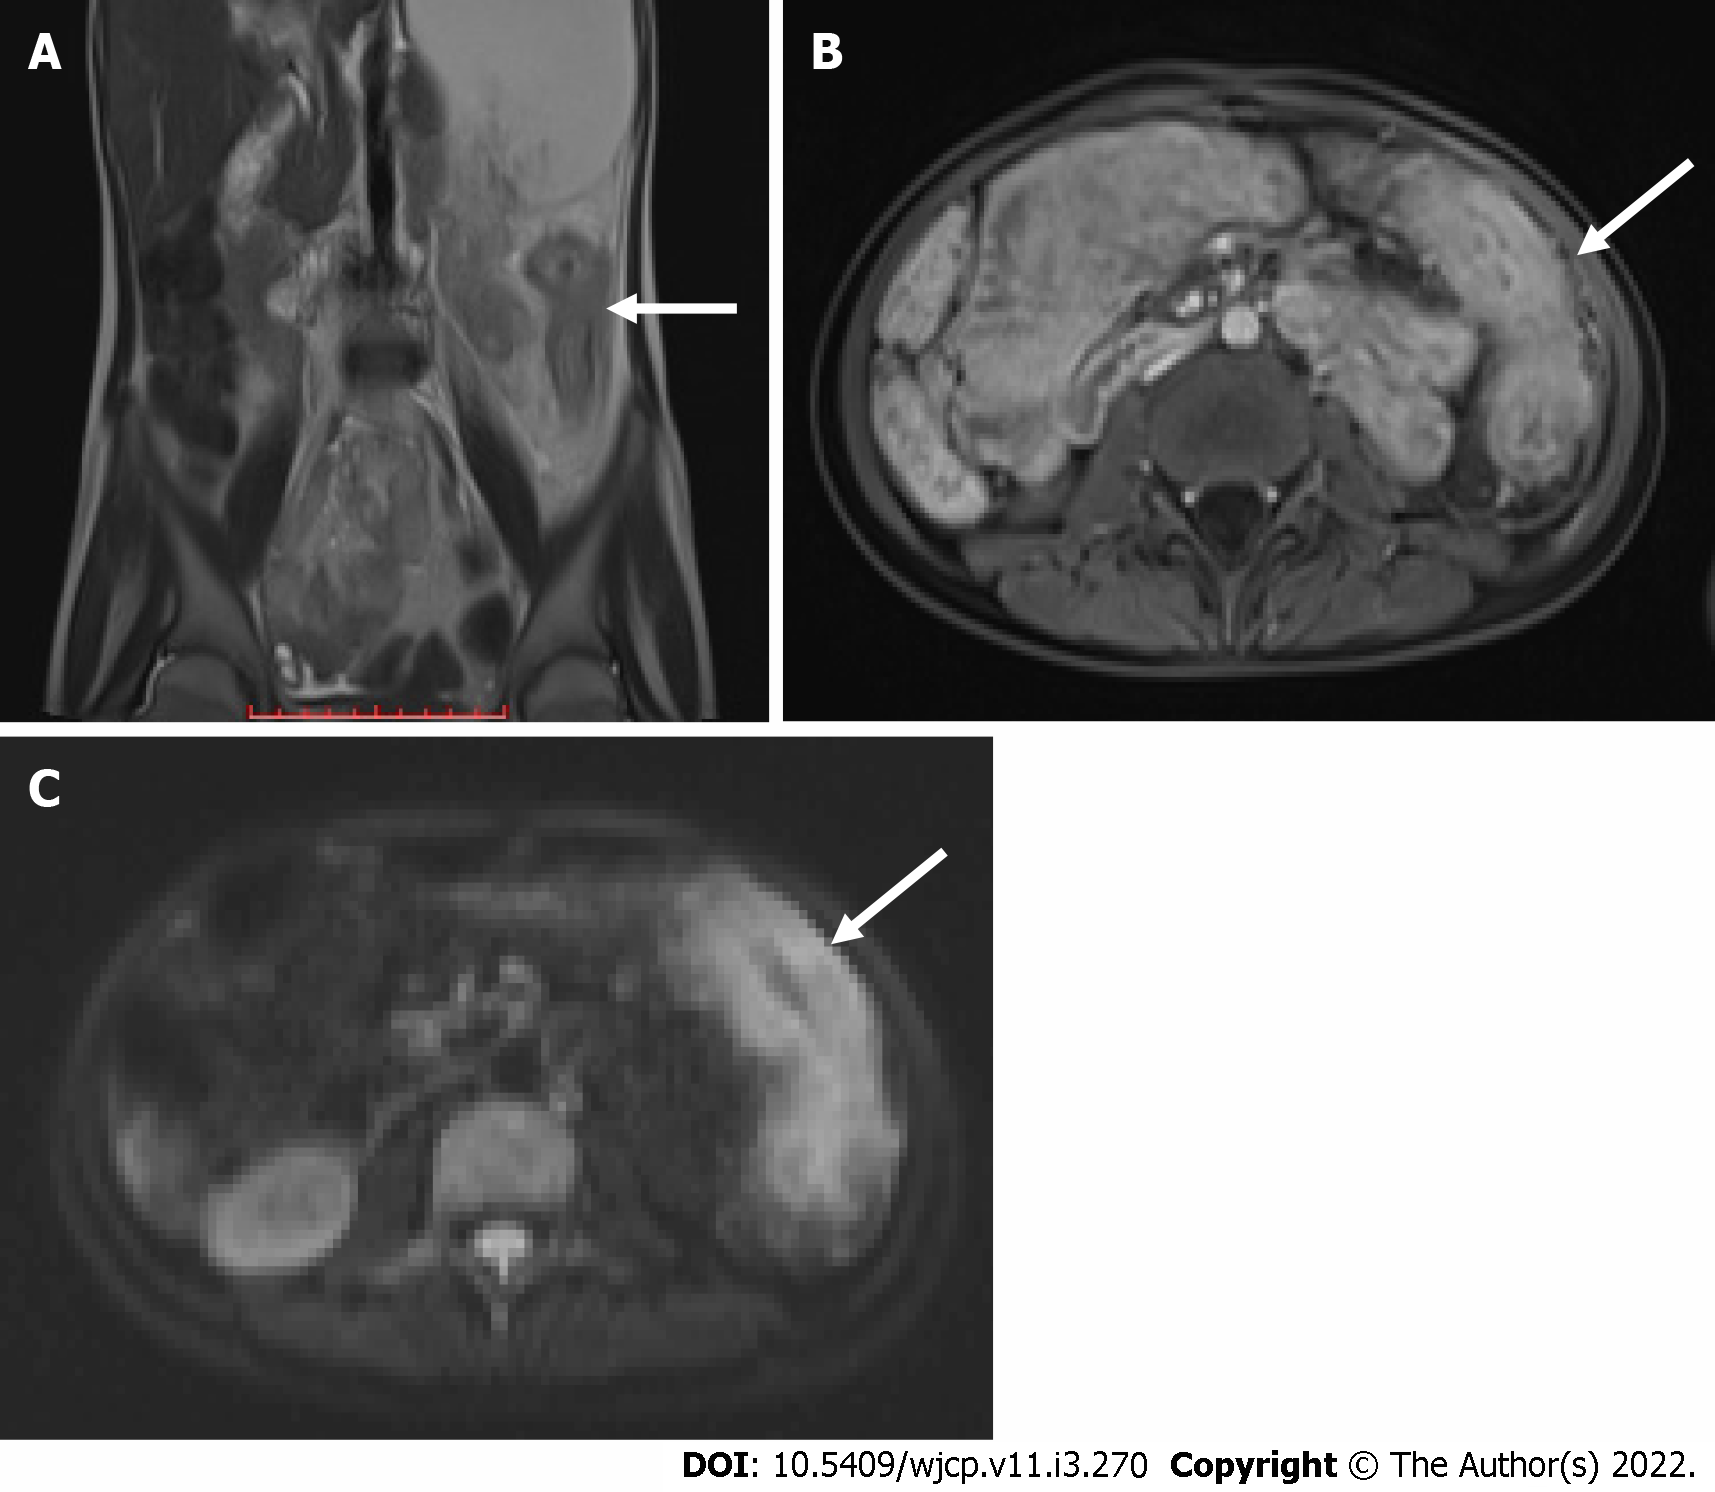
Figure 7 Diffusion weighted imaging.
A: Coronal T2 weighted magnetic resonance image showing long segment mural thickening in the descending colon (arrow in A) which is showing post contrast enhancement in post contrast T1 image (arrow in B) and intense diffusion restriction in diffusion weighted image (arrow in C) suggestive of active disease.
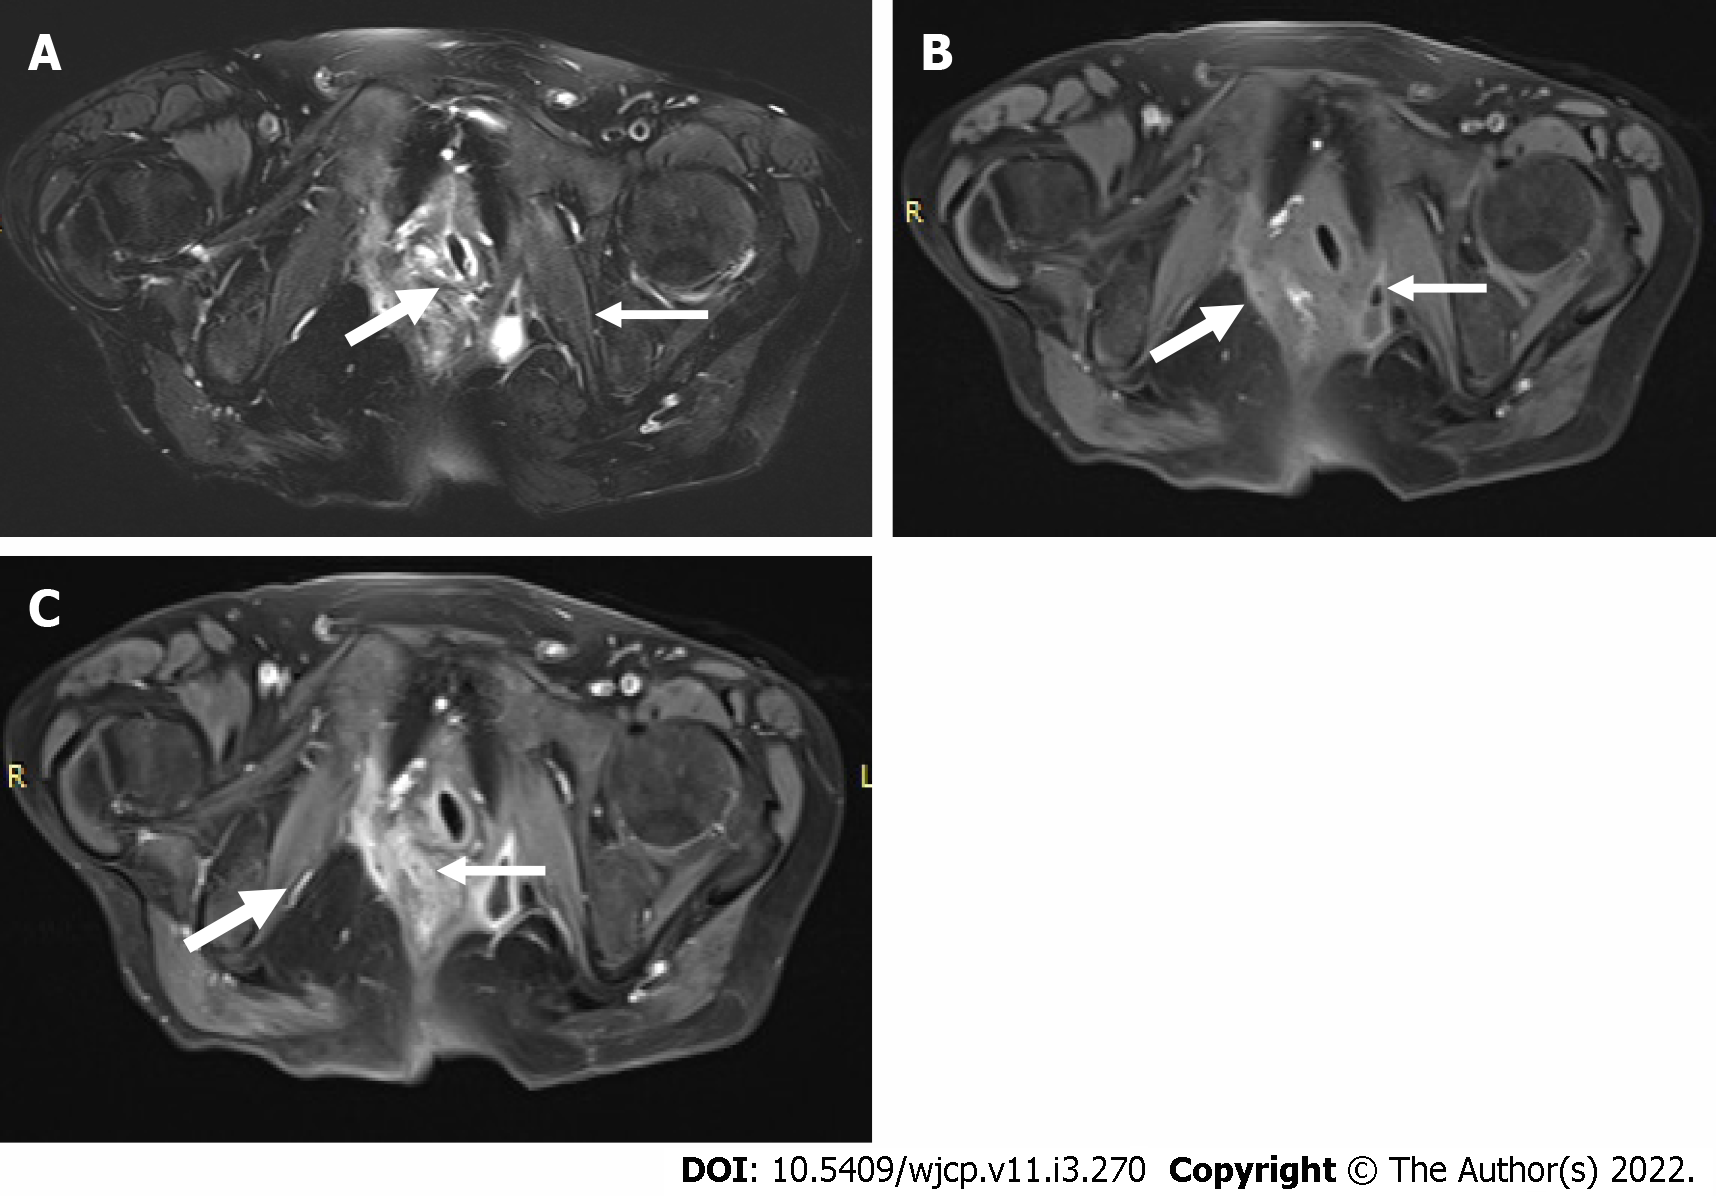
Figure 8 Magnetic resonance image pelvis images in a child with Crohn’s disease.
A and B: T2 weighted fat suppressed and pre contrast T1 weighted images showing a fistulous tract (thick arrow in A and B) on the right side communicating with the rectum in the midline. In addition, a small collection (thin arrow in A and B) with air focus is seen in the left ischio-rectal fossa; C: Post contrast T1 weighted fat suppressed image showing enhancement of the tract (thick arrow) as well as peripheral enhancement of the collection (thin arrow).
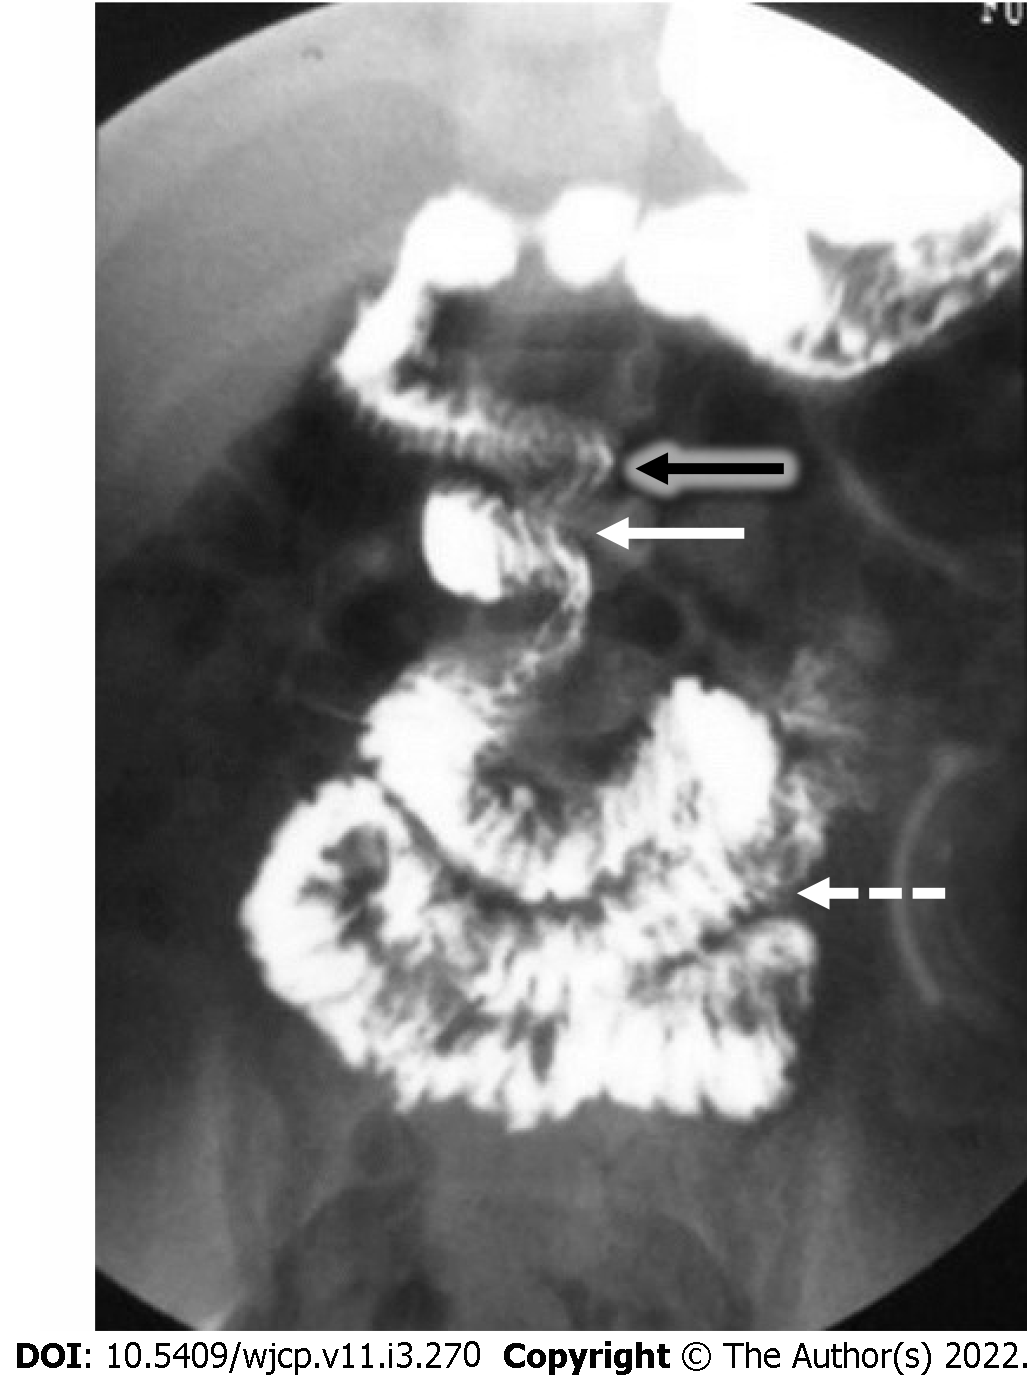
Figure 9 Contrast study showing low lying duodenojejunal flexure (black arrow) with cork-screw appearance (solid white arrow) suggestive of malrotation with volvulus.
The proximal jejunal loops (dashed white arrow) are seen in the midline and on the right side instead of the left side.
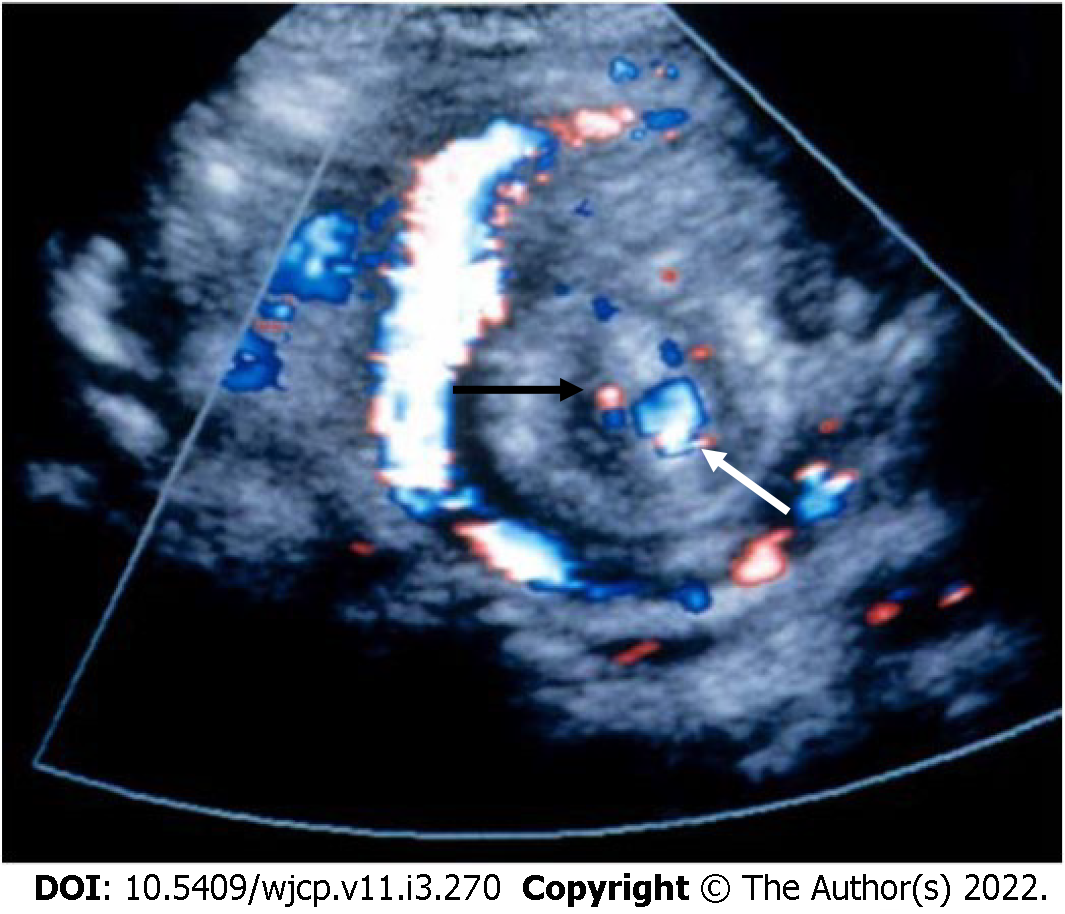
Figure 10 Color Doppler image showing whirlpool sign due to rotation of the superior mesenteric vein (white arrow) along with bowel loops around the superior mesenteric artery (black arrow) suggestive of malrotation with midgut volvulus.
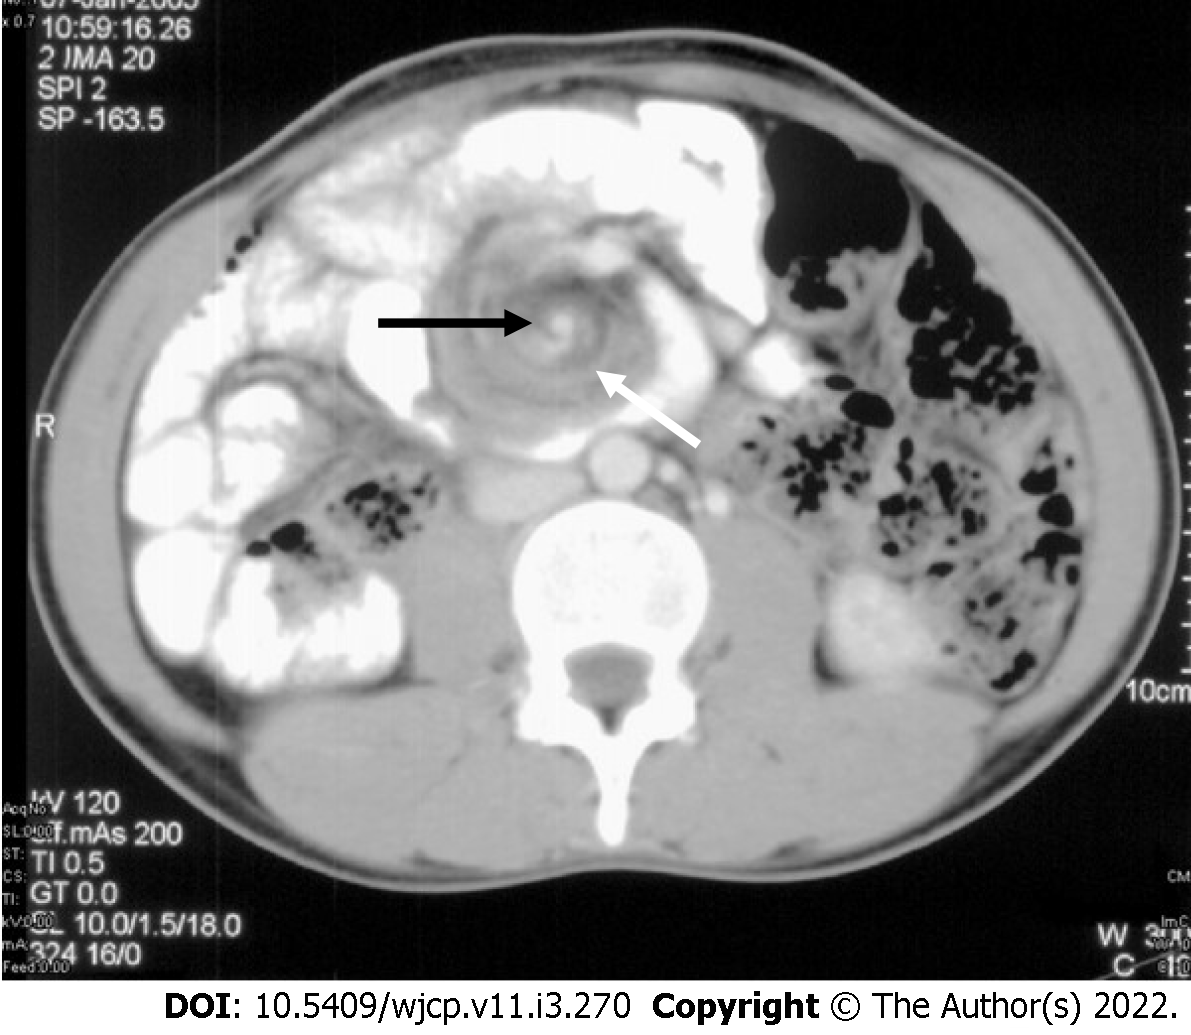
Figure 11 Axial contrast enhanced computed tomography image showing whirlpool sign due to rotation of the superior mesenteric vein (white arrow) along with bowel loops around the superior mesenteric artery (black arrow) suggestive of malrotation with midgut volvulus.
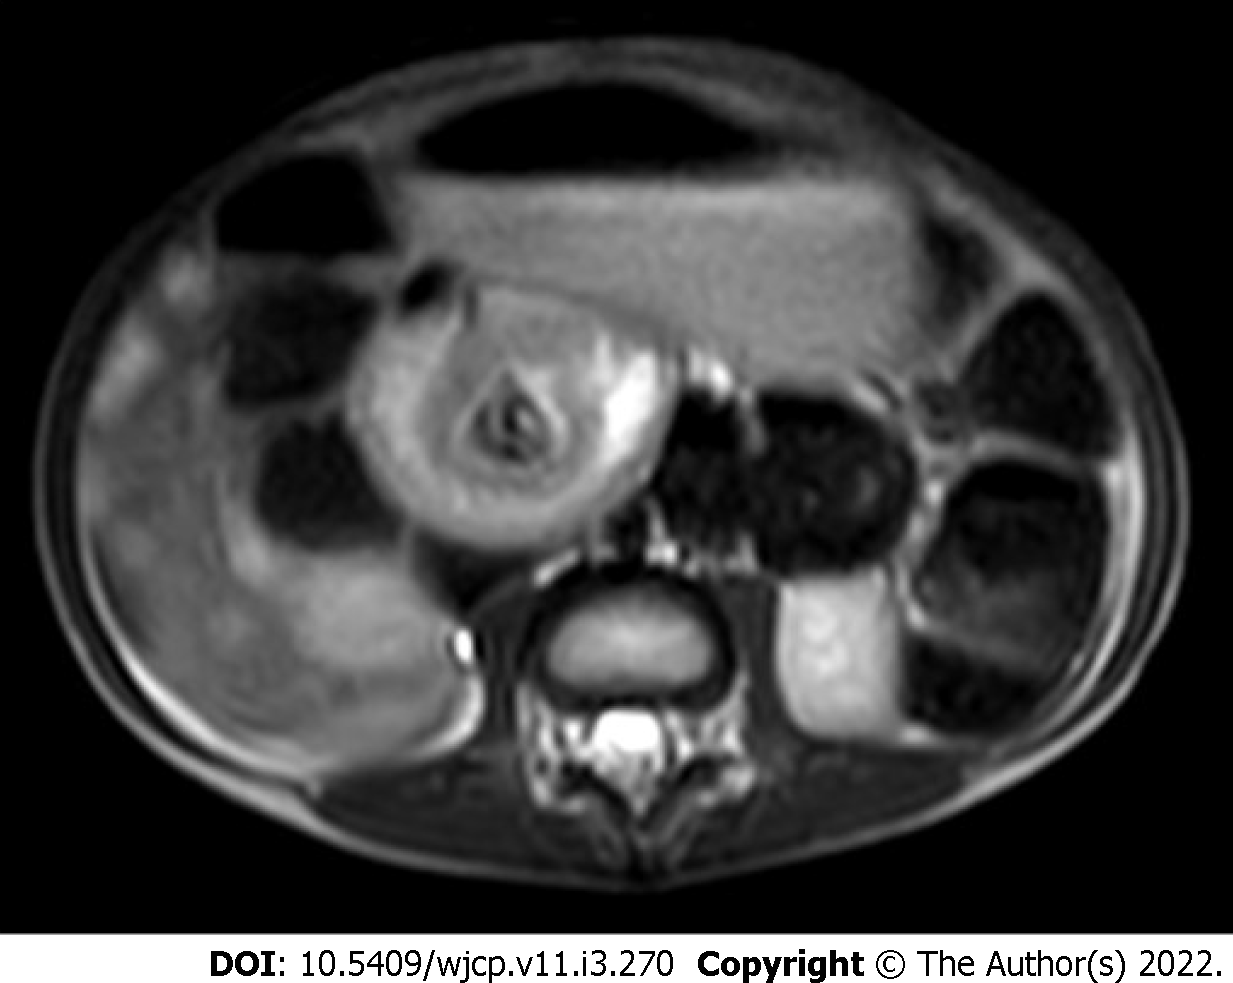
Figure 12 Axial T2 weighted magnetic resonance image showing whirlpool sign suggestive of malrotation with midgut volvulus.
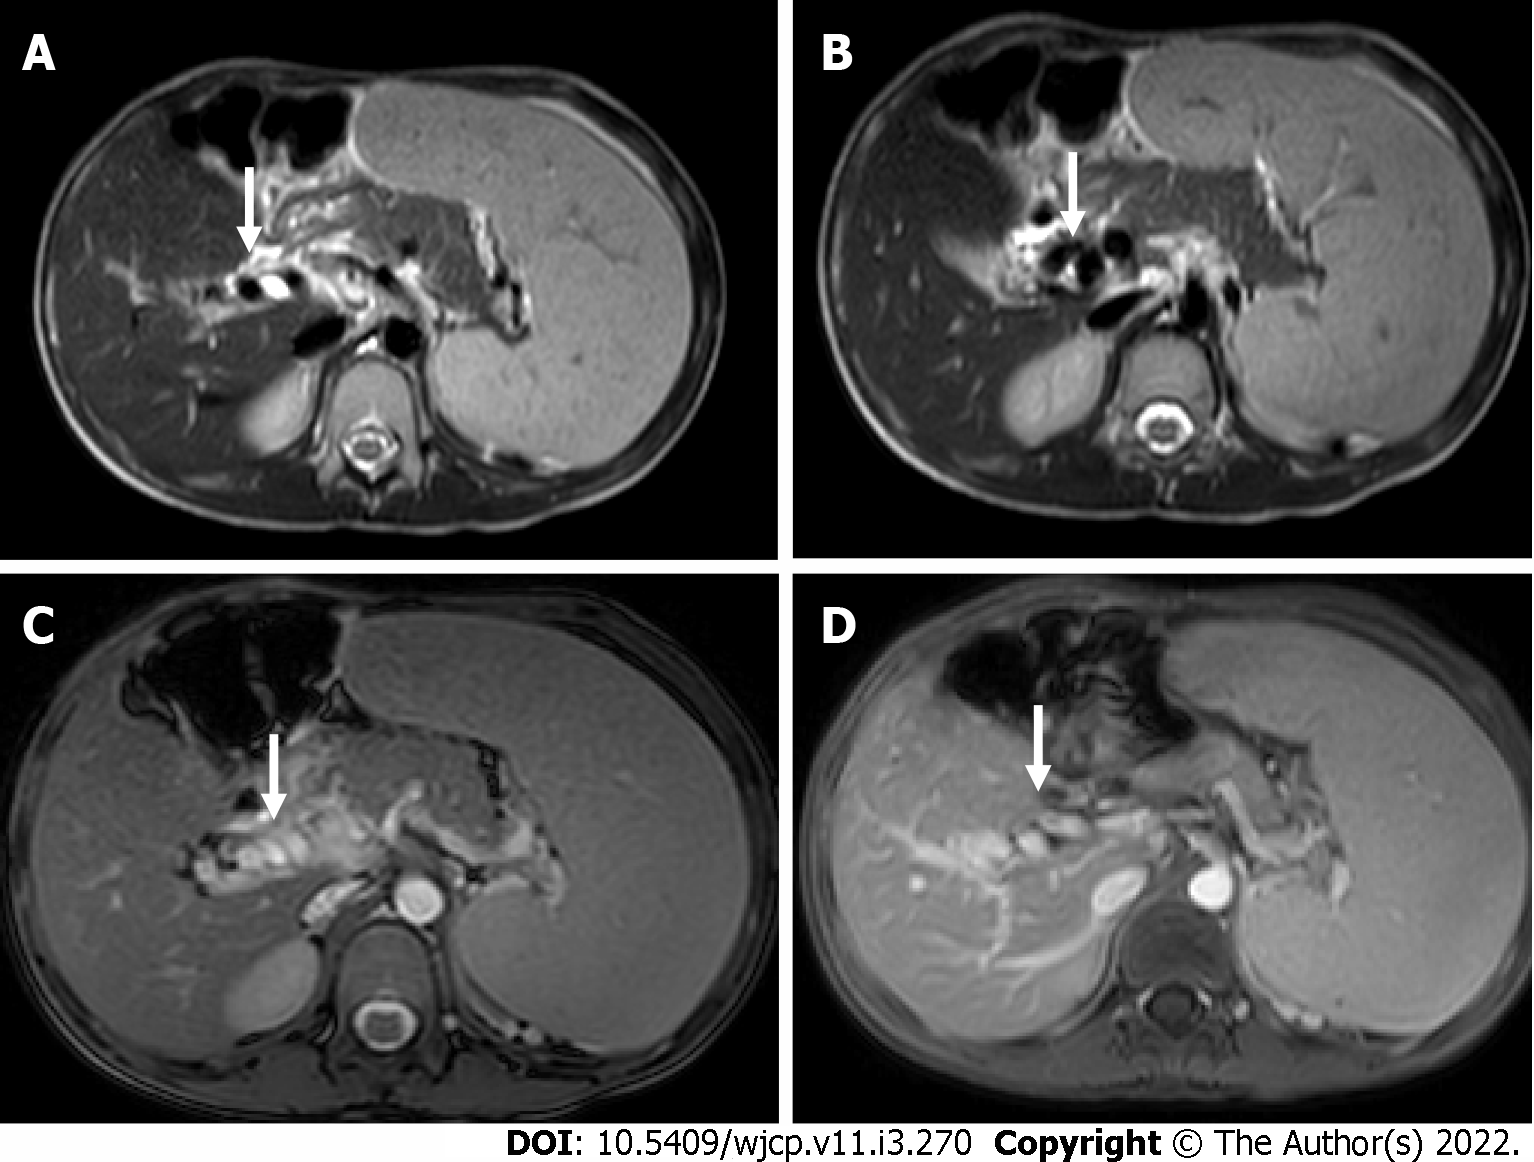
Figure 13 A 7-year-old boy with extra-hepatic portal vein obstruction.
A and B: Axial T2W images showing non visualized main portal vein with multiple collaterals (arrow) along the course of the portal vein; C and D: Axial BTFE and post-contrast T1 images show multiple collaterals (arrow) replacing the main portal vein at the porta. In addition, splenomegaly is also seen.
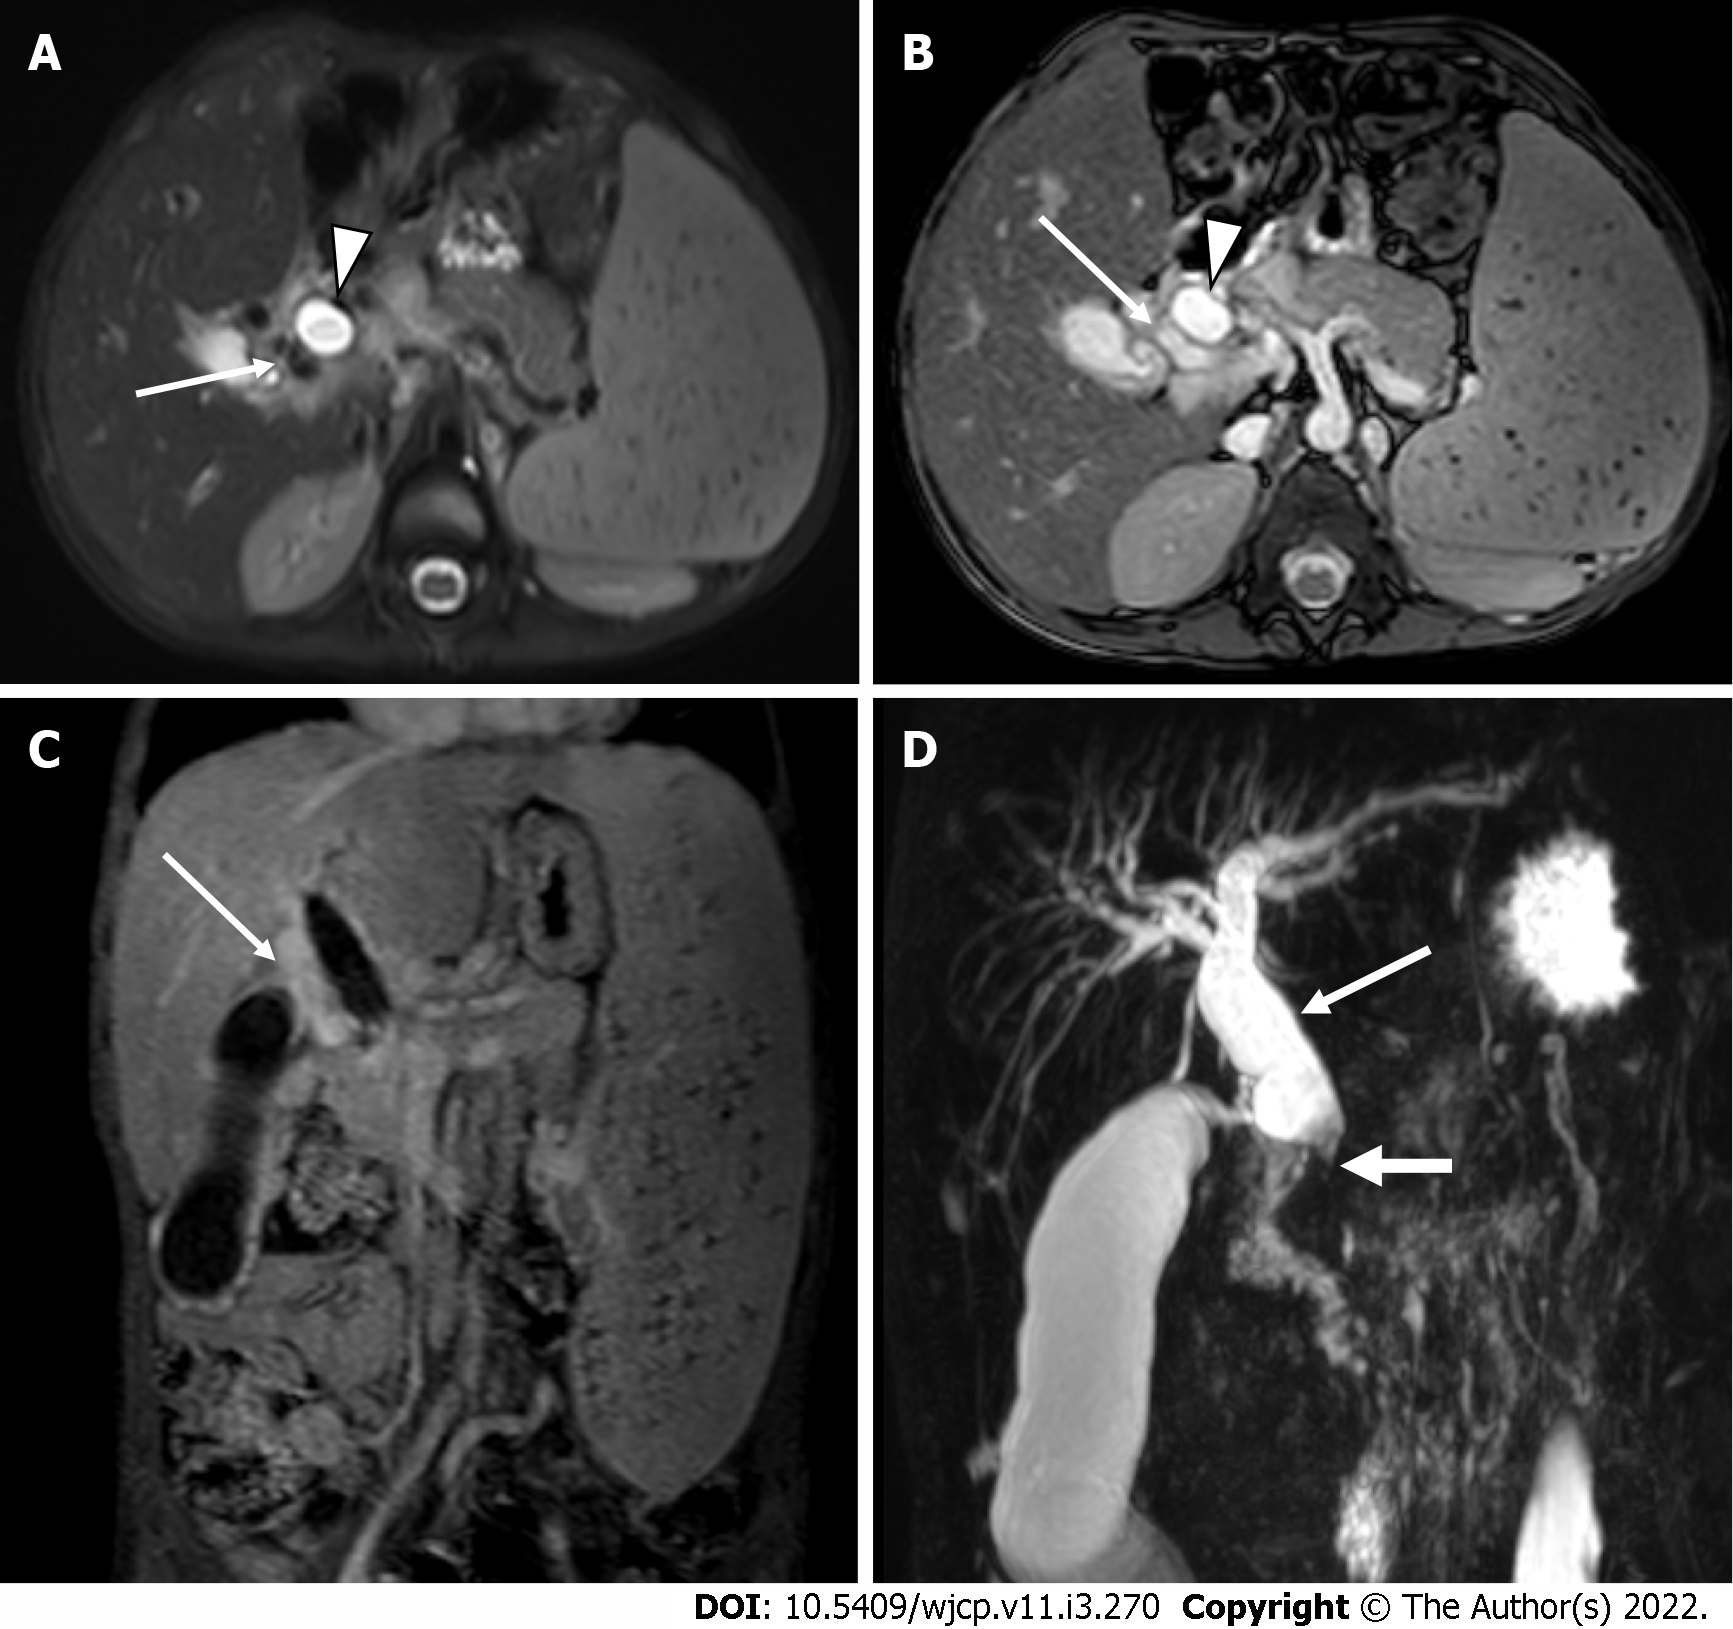
Figure 14 Portal cavernoma cholangiopathy.
A and B: Axial T2 weighted and axial BTFE magnetic resonance images show dilated CBD [arrowhead] with multiple pericholedochal collaterals [white arrow]; C: Coronal post-contrast T1 image shows multiple enhancing pericholedochal collaterals [white arrow]; D: Massive splenomegaly. Thick slab coronal magnetic resonance cholangiopancreatography image shows dilated and tortuous CBD (thin arrow) with abrupt cut-off at the lower end (thick arrow).
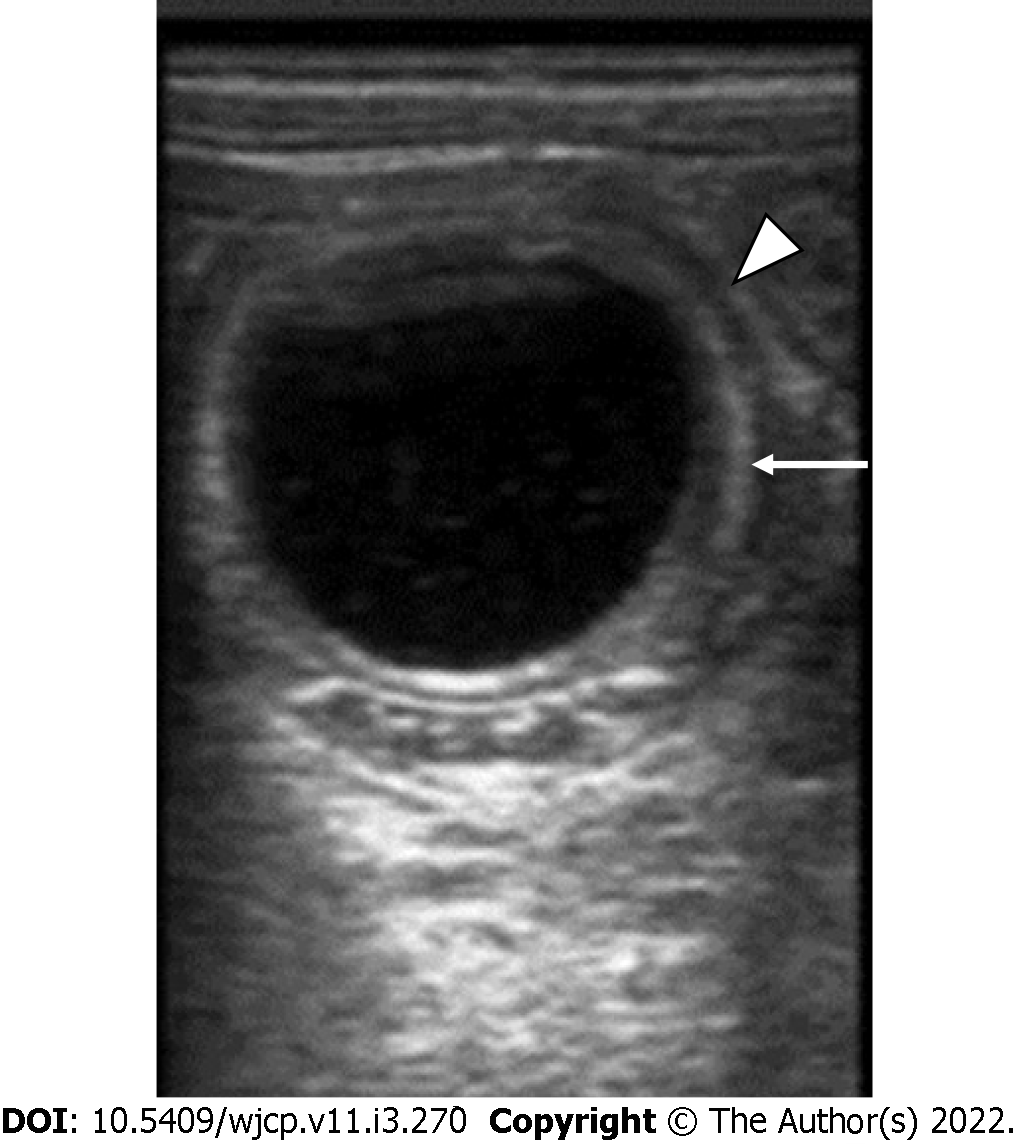
Figure 15 Gray-scale ultrasonography image shows a well-defined anechoic lesion showing a classic gut signature with inner echogenic mucosa (arrow) and outer hypoechoic muscularis propria.
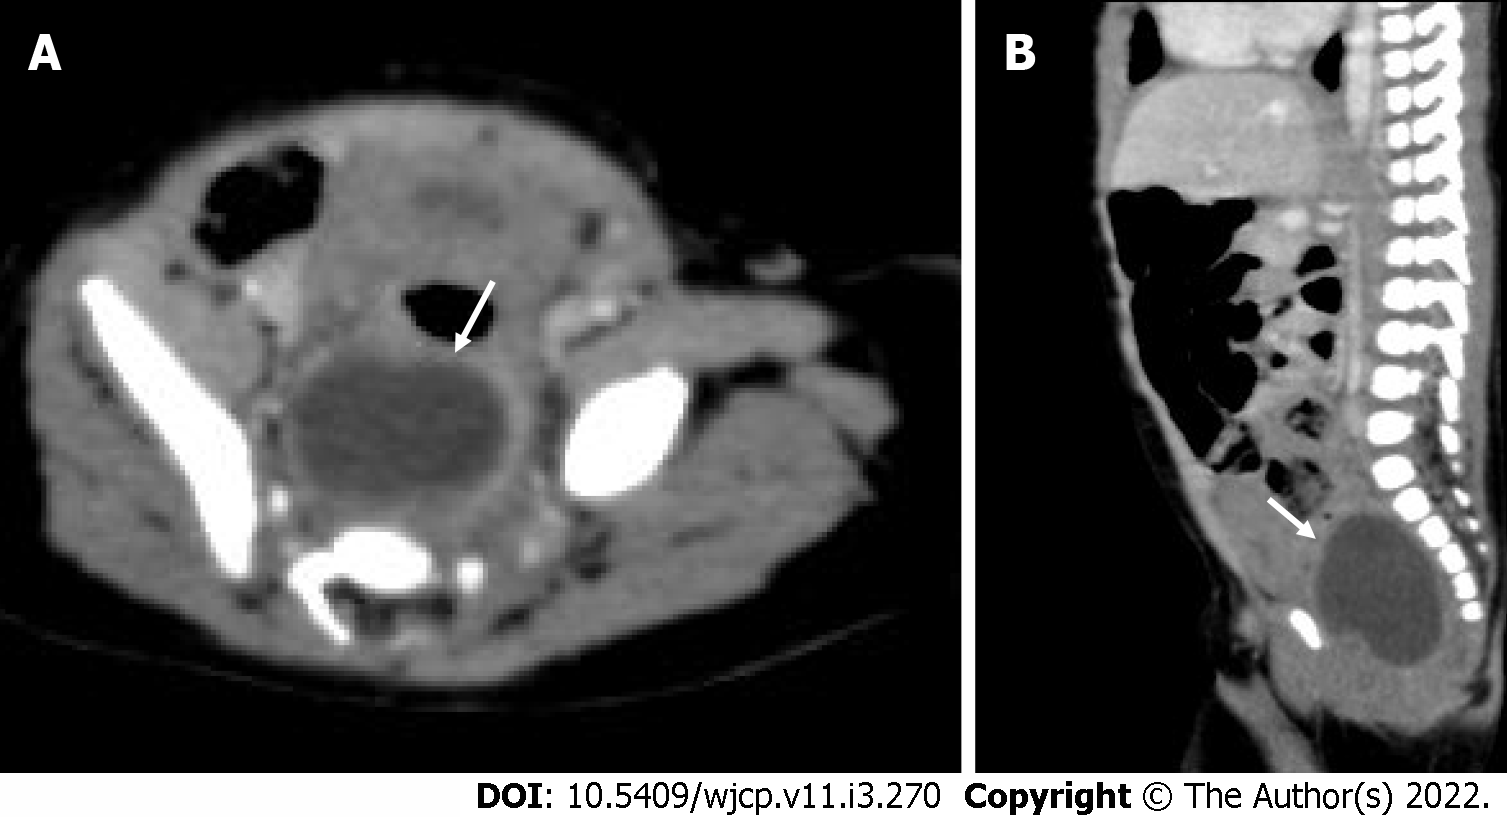
Figure 16 Rectal duplication cyst.
A and B: Axial and sagittal contrast enhanced computed tomography images show a well-defined cystic structure in the presacral space pushing the rectum (arrow) anteriorly.
Figure 17 An 8-year-old girl with bleeding per rectum.
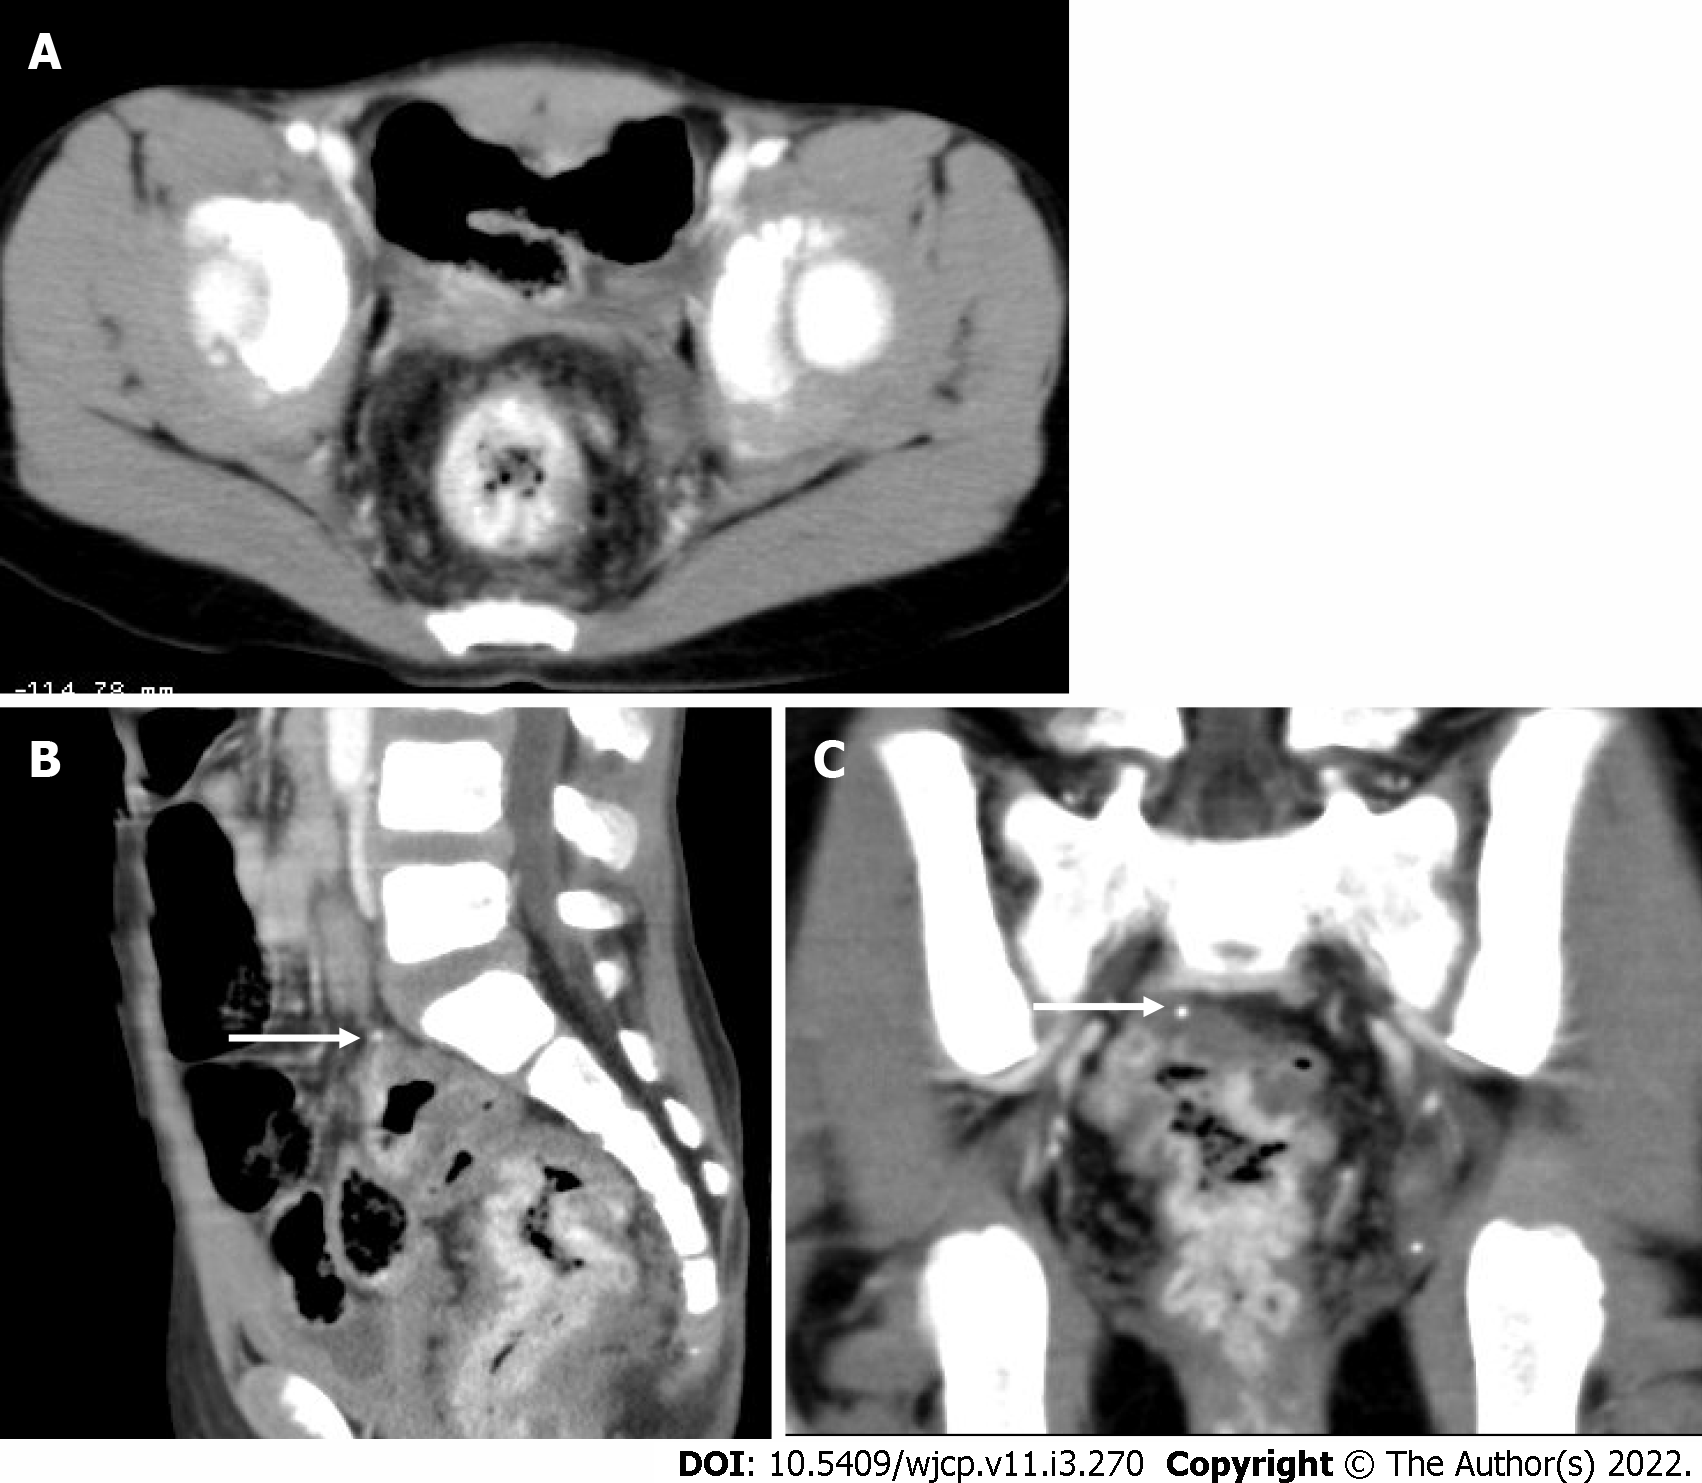
Axial (A), sagittal (B), and coronal (C) contrast enhanced computed tomography images showing diffuse rectal wall thickening with intense contrast enhancement. A tiny phlebolith is also seen (arrows in B and C). Findings are suggestive of rectal hemangioma.
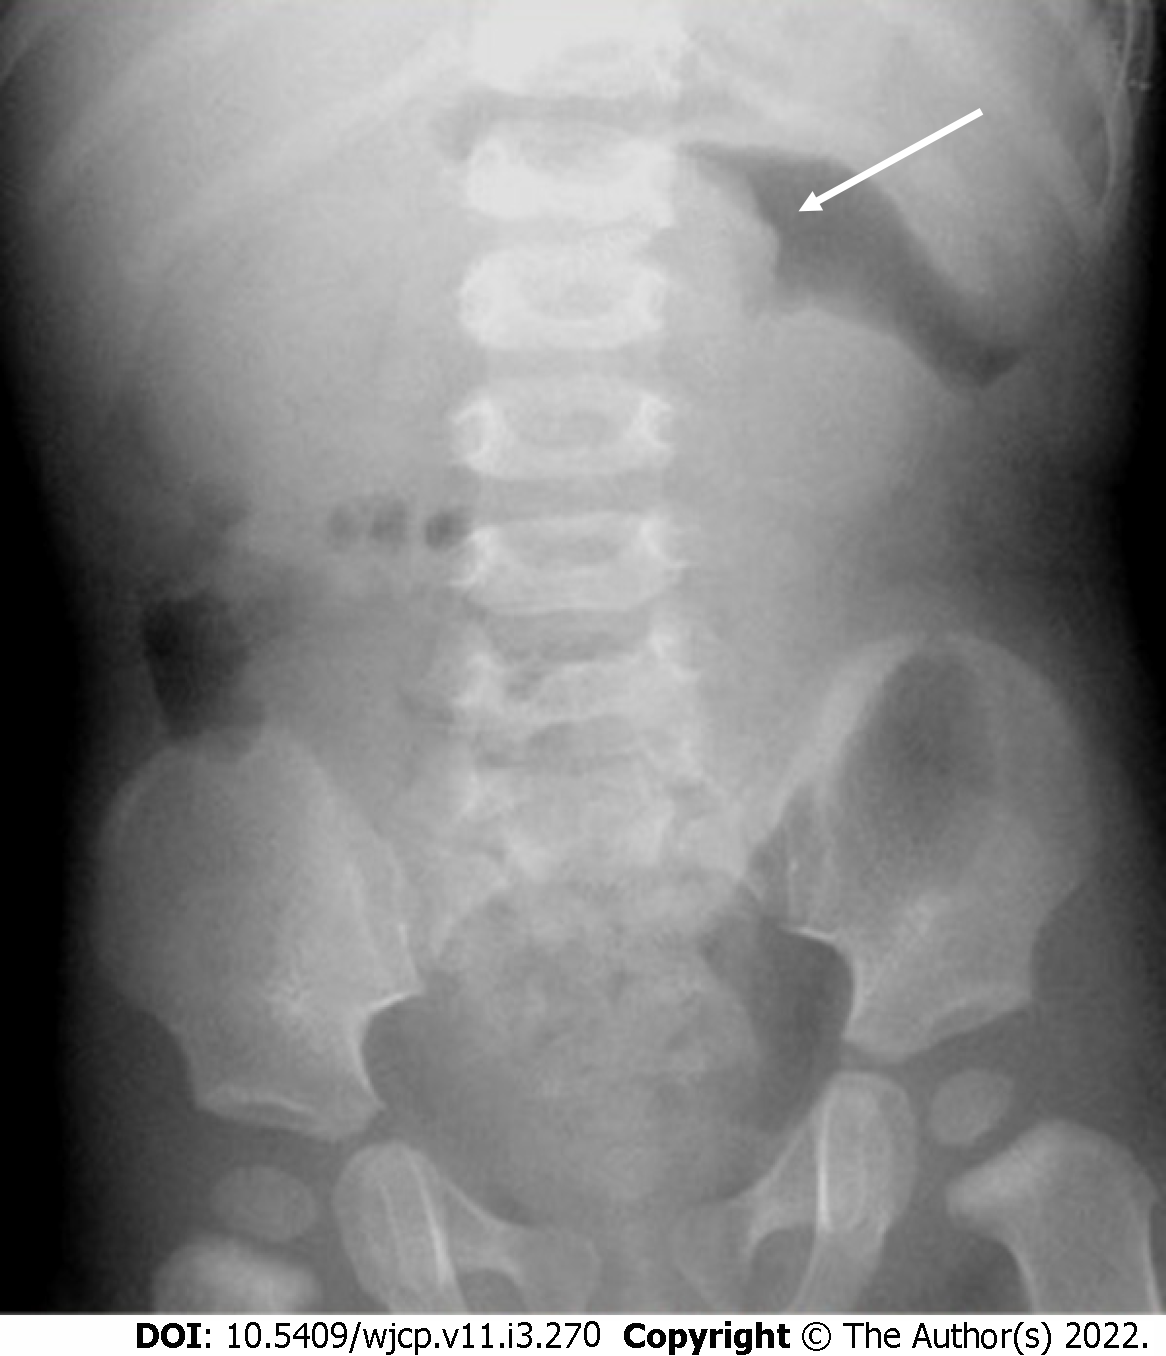
Figure 18 Abdominal X-ray in a child with intussusception showing a gasless abdomen with meniscus of air outlining a soft tissue opacity (intussusceptum) in upper abdomen (arrow).
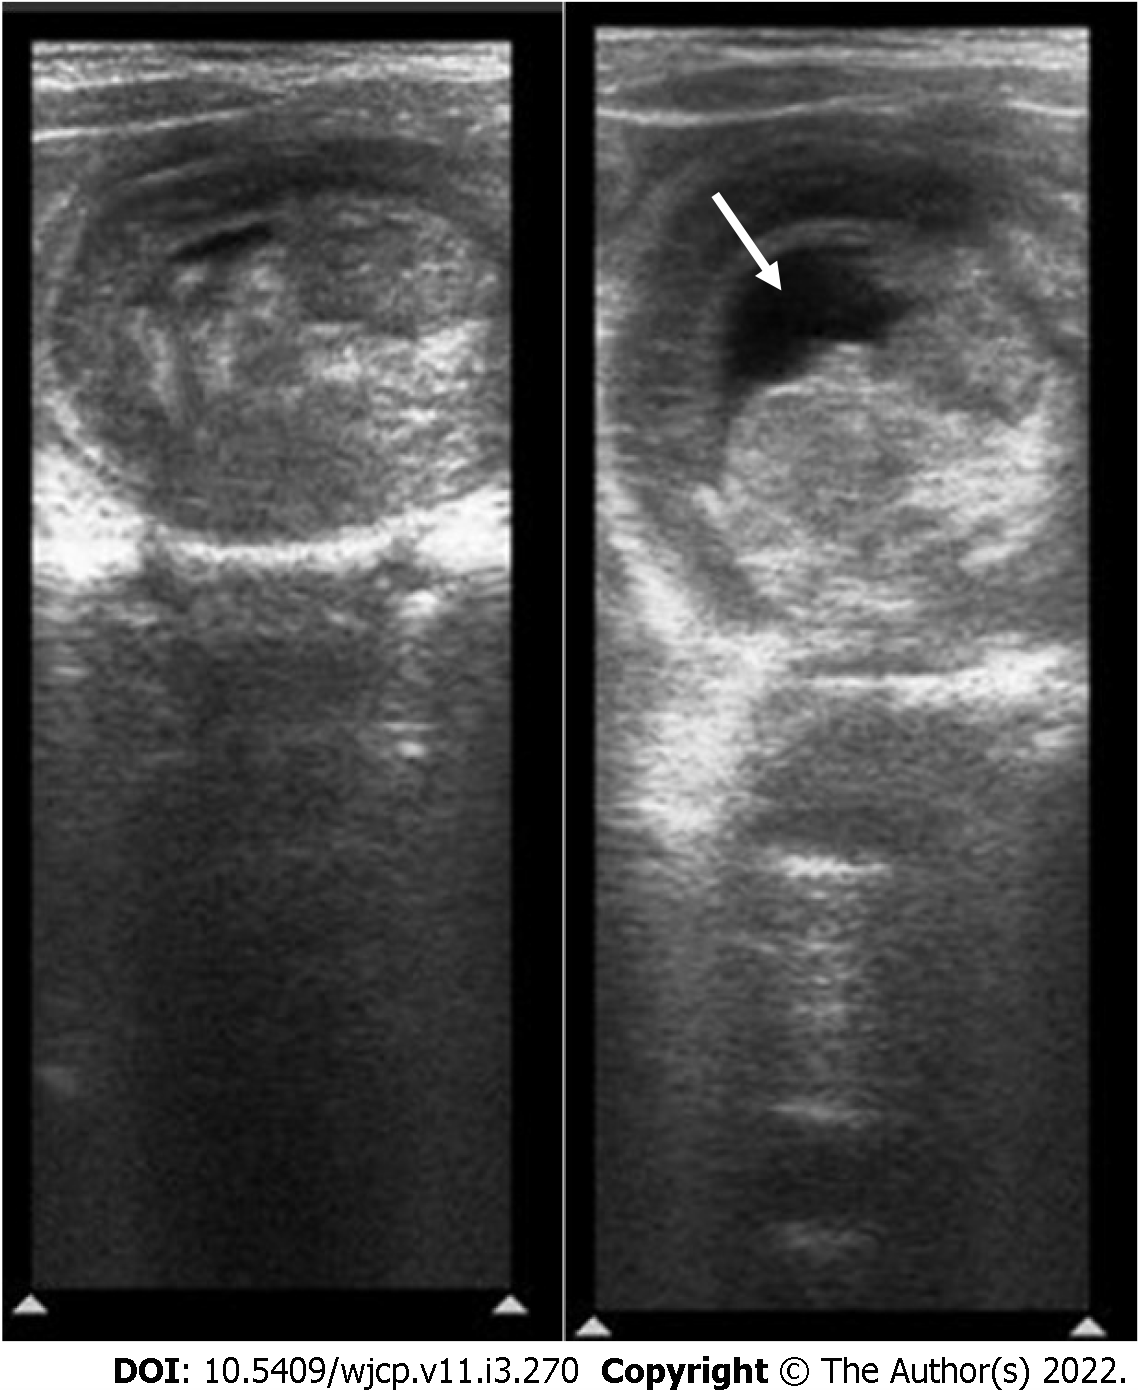
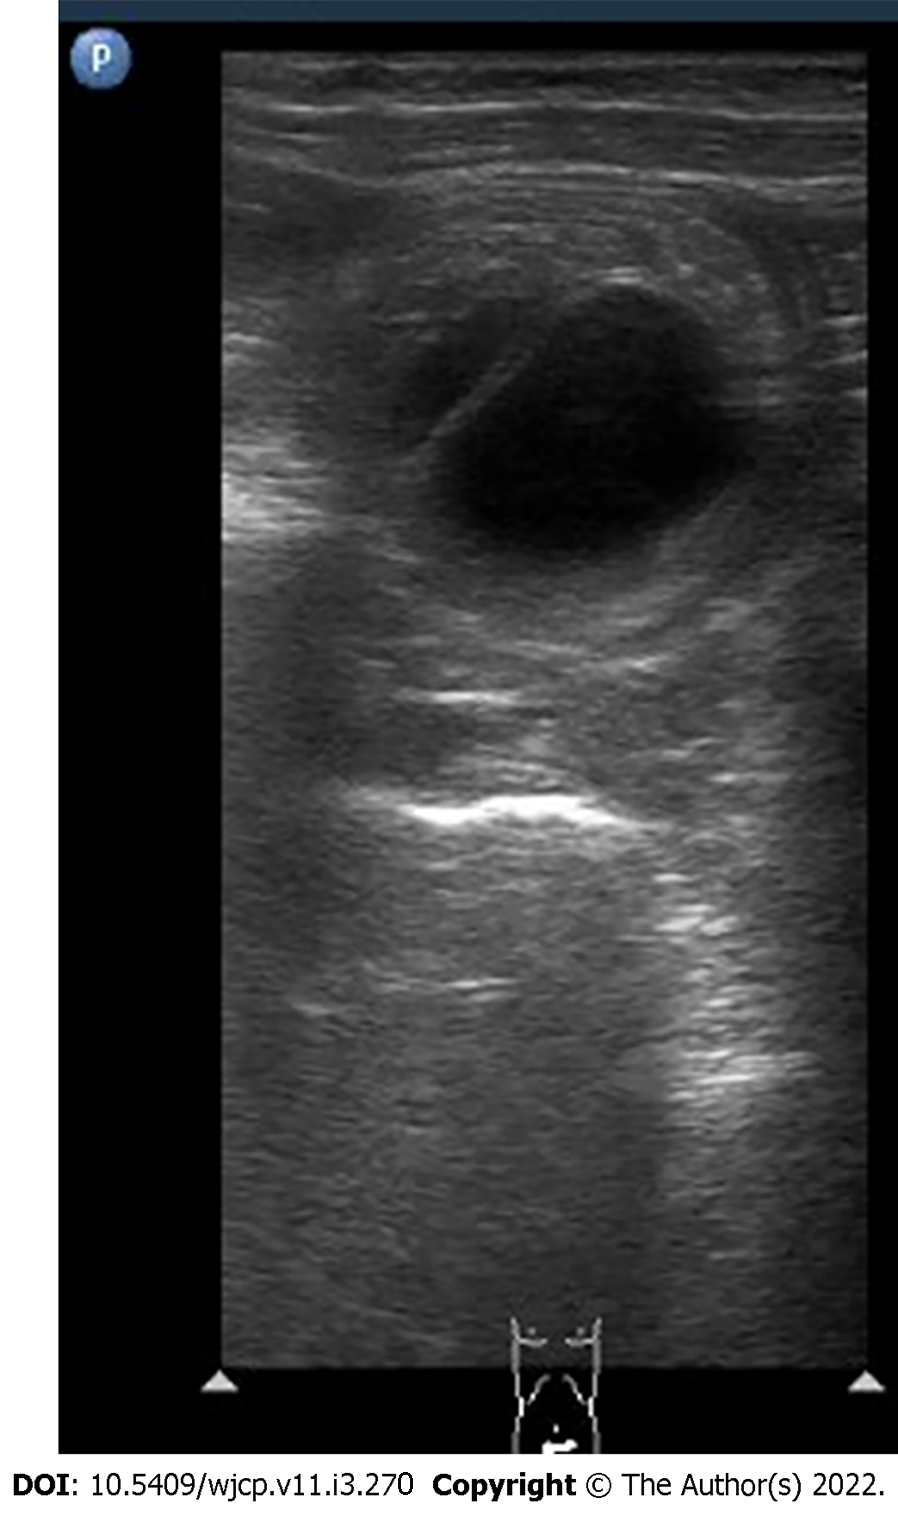
Figure 19 Ultrasound image shows multiple concentric rings suggestive of intussusception.
Minimal trapped fluid is also seen (arrow).
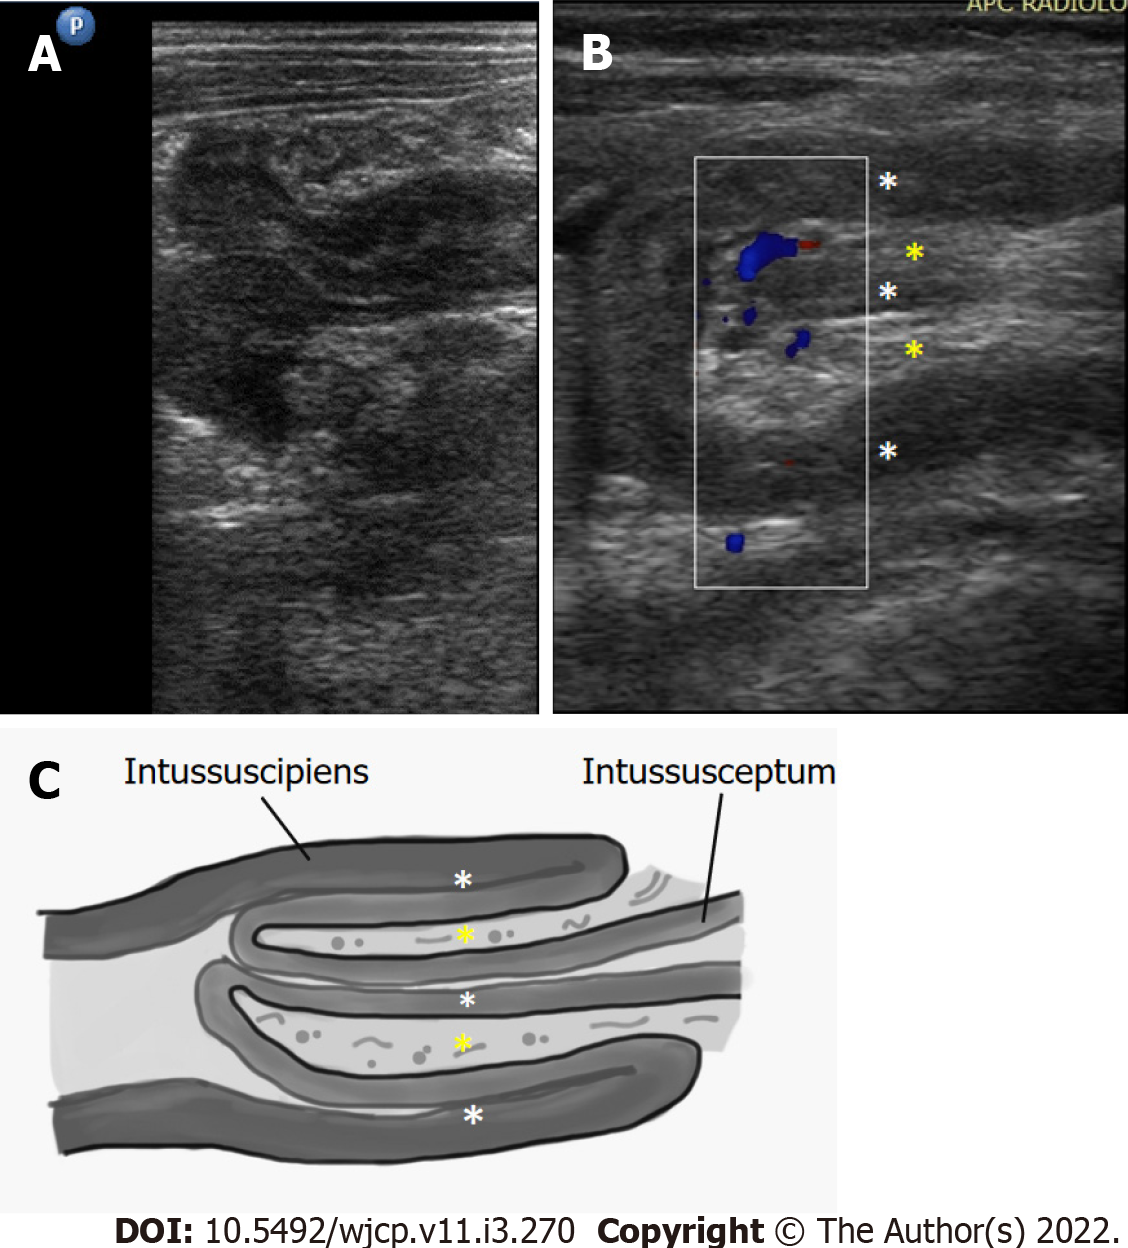
Figure 20 Longitudinal ultrasound images of ileo-colic intussusception.
A: Outer intussuscipiens and inner intussusceptum; B and C: Both show three hypoechoic lines (white asterixes) separating the two echogenic areas (yellow asterisks) giving sandwich sign/hay-fork sign. Longitudinal ultrasound images are important to delineate the length of the involved bowel segment.
Figure 21 Ultrasound image shows cystic structure at the apex of the intussusceptum as the pathological lead point.
Differentials include duplication cyst and Meckel’s diverticulum.
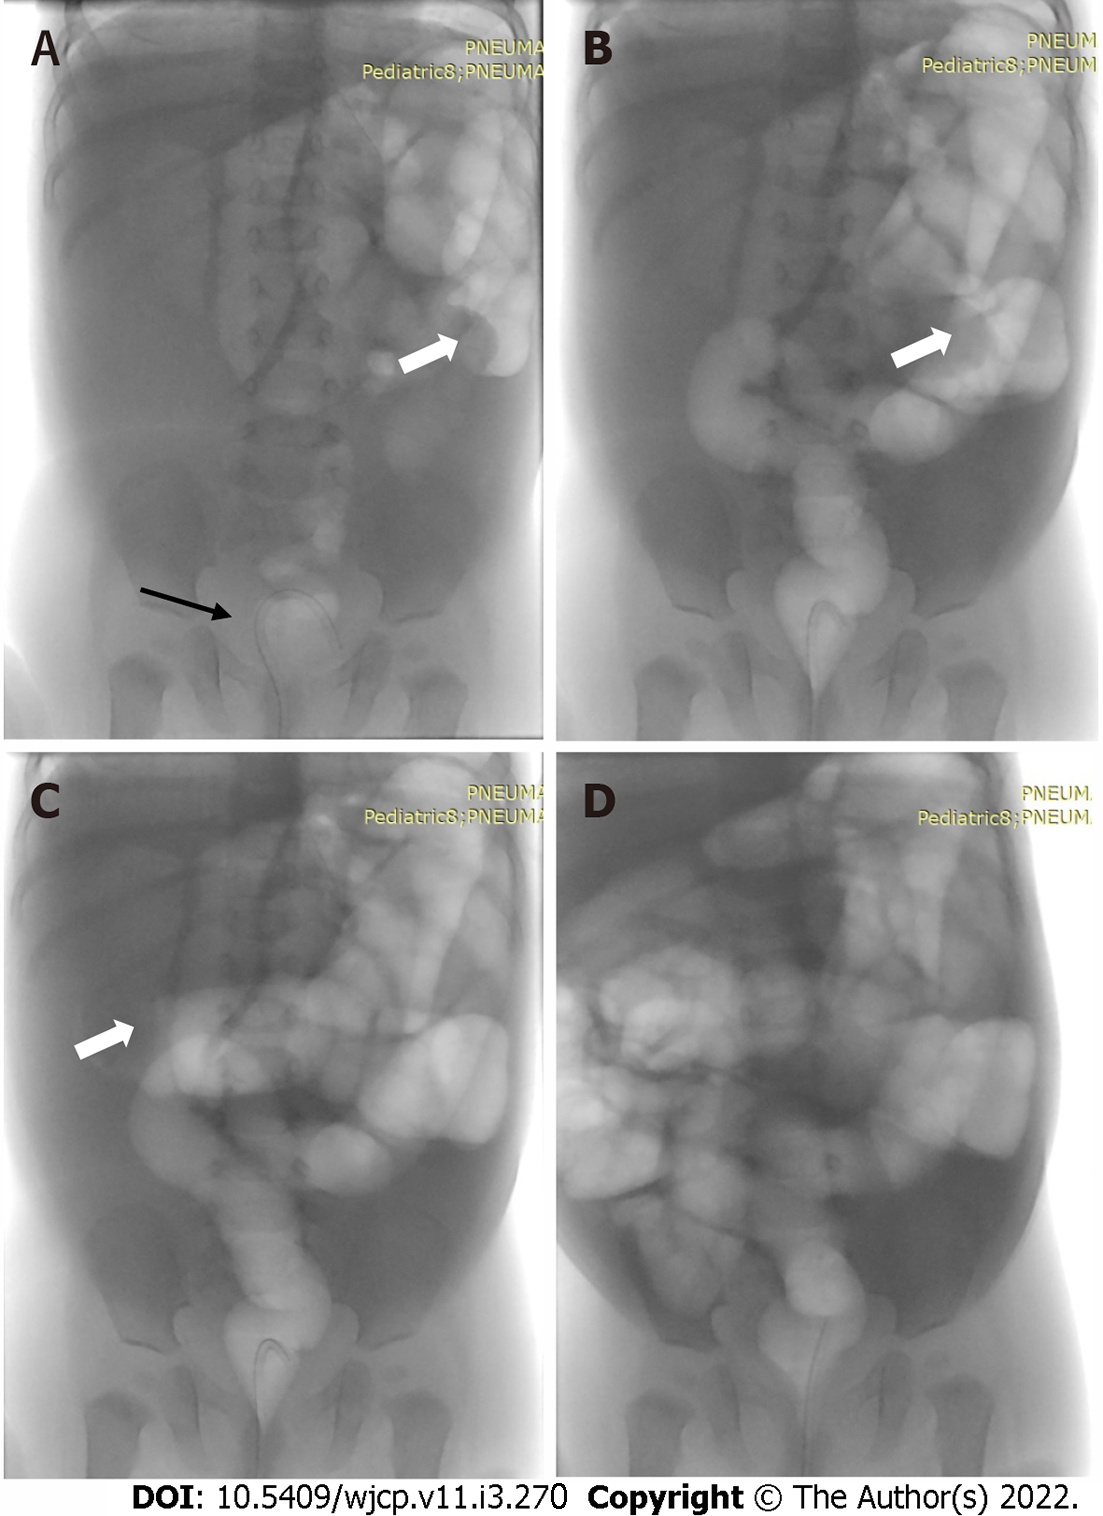
Figure 22 Pneumatic reduction of intussusception under fluoroscopy.
A: The patient is positioned supine with a feeding tube within the rectum (black arrow); B and C: The intussusceptum is seen in the left hypochondrium (open arrow) given by the meniscus sign; subsequent spots after air inflation show that the intussusceptum has moved proximally, as well as reflux of air in the small bowel after successful reduction (D) of the intussusception.
- Citation: Chandel K, Jain R, Bhatia A, Saxena AK, Sodhi KS. Bleeding per rectum in pediatric population: A pictorial review. World J Clin Pediatr 2022; 11(3): 270-288
- URL: https://www.wjgnet.com/2219-2808/full/v11/i3/270.htm
- DOI: https://dx.doi.org/10.5409/wjcp.v11.i3.270


