Copyright
©The Author(s) 2022.
World J Clin Pediatr. Jan 9, 2022; 11(1): 71-84
Published online Jan 9, 2022. doi: 10.5409/wjcp.v11.i1.71
Published online Jan 9, 2022. doi: 10.5409/wjcp.v11.i1.71
Figure 1 Three-dimensional echocardiographic reconstruction of the delineation of right ventricular ejection fraction.
The endocardial border is traced throughout the cardiac cycle using speckle tracking, and the software automatically locates end-systolic and end-diastolic frames. Example of a four-dimensional echocardiographic reconstruction of the delineation of the right ventricle seen from the septal side (end-diastolic volume 68.8 mL, end-systolic volume 16.9 mL, and ejection fraction 75.5%). The mesh is the right ventricle at end-diastole, in green at end-systole. The pulmonary valve is shown in white on the upper left side, the tricuspid valve is shown on the upper right side, and the right ventricular apex toward the bottom.
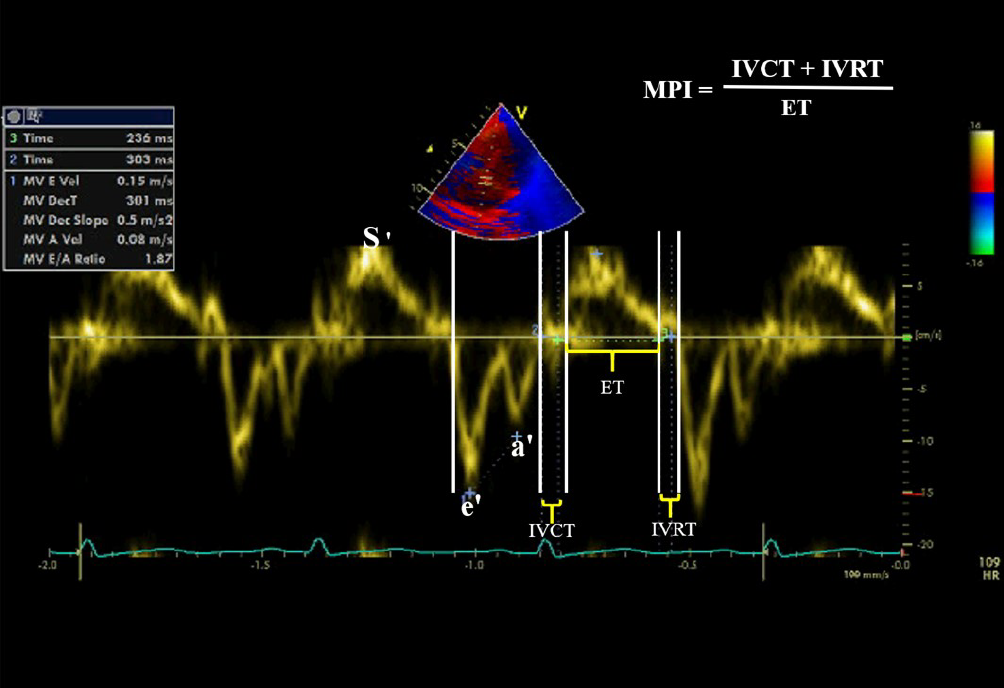
Figure 2 Tissue Doppler echocardiography of septal annulus showed the main tissue waves (S, e´ and a´ waves) and how to calculate Myocardial Performance Index.
e´ and a´ Early and late filling waves by tissue Doppler; S wave: Myocardial systolic excursion velocity. IVCT: Isovolumic contraction time; IVRT: Isovolumic relaxation time; MPI: Myocardial Performance Index; ET: Ejection time.
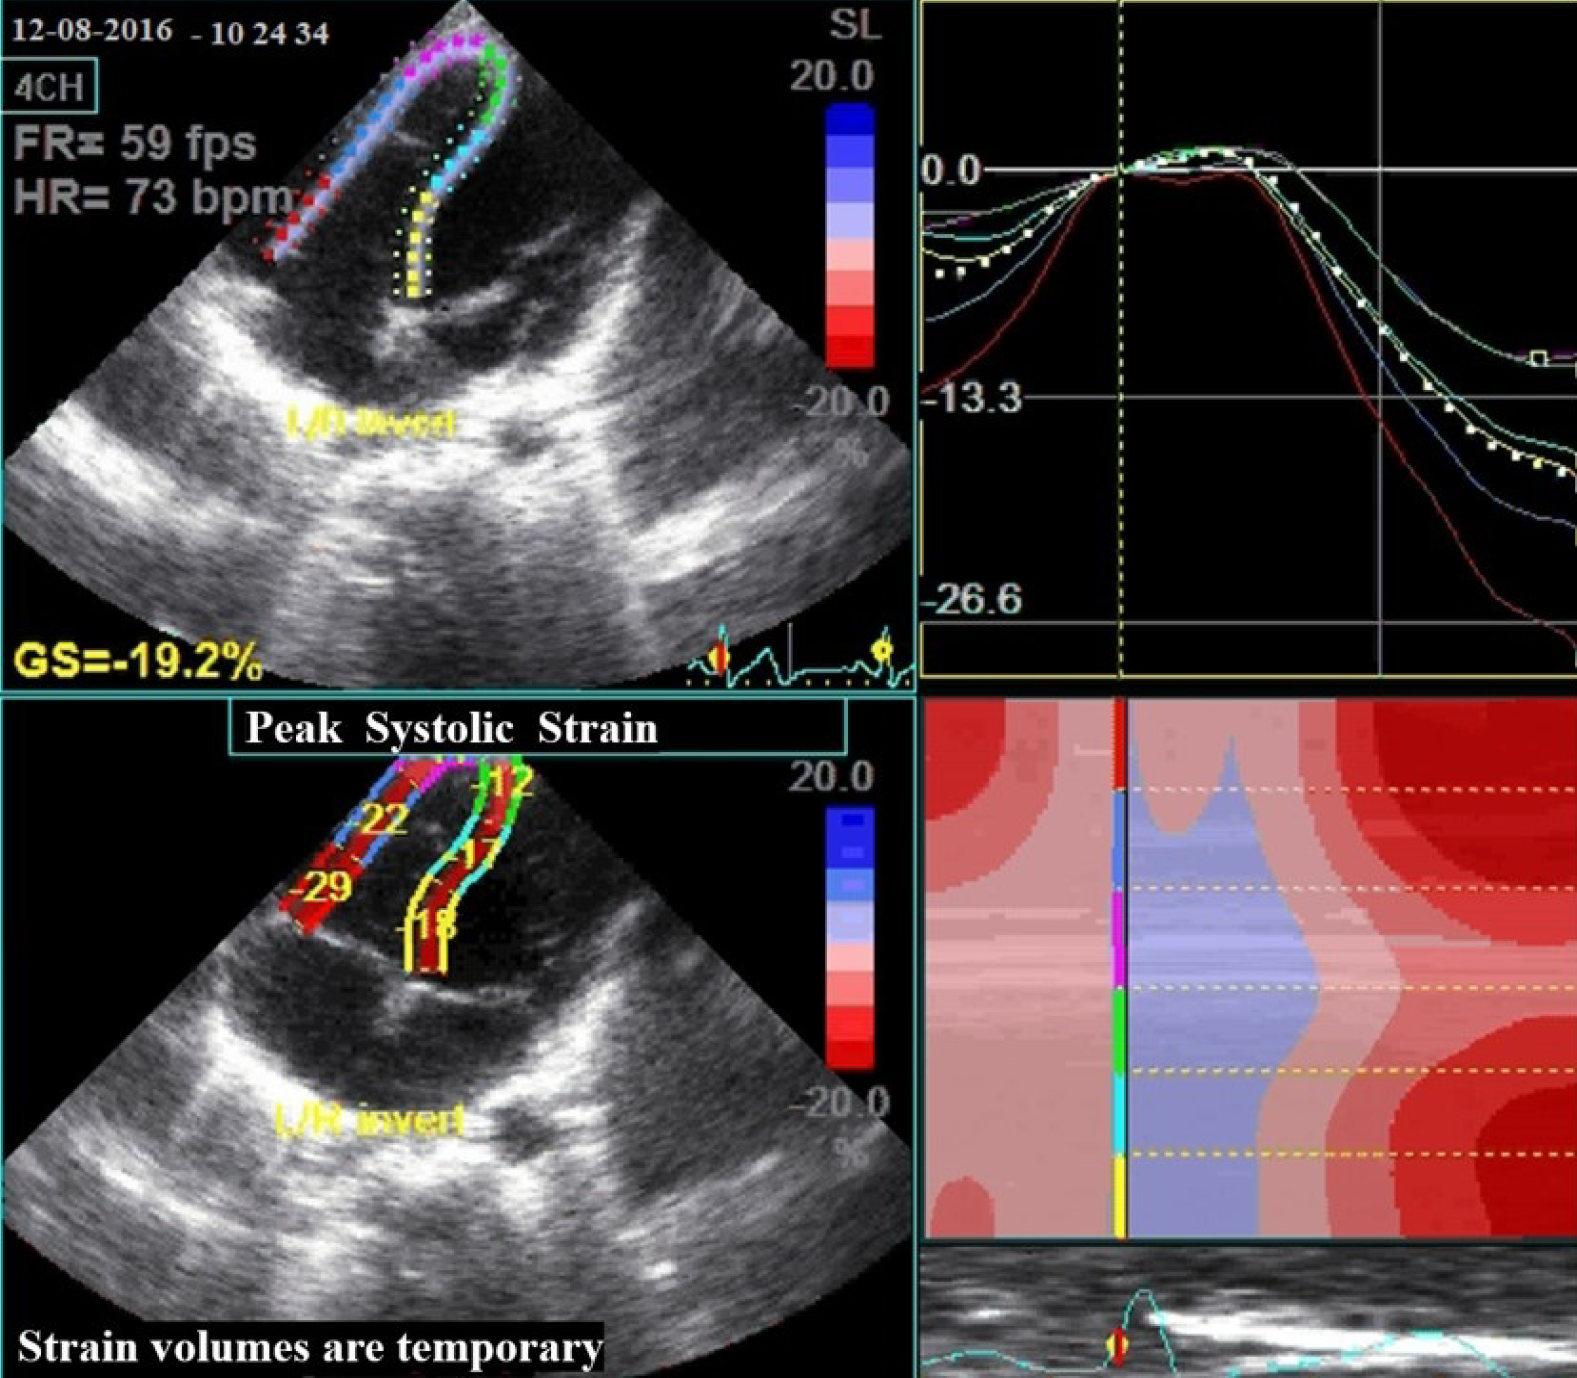
Figure 3 Right ventricular global longitudinal strain measures of a healthy child from the standard four-apical views using two-Dimension speckle tracking method.
The upper left quadrant shows tracking. The right half shows color-coded segmental strain curves and average strain curve (dashed line). The lower left quadrant depicts an anatomic M-mode. The dashed yellow line = Time to peak (from R-wave to maximum systolic strain.
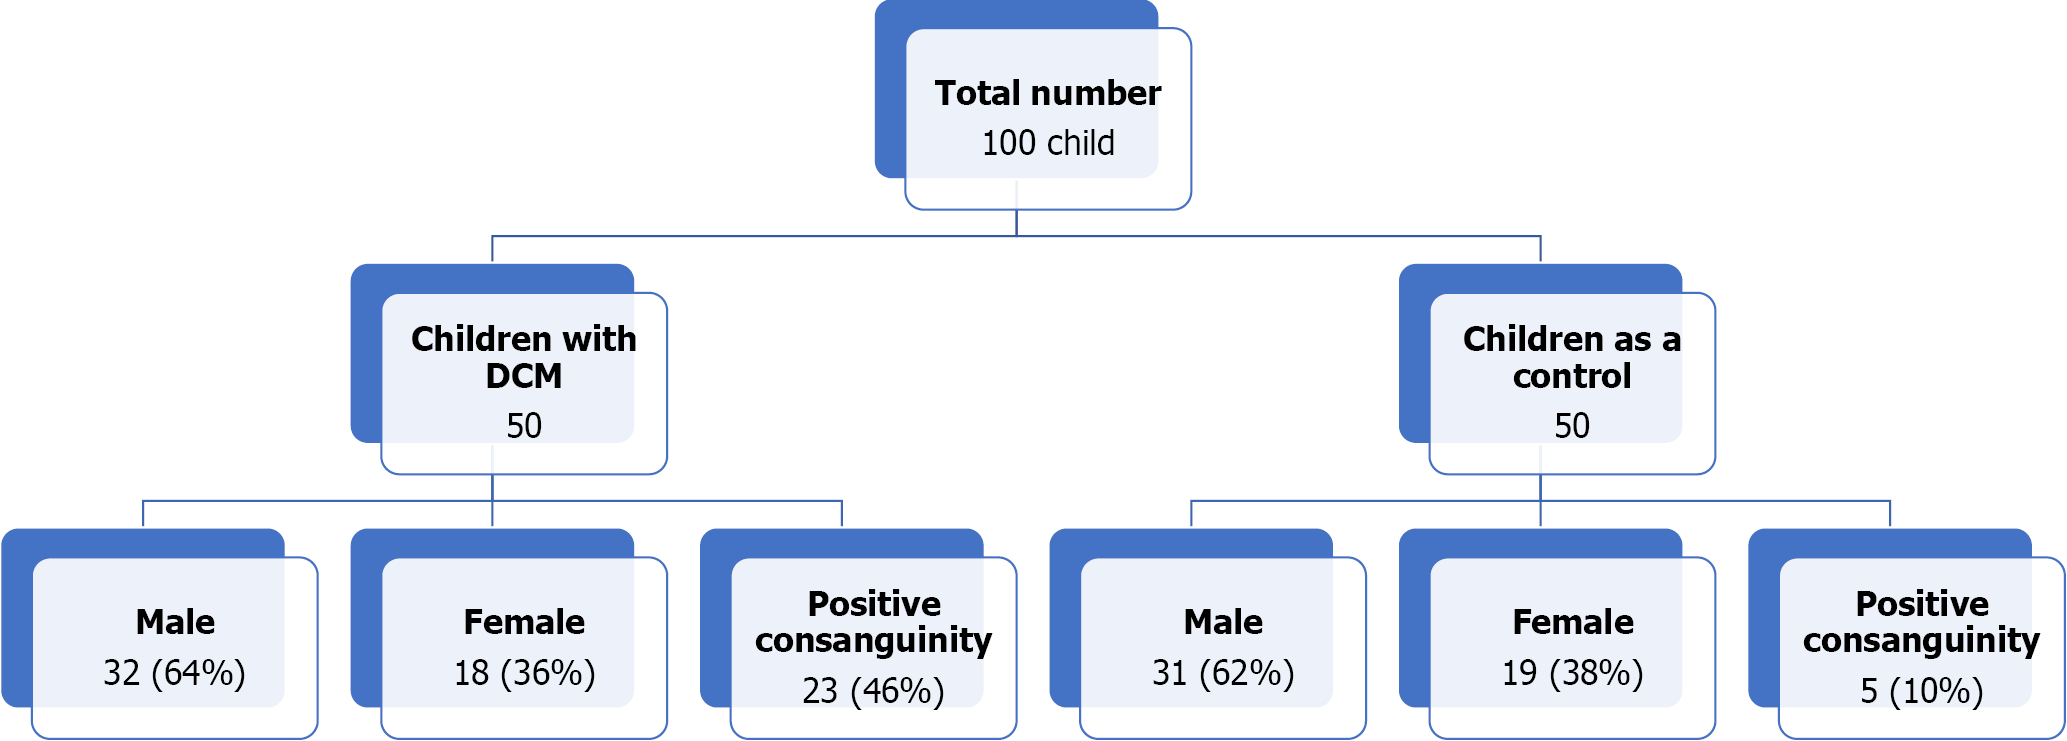
Figure 4 The flow chart of the study.
DCM: During dilated cardiomyopathy.
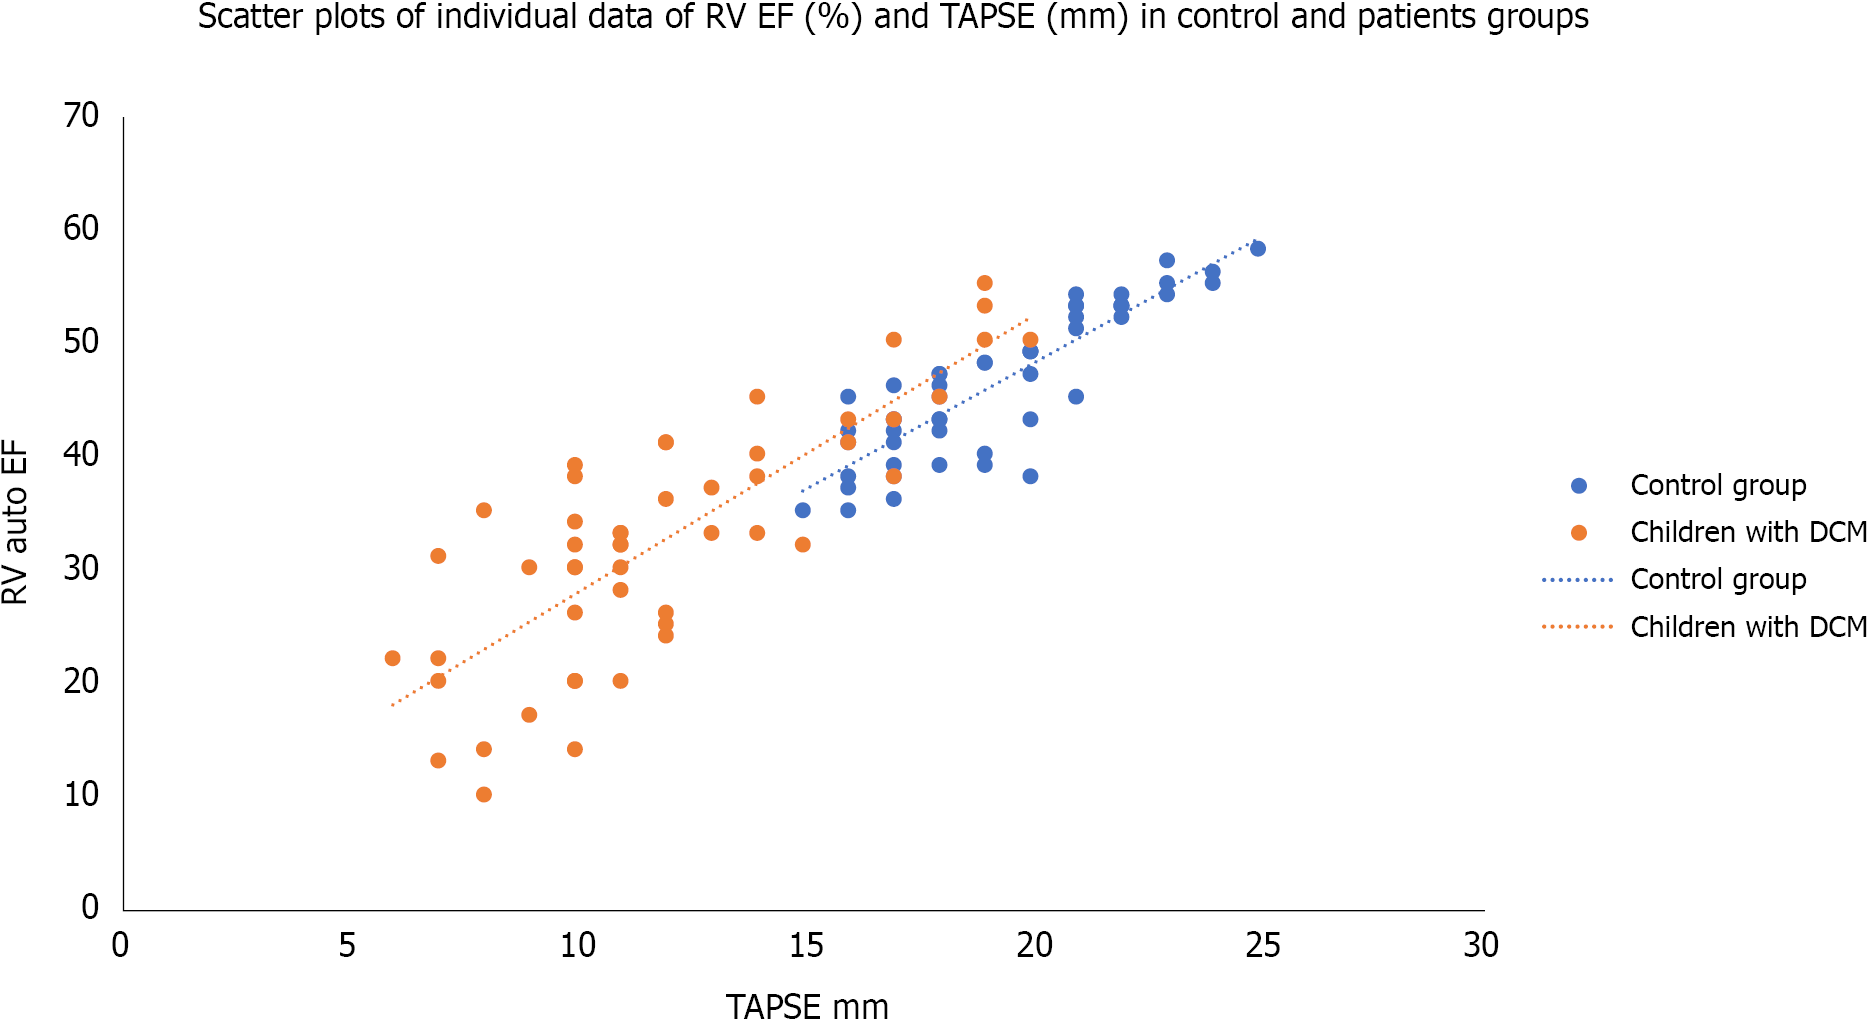
Figure 5 Scatter plots of individual data of Right Ventricular Ejection Fraction (%) and tricuspid annular plane systolic excursion (mm) in control and patients’ groups.
DCM: During dilated cardiomyopathy; RV EF: Right ventricular ejection fraction; TAPSE: Tricuspid annular plane systolic excursion.
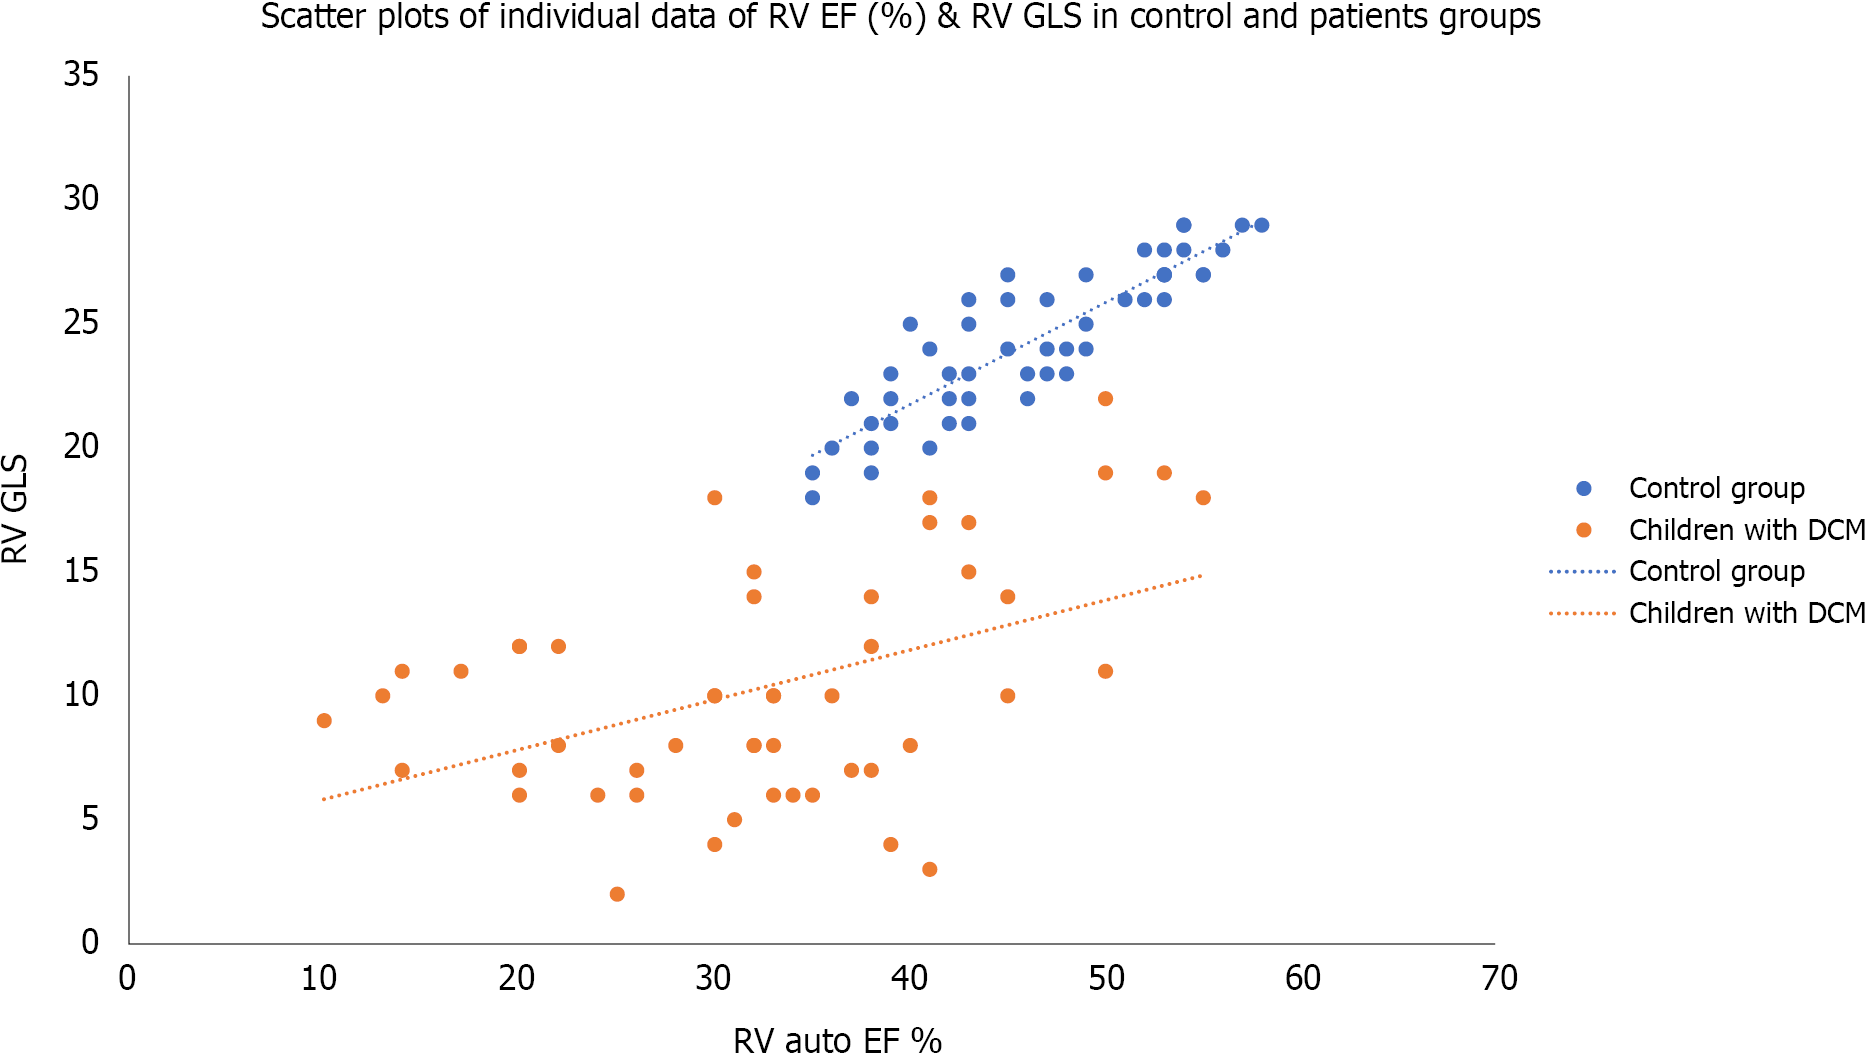
Figure 6 Scatter plots of individual data of right ventricular ejection fraction (%) and right ventricular global longitudinal strain (mm) in control and patients’ groups.
DCM: During dilated cardiomyopathy; RV EF: Right ventricular ejection fraction; GLS: Global longitudinal strains.
- Citation: Al-Biltagi M, Elrazaky O, Mawlana W, Srour E, Shabana AH. Tissue Doppler, speckling tracking and four-dimensional echocardiographic assessment of right ventricular function in children with dilated cardiomyopathy. World J Clin Pediatr 2022; 11(1): 71-84
- URL: https://www.wjgnet.com/2219-2808/full/v11/i1/71.htm
- DOI: https://dx.doi.org/10.5409/wjcp.v11.i1.71


