Copyright
©The Author(s) 2021.
World J Clin Pediatr. Nov 9, 2021; 10(6): 177-191
Published online Nov 9, 2021. doi: 10.5409/wjcp.v10.i6.177
Published online Nov 9, 2021. doi: 10.5409/wjcp.v10.i6.177
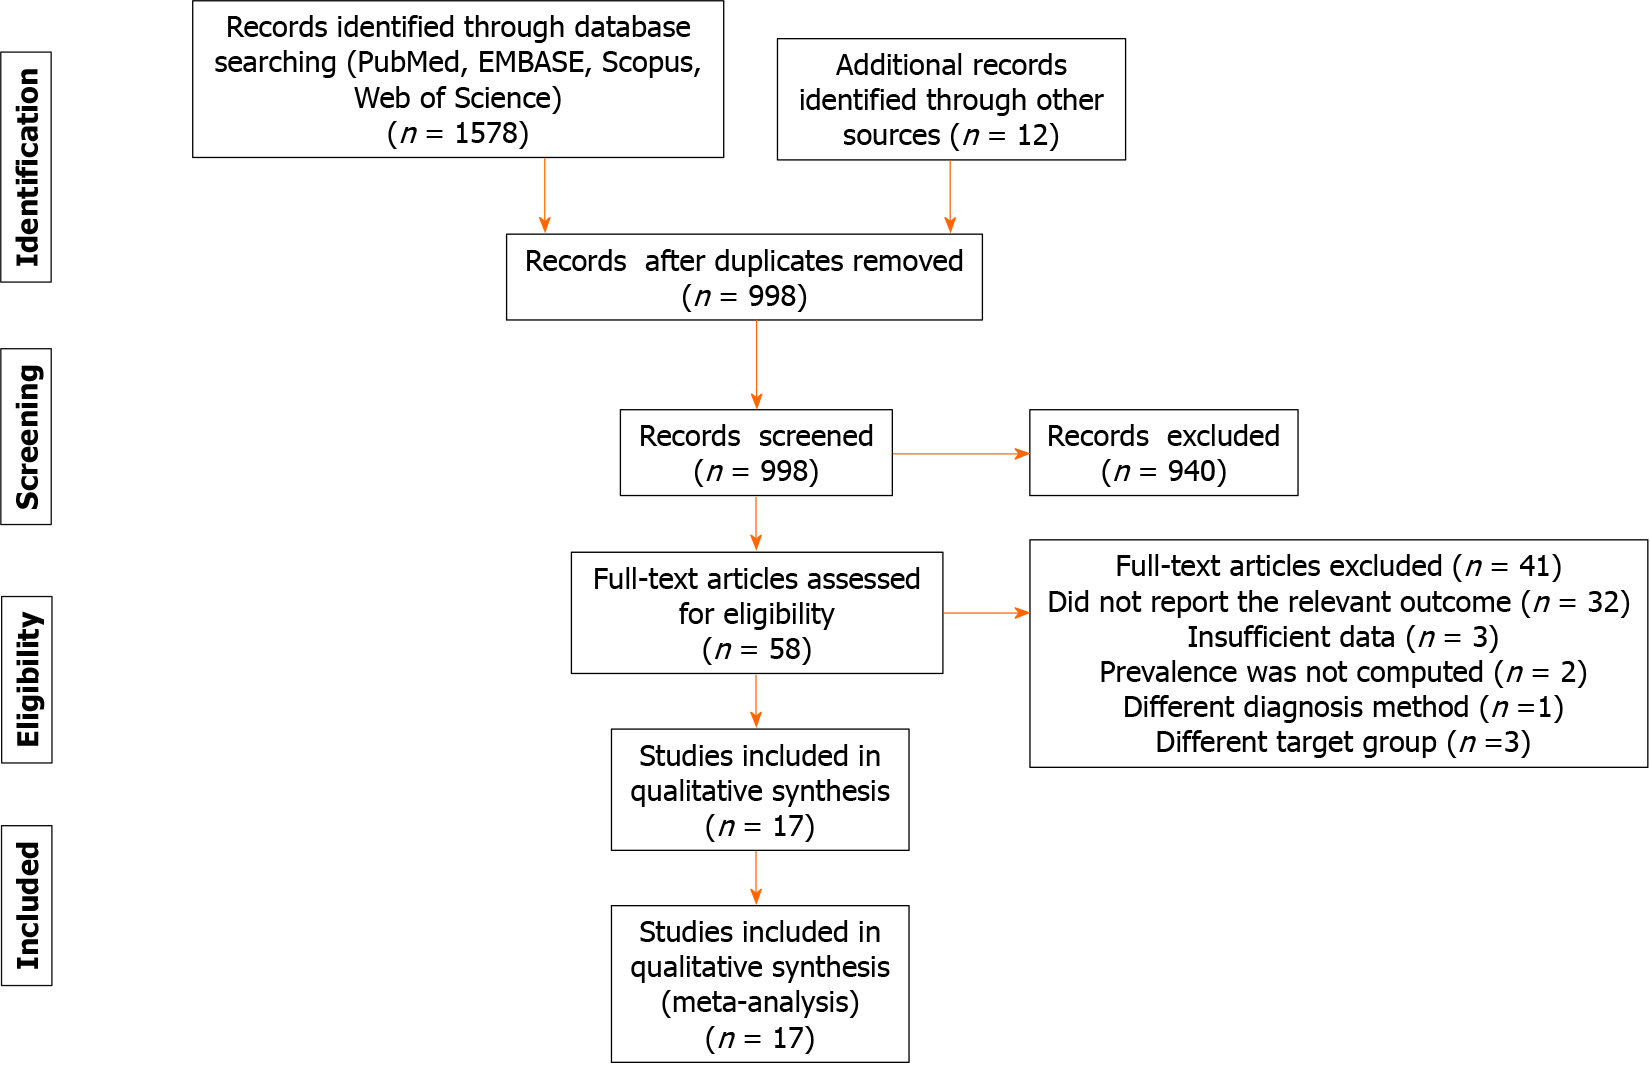
Figure 1 PRISMA flow chart diagram describing the process of identification and selection of studies for inclusion in the review.
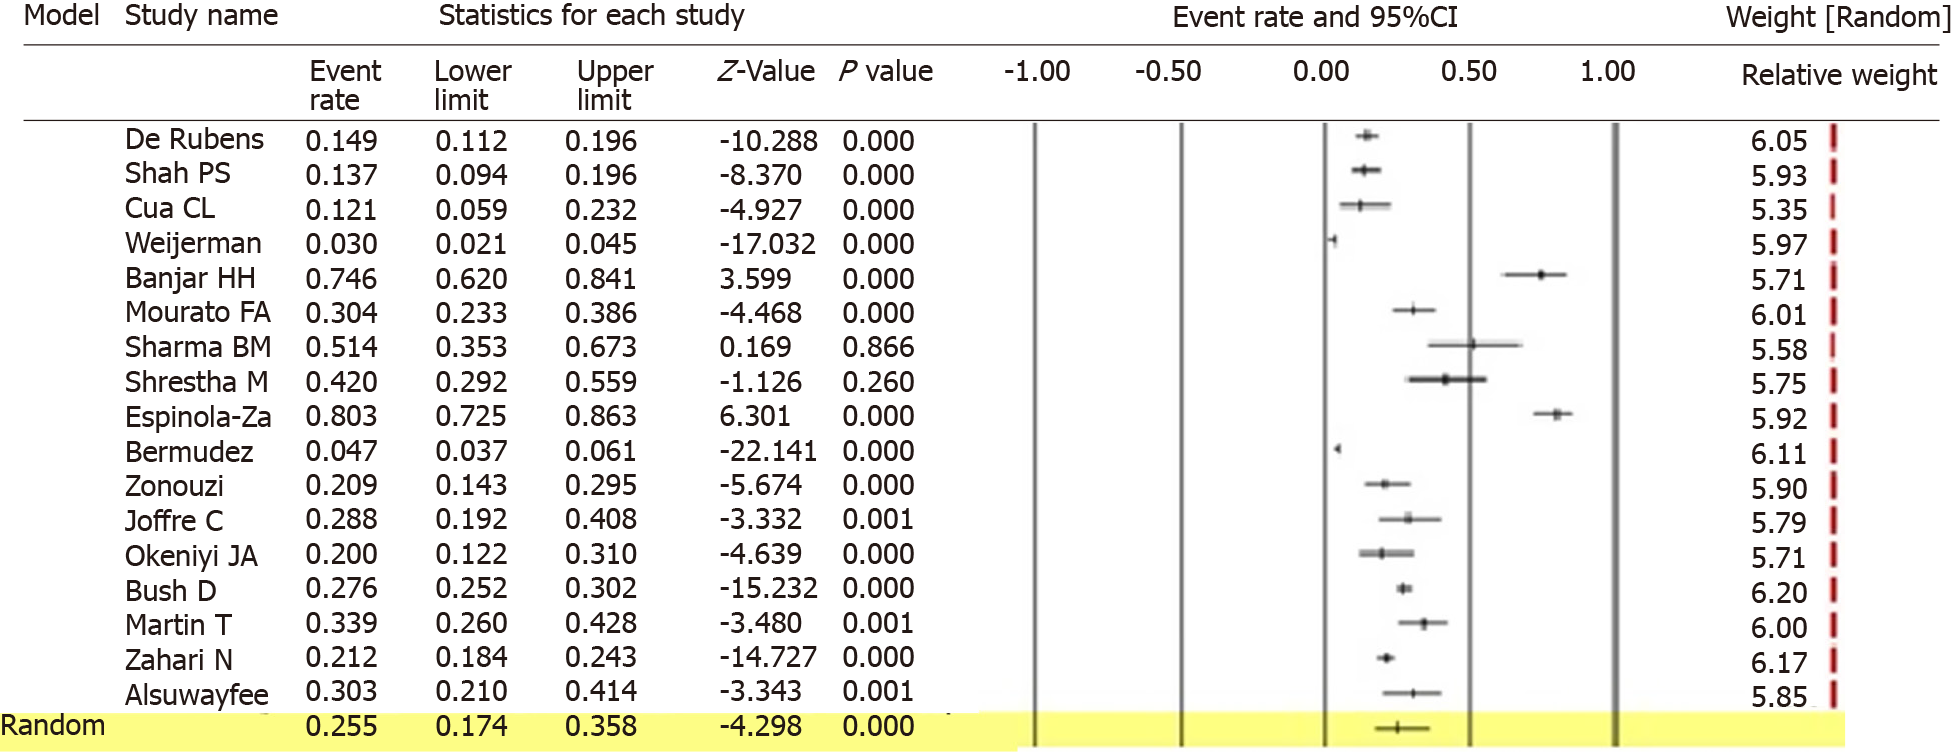
Figure 2 Forest plots of pulmonary hypertension prevalence among children with Down syndrome.
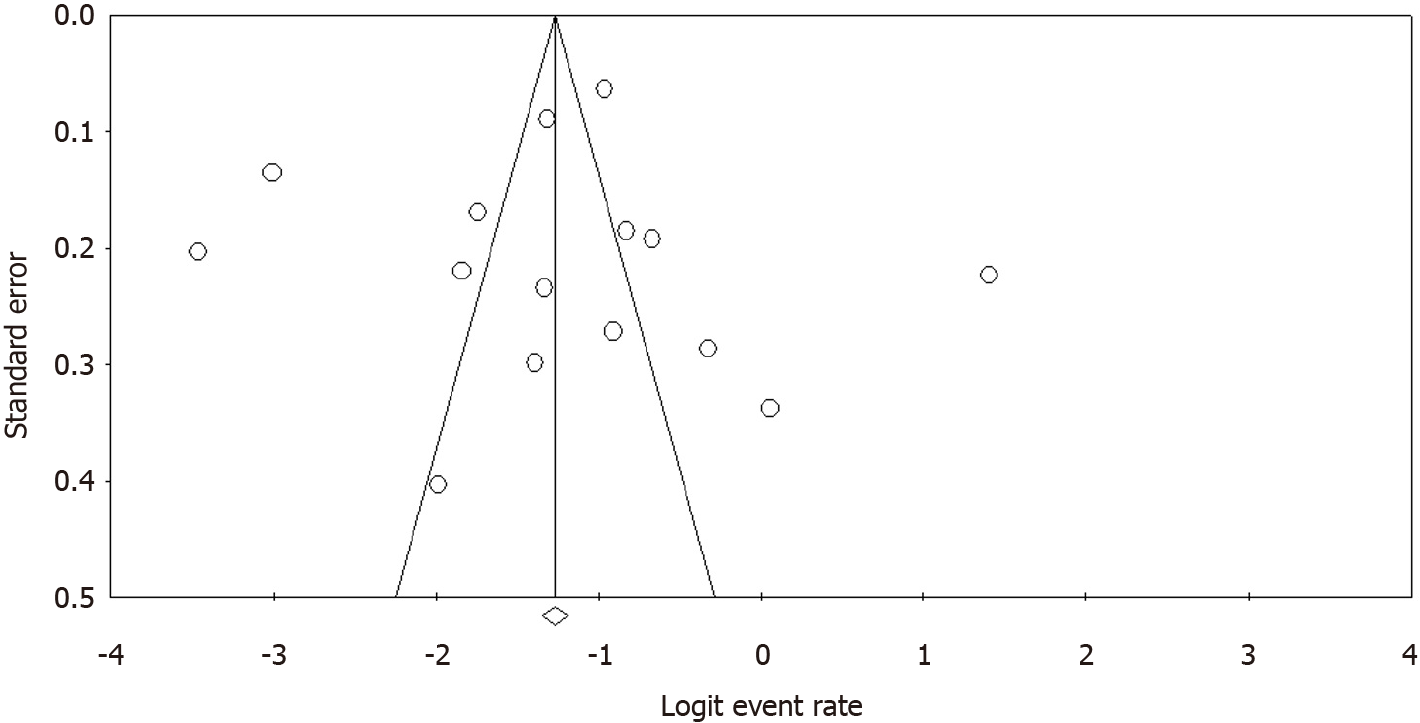
Figure 3 Funnel plots of pulmonary hypertension prevalence among children with Down syndrome.
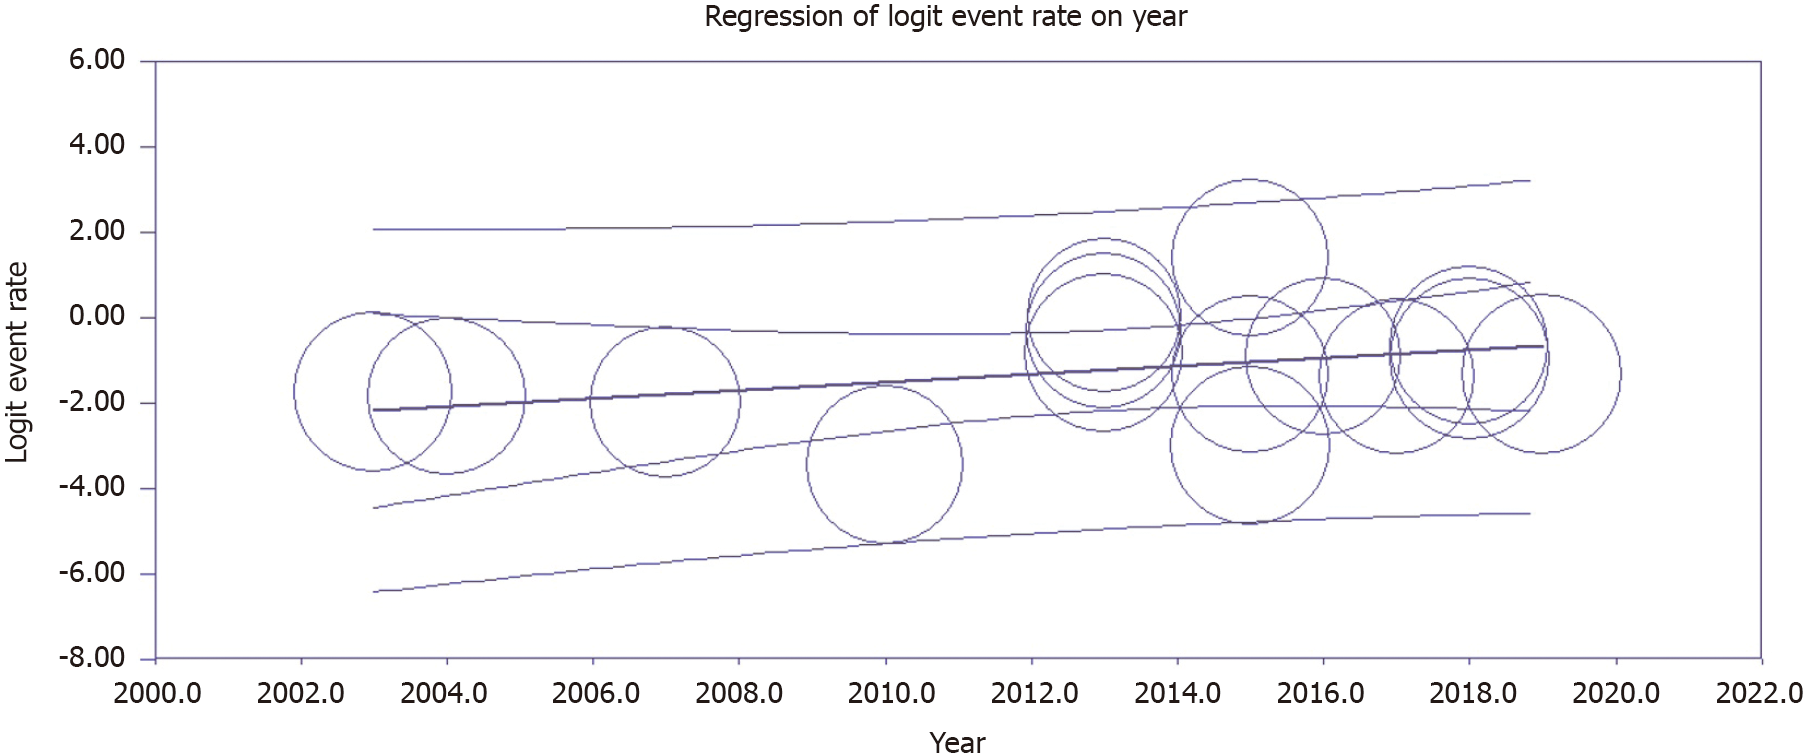
Figure 4 Meta-regression of pulmonary hypertension prevalence based on the year of the study.
- Citation: Taksande A, Pujari D, Jameel PZ, Taksande B, Meshram R. Prevalence of pulmonary hypertension among children with Down syndrome: A systematic review and meta-analysis. World J Clin Pediatr 2021; 10(6): 177-191
- URL: https://www.wjgnet.com/2219-2808/full/v10/i6/177.htm
- DOI: https://dx.doi.org/10.5409/wjcp.v10.i6.177


