Copyright
©The Author(s) 2019.
World J Stomatol. Dec 18, 2019; 7(3): 28-38
Published online Dec 18, 2019. doi: 10.5321/wjs.v7.i3.28
Published online Dec 18, 2019. doi: 10.5321/wjs.v7.i3.28
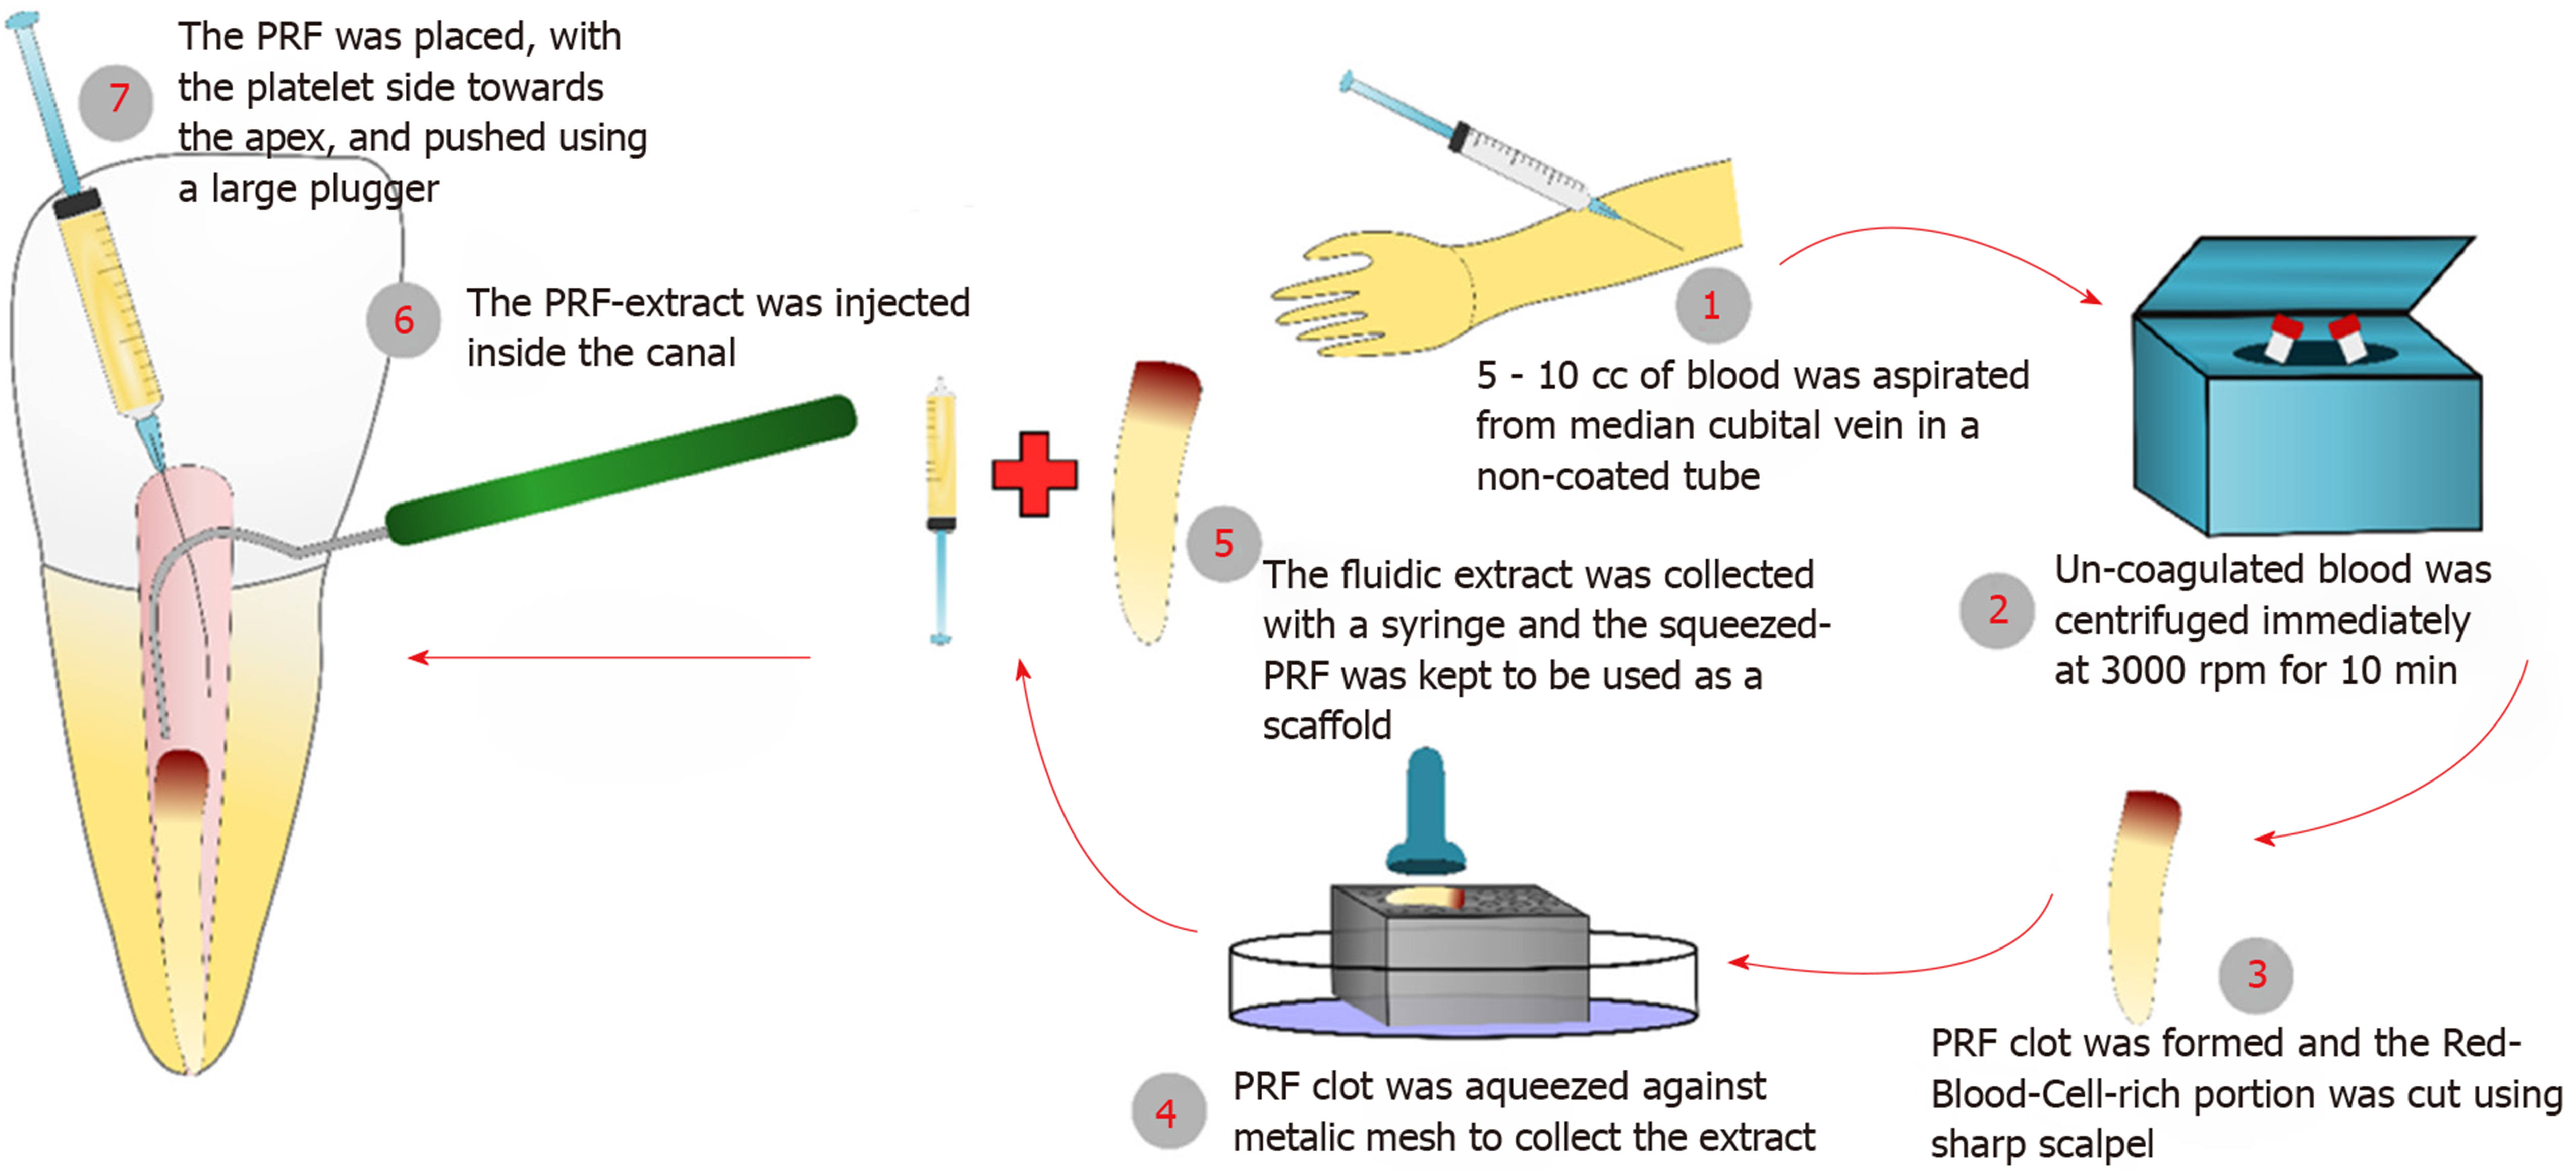
Figure 1 The preparation steps of platelet-rich fibrin and platelet-rich fibrin-extract, and how they were used for the regenerative endodontic treatments.
PRF: Platelet-rich fibrin.
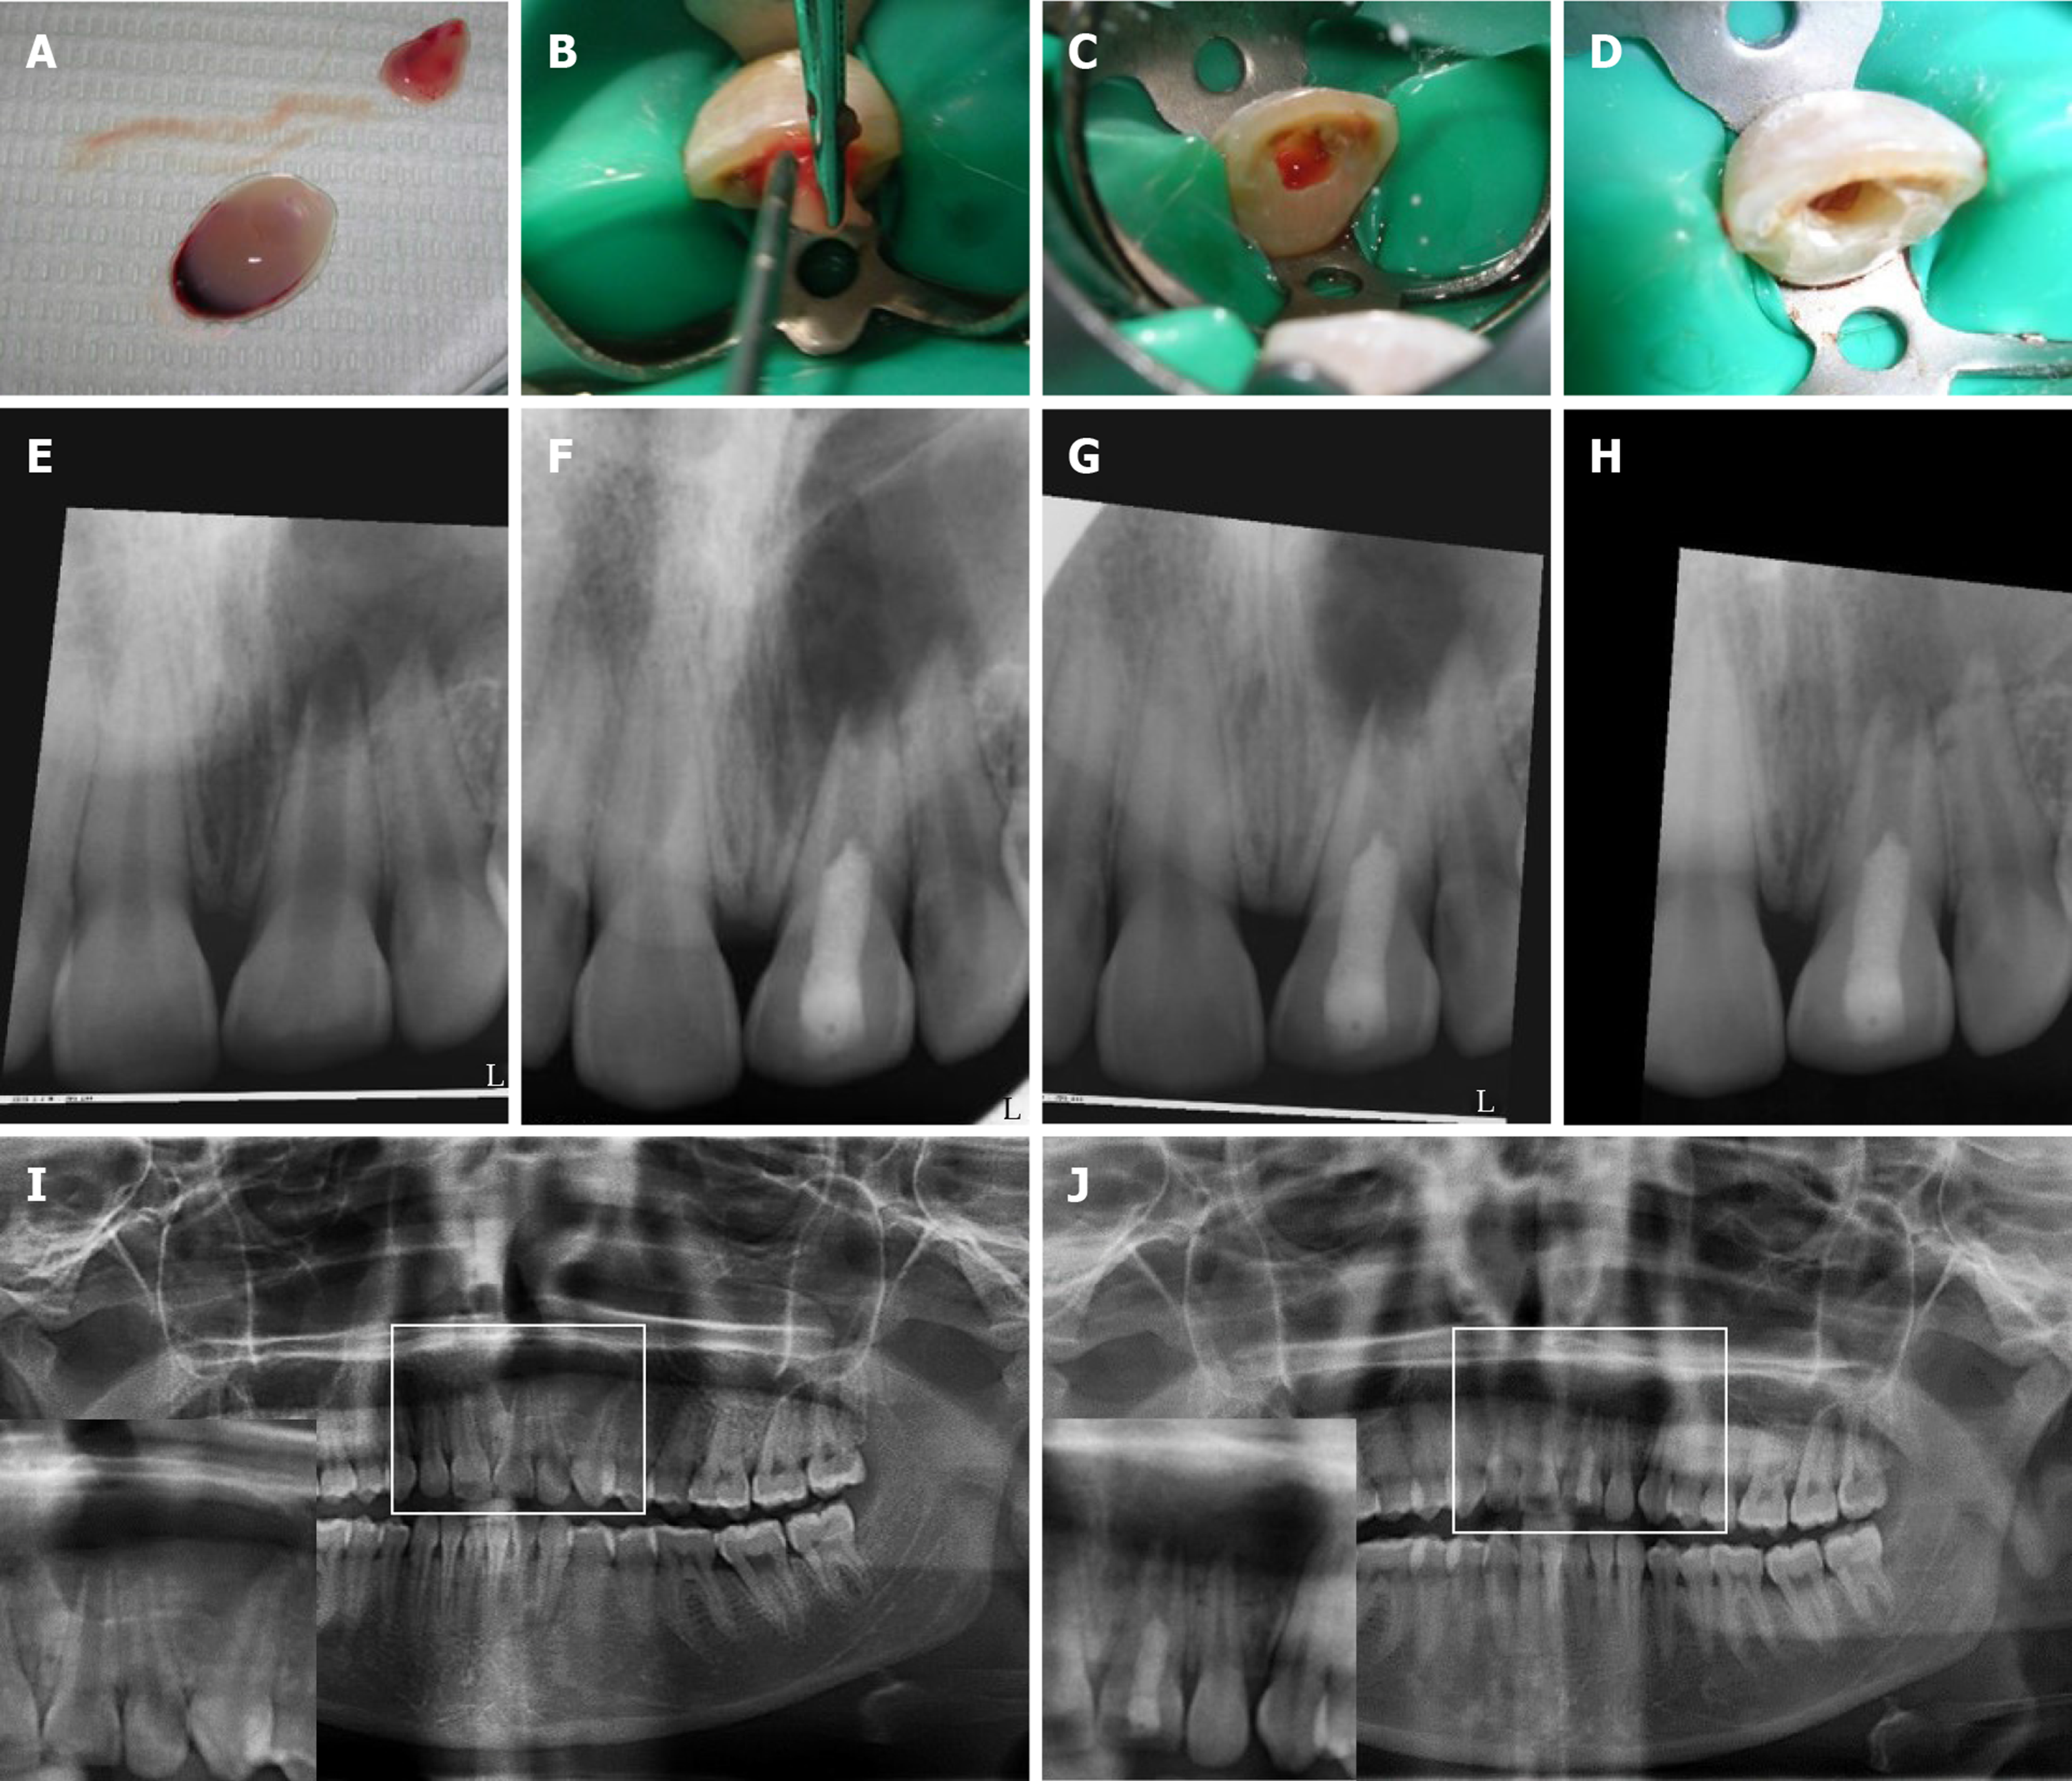
Figure 2 Revascularization procedure using platelet-rich fibrin and follow-up digital periapical radiographs and orthopantograms for case #1 (tooth #9).
A-D: Prepared platelet-rich fibrin (PRF) clots in A with insert showing squeezing of clots in a metallic mesh to release supernatant (extract); B: Packing of PRF clot into the root canal with platelet-plug facing apical tissues using sterile cotton pliers and endodontic pluggers; and removal of excess extract and cleaning of pulp chamber in C and D, respectively; E, F: Periapical radiographs of the case showing in E pre-operative radiograph; F: after 1 mo; G: After 3 mo and; H: After 9 mo; I, J: Show pre- and 9 mo post-revascularization panoramic radiographs using the same device, respectively. Inserts represent magnifications of the selected regions of interest shown in I and J, respectively. Follow-up radiographs show progress in healing of the periapical lesion in terms of both size and density. The lesion originally extended from the maxillary left central incisor to the mesial root surface of the left canine. Teeth were asymptomatic. The case was unfortunately lost to follow-up after 9 mo. All digital periapical radiographs were aligned using the Turboreg plugin- image J software (http://bigwww.epfl.ch/thevenaz/turboreg/).
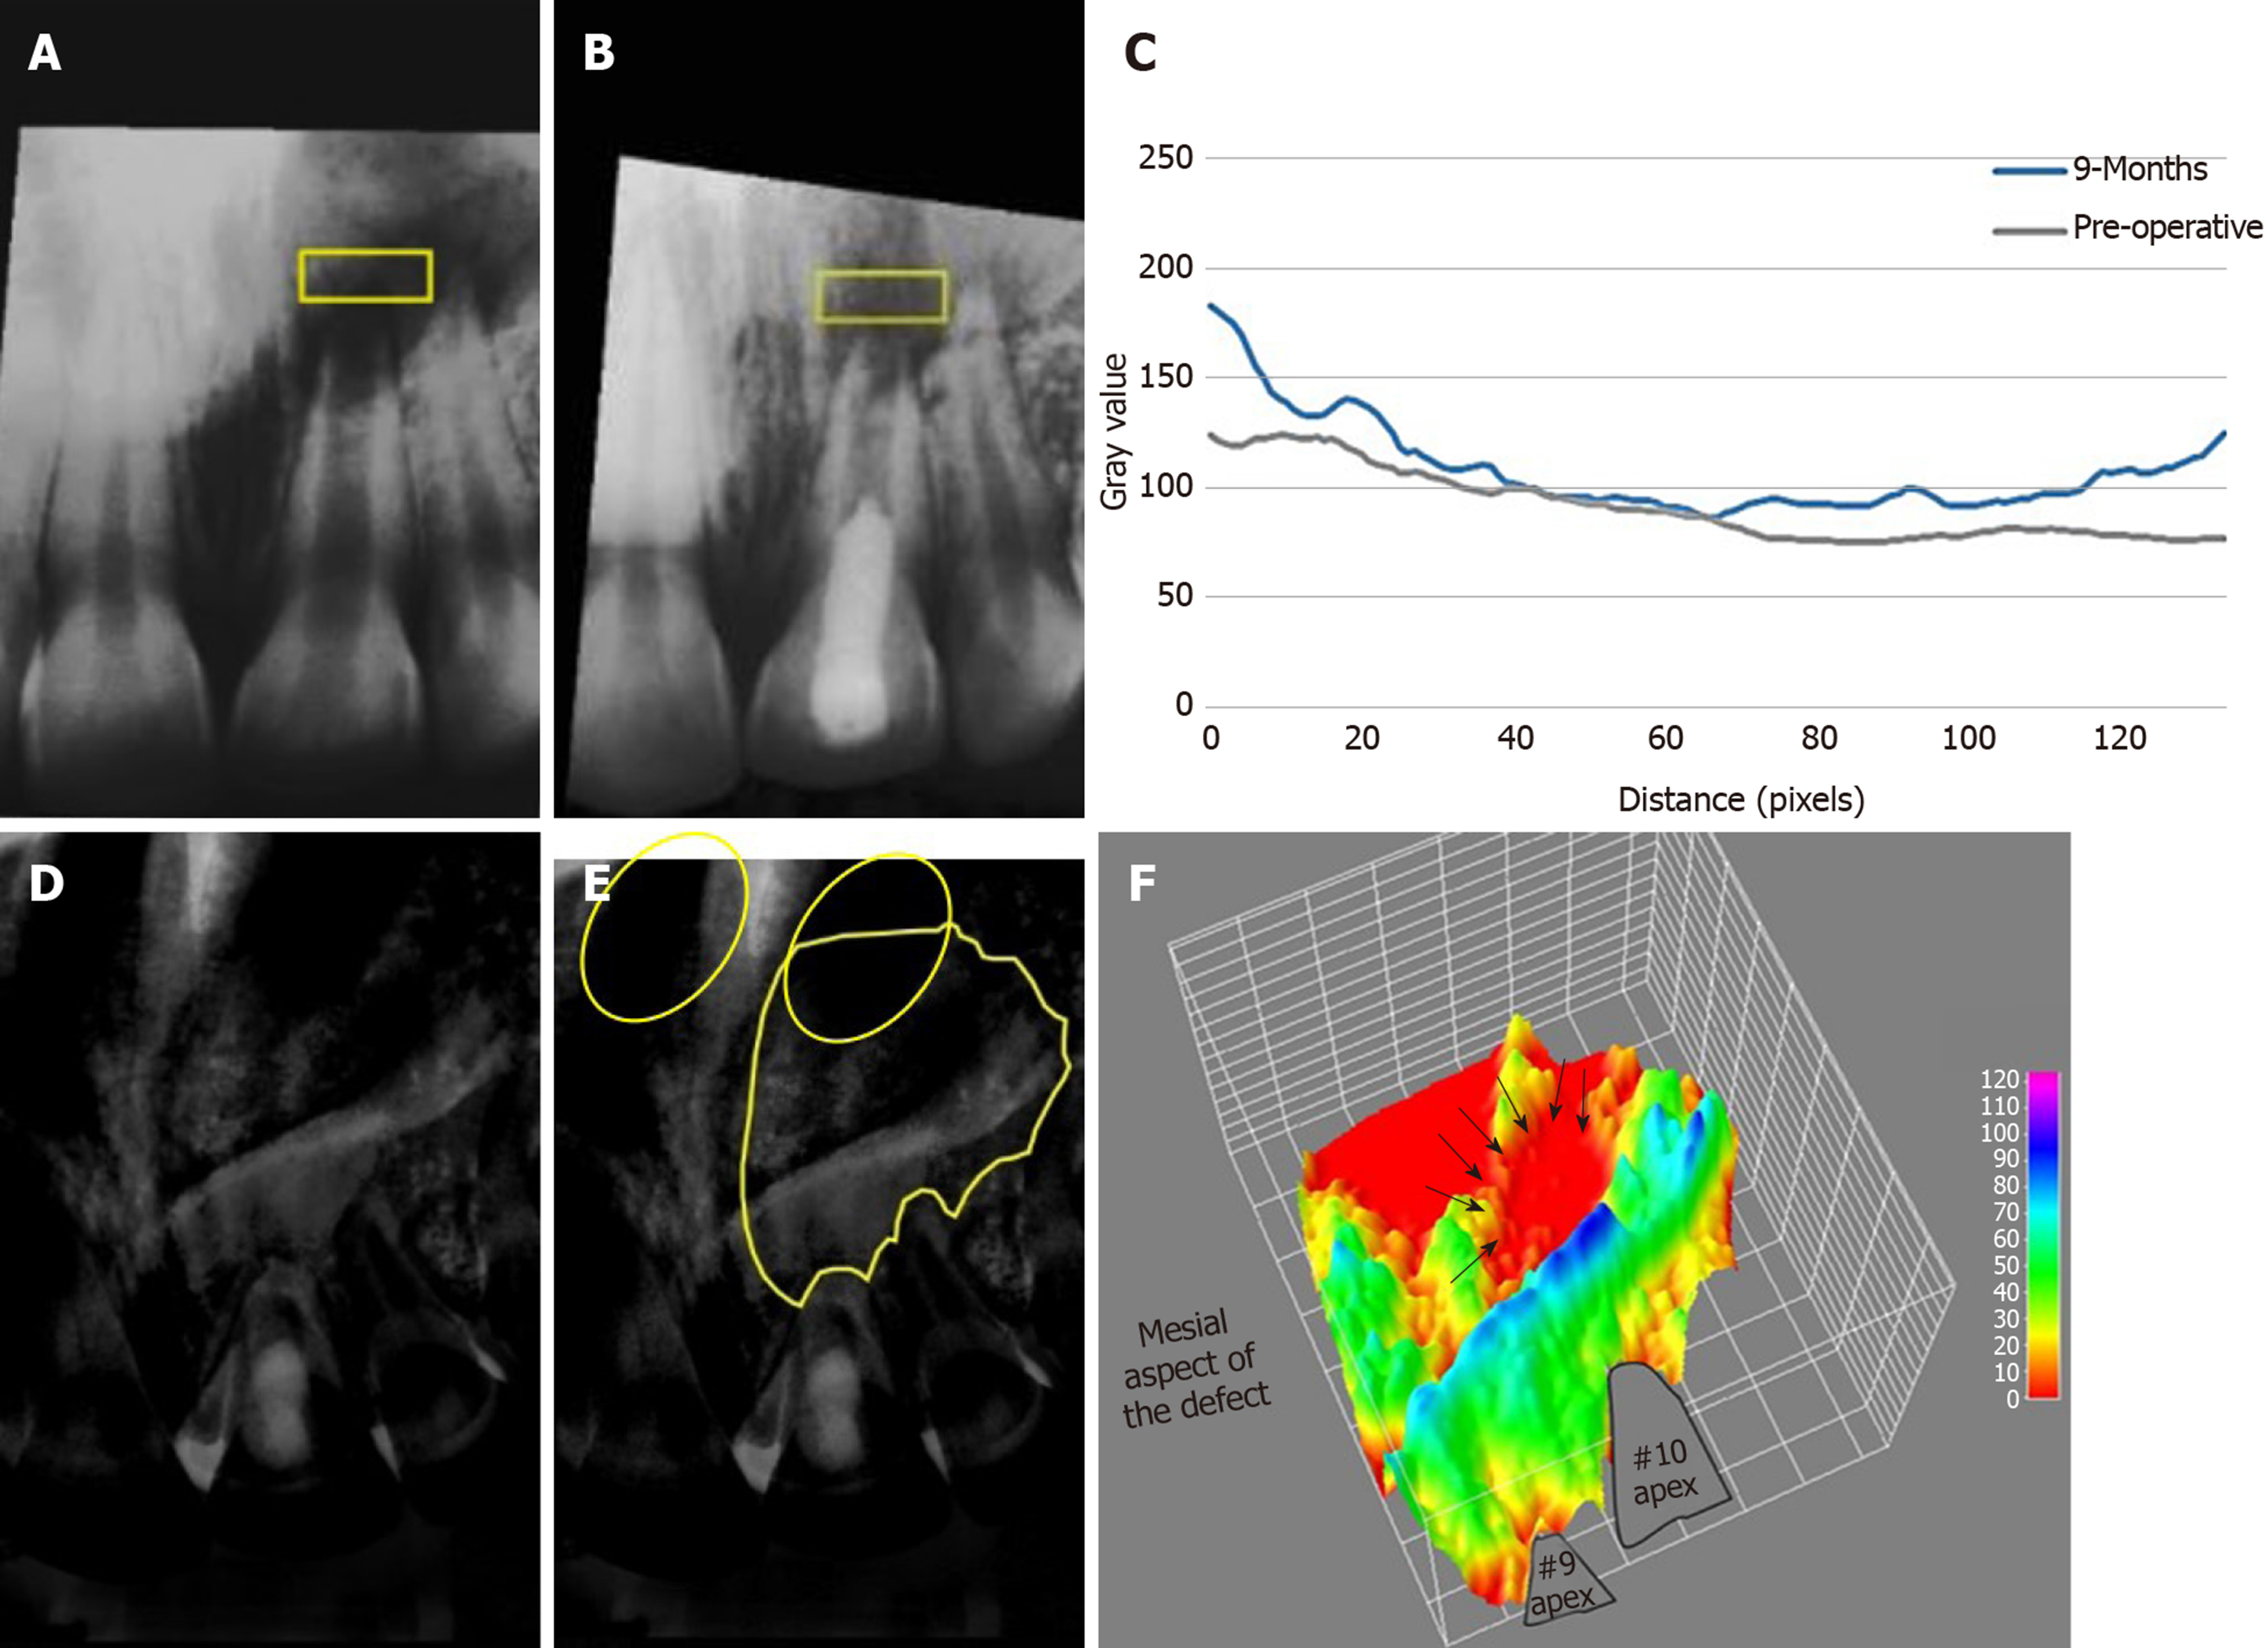
Figure 3 Showing average density changes of the periapical lesion in case#1.
A, B: Average density profile measurement of periapical lesion pre-operatively and after 9 mo, respectively in the selected region of interest (ROI); C: Graph displaying the grey value changes reflecting the increase in bone density after 9 mo; D, E: Image subtraction of occlusal radiographs before and after 9 mo, where E shows the traced ROI to be measured using 3D surface plotting. Note that the left nostril is superimposed with the upper border of the defect circles; F: 3D plot showing change in bone density corresponding to ROI selected in E. Areas in red represent those with the lowest density such as the nostril area and the center of the defect (arrows). The detailed method for measurement of bone density is available in the supplementary material.
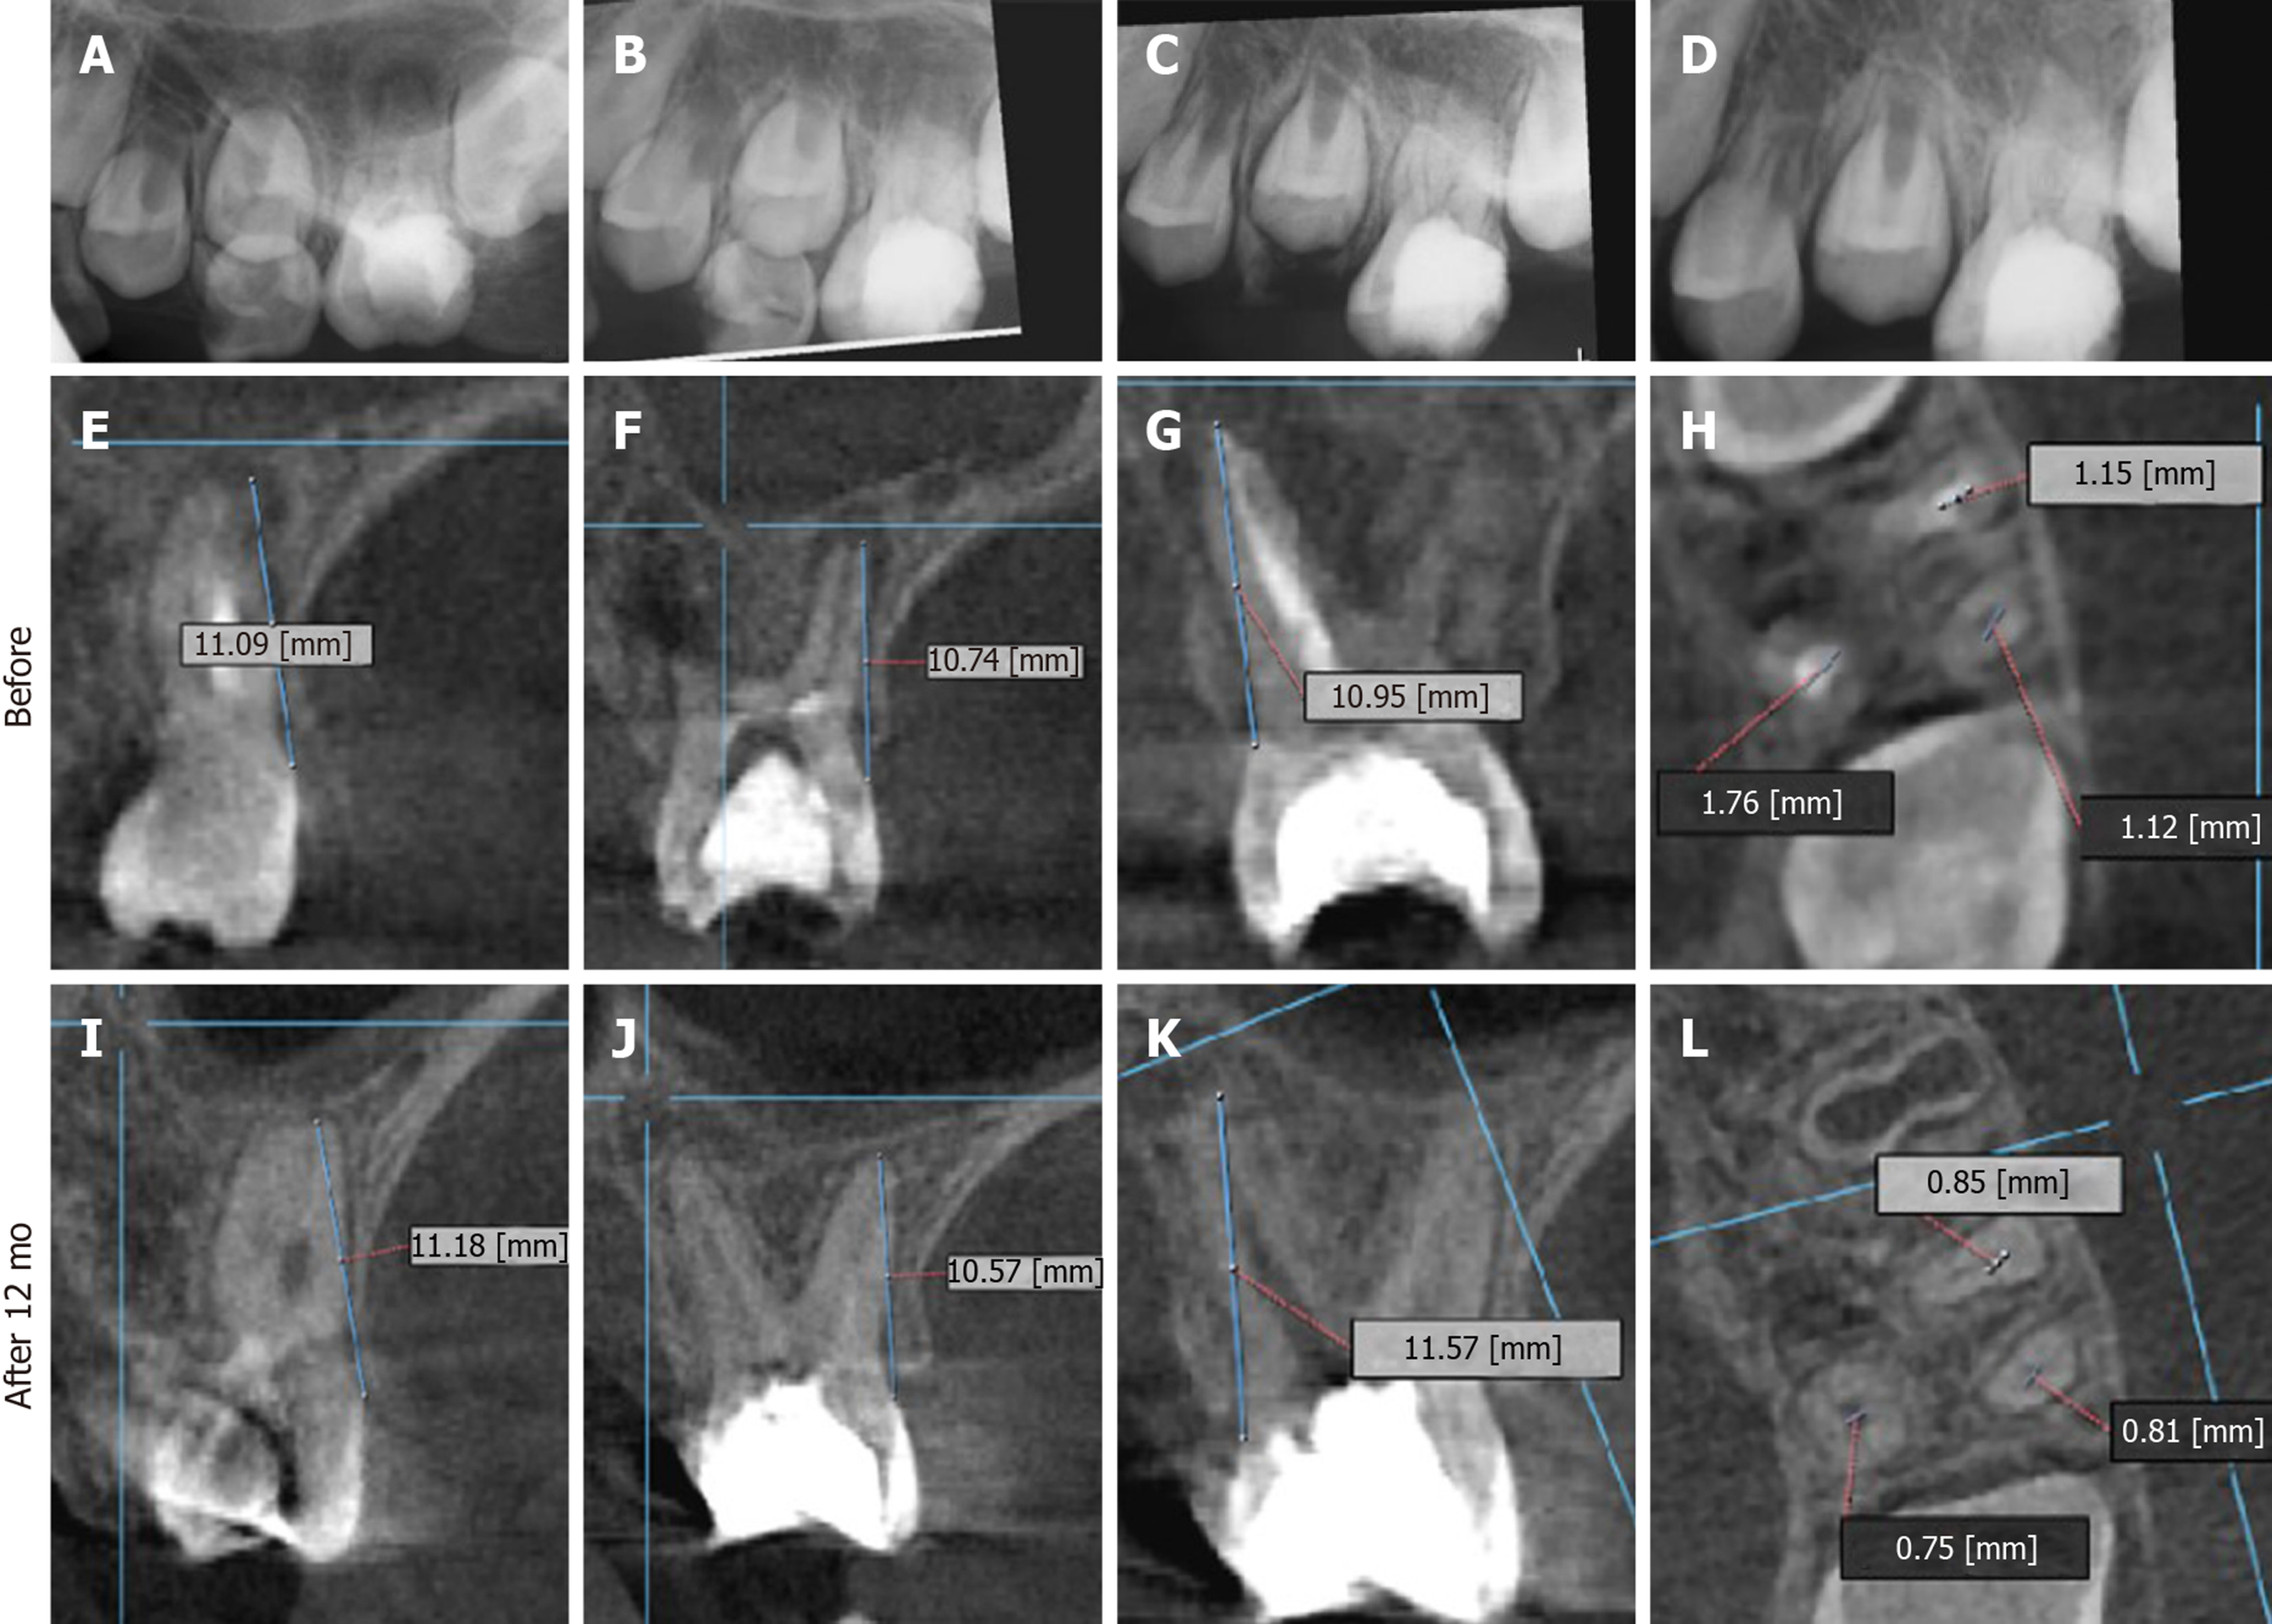
Figure 4 Twelve months periapical radiographs and cone beam computed tomography images of case #2 (tooth #14).
A-D: Digital periapical radiographs showing in an immediate post-operative radiograph; B: After 3 mo; C: After 6 mo and; D: After 12 mo; E-H: Cone beam computed tomography images (CBCT) images before the revascularization procedure (but after placement of intracanal medication); I-L: Follow-up after 12 mo; E, I: Mesial root; F, J: Distal root; G, K: Palatal root; H, L: Coronal section at apical third level showing the diameters of each root canal. All roots showed apical closure with complete periapical bone healing. Again, progress of periapical healing is evident along with root thickening and closure. The tooth remained asymptomatic throughout the follow-up period. All digital periapical radiographs were aligned using the Turboreg plugin- image J software (http://bigwww.epfl.ch/thevenaz/turboreg/). Details on the CBCT parameters and method are available in the supplementary material.
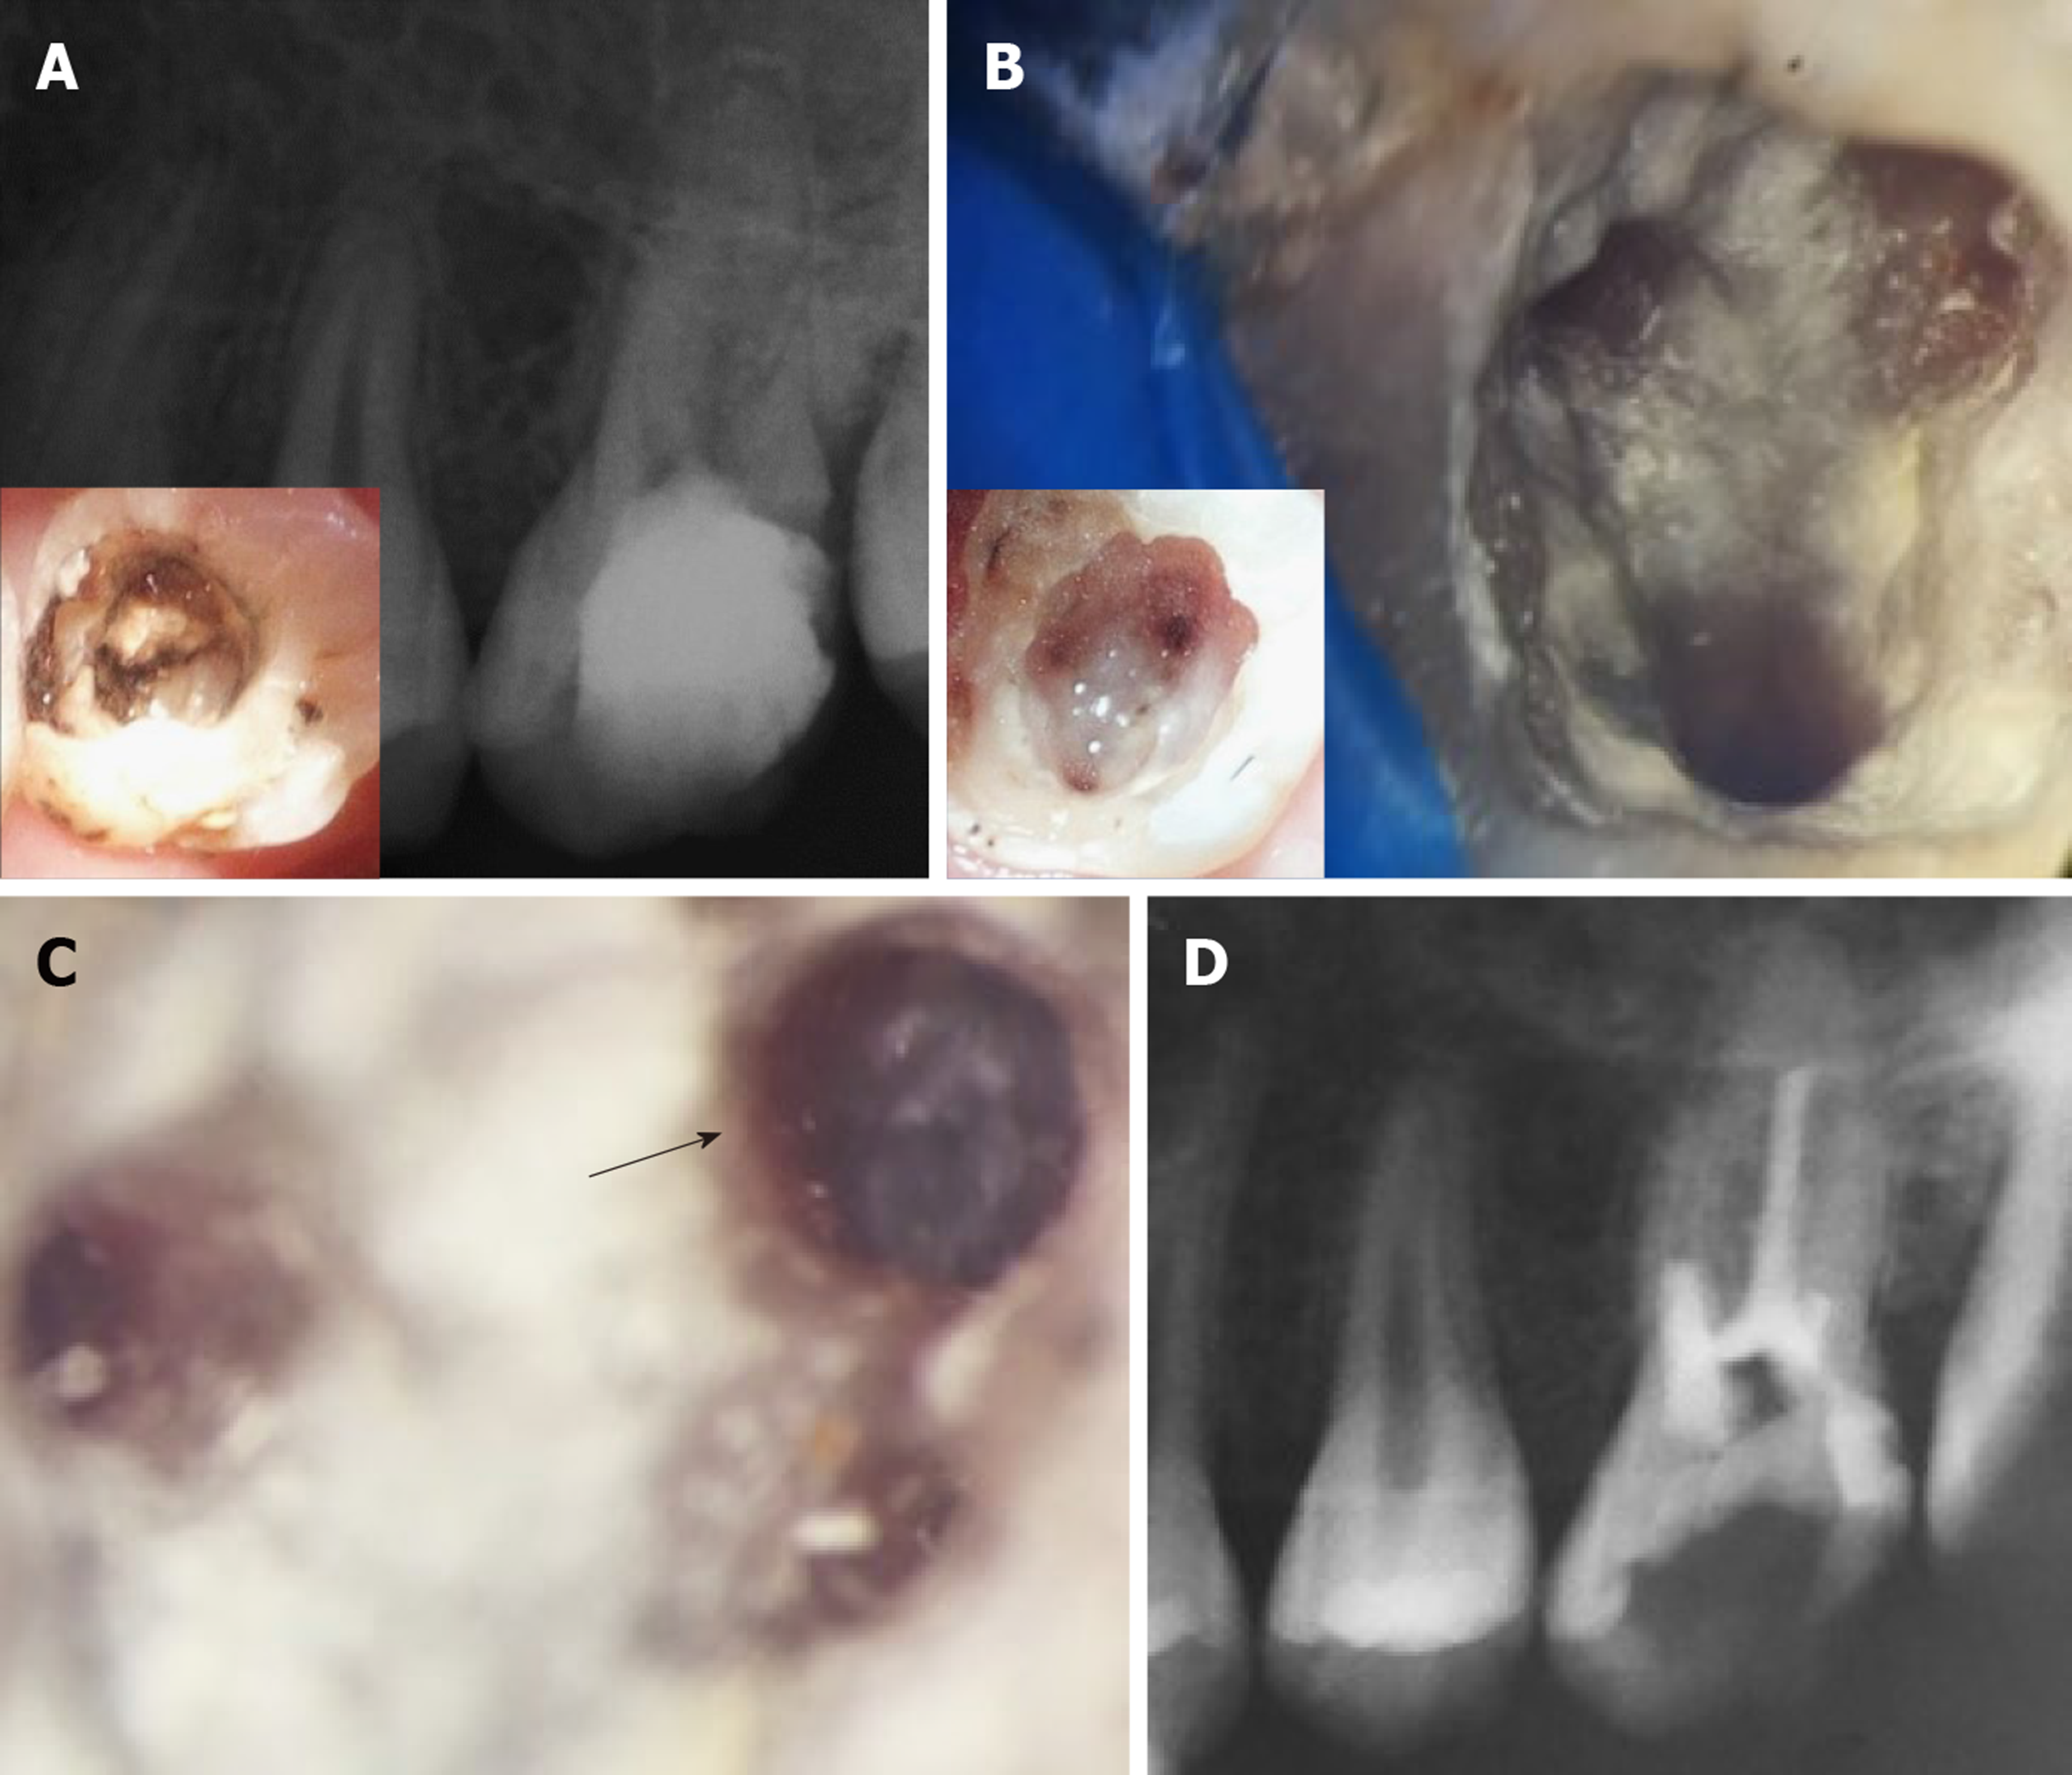
Figure 5 Four-year treatment outcome and re-treatment procedures for case #2 (tooth #14).
Figure shows the condition of the tooth after 4 years. A: The 4 years periapical radiograph showing recurrent decay on the distal surface of the tooth underneath the composite restoration. Insert in A shows the extent of the decay and the pulp chamber prior to complete removal of the MTA coronal plug. Note that the periapical tissues appear healthy; B: Shows the pulp chamber after removal of residual MTA material taken using a Kaaps dental operating microscope (x 10, Original magnification). Insert in B shows location of orifices. Minimal traces of fragmented tissues were retrieved from the pulp chamber; C: Higher magnification of the first mesiobuccal canal (x 25, original magnification) shows diffuse calcification and an obliterated canal beyond this level; D: Immediate post-operative radiograph showing root canal filling with gutta percha till the level of canal obliteration for the 4 canals. The maximum length reached was 16 mm for the palatal canal, 14 mm for the first mesiobuccal canal and 3 mm for the distobuccal canal while only the canal orifice was negotiated for the second mesiobuccal canal.
- Citation: Eltawila AM, El Backly R. Autologous platelet-rich-fibrin-induced revascularization sequelae: Two case reports. World J Stomatol 2019; 7(3): 28-38
- URL: https://www.wjgnet.com/2218-6263/full/v7/i3/28.htm
- DOI: https://dx.doi.org/10.5321/wjs.v7.i3.28


