Copyright
©The Author(s) 2016.
World J Respirol. Jul 28, 2016; 6(2): 49-53
Published online Jul 28, 2016. doi: 10.5320/wjr.v6.i2.49
Published online Jul 28, 2016. doi: 10.5320/wjr.v6.i2.49
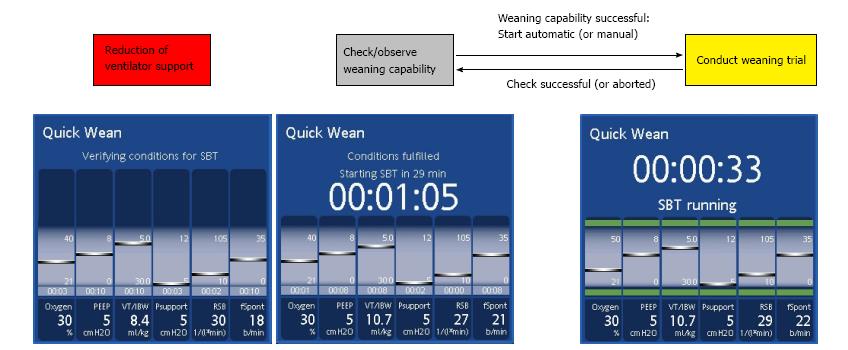
Figure 1 Timeline of the three phases of the QuickWean process.
PEEP: Positive end-expiratory pressure; SBT: Spontaneous breathing trial; SpO2: Peripheral oxygen saturation; PetCO2: Pulmonary end-tidal carbon dioxide.
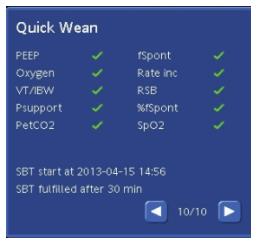
Figure 2 Screenshot of the QuickWean results panel showing a successful result.
PEEP: Positive end-expiratory pressure; SBT: Spontaneous breathing trial; SpO2: Peripheral oxygen saturation; PetCO2: Pulmonary end-tidal carbon dioxide.
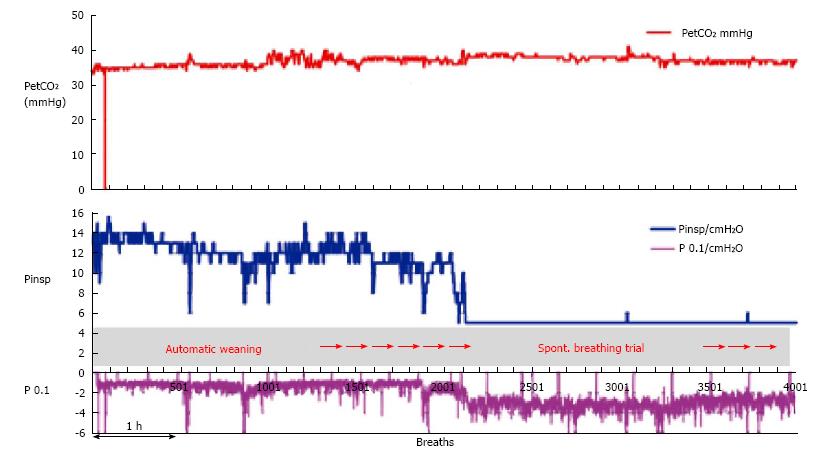
Figure 3 Trends of pulmonary end-tidal carbon dioxide, inspiratory pressure and P 0.
1 recorded during a QuickWean process in a patient in the intensive care unit. PetCO2: Pulmonary end-tidal carbon dioxide; Pinsp: Inspiratory pressure.
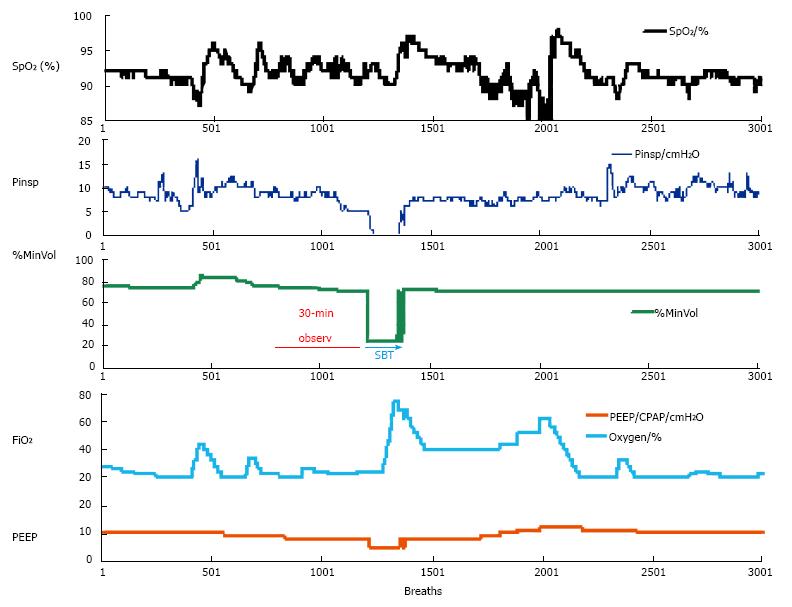
Figure 4 Trends of oxygen saturation (SpO2, %), inspiratory pressure (Pinsp, cmH2O), minimal minute ventilation (MinVol, %), FiO2 (%) and positive end-expiratory pressure (PEEP, cmH2O) of a patient during the QuickWean process.
- Citation: Belliato M. Automated weaning from mechanical ventilation. World J Respirol 2016; 6(2): 49-53
- URL: https://www.wjgnet.com/2218-6255/full/v6/i2/49.htm
- DOI: https://dx.doi.org/10.5320/wjr.v6.i2.49


