Copyright
©The Author(s) 2015.
World J Respirol. Nov 28, 2015; 5(3): 188-198
Published online Nov 28, 2015. doi: 10.5320/wjr.v5.i3.188
Published online Nov 28, 2015. doi: 10.5320/wjr.v5.i3.188
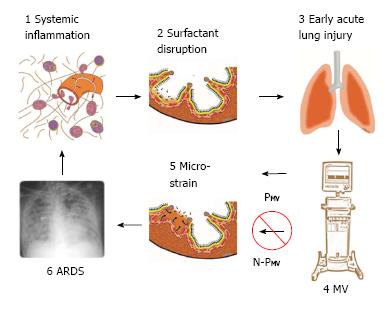
Figure 1 Pathogenesis of acute respiratory distress syndrome.
1: Systemic inflammation, also know as the systemic inflammatory response syndrome (SIRS) activates white blood cells and increases vascular permeability (red arrows); 2: Surfactant disruption occurs if increased permeability result in alveolar edema (tan color) forces surfactant molecules off of the alveolar surface into the lumen of the alveolus; 3: Early acute lung injury (EALI) pathology is associated with moderate surfactant deactivation and pulmonary edema with limited clinical symptoms; 4: Mechanical ventilation (MV) if non-protective (N-PMV) will cause a ventilator induced lung injury, which greatly exacerbates progressive acute lung damage; 5: Micro-strain on the alveolar walls occurs as alveoli with limited surfactant function collapse and reopen during each breath. N-PMV greatly accelerates and expands micro-strain injury and is one of the primary VILI mechanisms. However, if a protective mechanical breath (PMV) is applied immediately upon intubation alveolar micro-strain is avoided; 6: Acute respiratory distress syndrome (ARDS) is caused by a combination of systemic inflammation-induced pulmonary edema, deactivation of surfactant and N-PMV, resulting in alveolar micro-strain. If micro-strain is prevented by applying PMV, VILI will be avoided and ARDS incidence reduced. PMV: Protective mechanical ventilation; VILI: Ventilator induced lung injury.
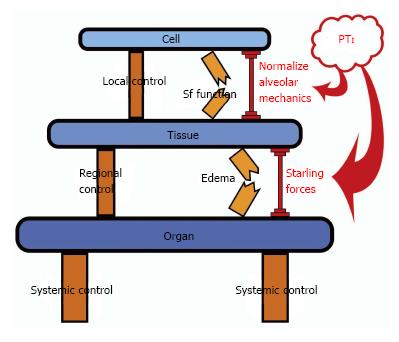
Figure 2 Appropriate mechanical breath settings prevent ‘tipping point’ cascade and acute respiratory distress syndrome.
Control mechanisms at the Local (Cell), Regional (Tissue) and Systemic (Organ) level attempt to balance insults/perturbations such as loss of surfactant (Sf) function and pulmonary edema formation but can fail without additional support. The control systems can be overwhelmed, leading to a cascading effect that culminates in dysfunction at the next higher biologic level (Cell→Tissue→Organ). Current therapies for acute lung injury are applied too late, after the health state has cascaded all the way down to the Organ Level (i.e., development of established-ARDS). We propose that mechanical ventilation modulation strategies with an appropriate pressure time integral (PTI) directed at lower level control structures (i.e., Sf function by normalizing alveolar mechanics and edema prevention by altering the Starling fluid flux forces) early in the failure sequence, prior to complete loss of containment and tipping to the organ level, may help reset the underlying control mechanisms, limit spill-over effects and bolster maintenance of compartmental containment. Application of a preemptive mechanical breath with the proper PTI can assist the endogenous control mechanisms and “shore up” the insults/perturbations to prevent the development of established-ARDS. ARDS: Acute respiratory distress syndrome; PTI: Pressure/time integral.
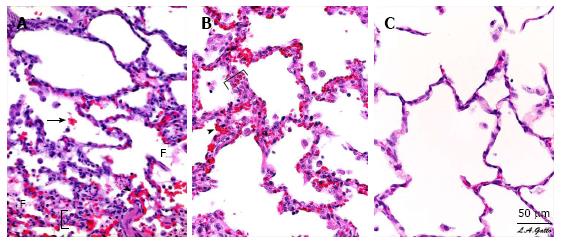
Figure 3 Pulmonary Histopathology - Photomicrographs of representative lung sections of specimens from each treatment group at 40 x magnification.
A: Sham- animals received 48 h of mechanical ventilation without peritoneal sepsis + gut ischemia/reperfusion (PS + I/R) injury. Specimen exhibits stigmata of lung injury including fibrinous deposits, blood in alveolus, congested capillaries, and thickened alveolar walls; B: LTV- animals received PS + I/R injury and LTV ventilation after onset of ALI. Specimen exhibits stigmata of lung injury including fibrinous deposits, blood in alveolus, congested capillaries, leukocyte infiltration, and thickened alveolar walls; C: APRV- Animals received APRV one hour following PS + I/R injury. Specimen shows normal pulmonary architecture, alveoli are well expanded, thin walled and there are no exudates. APRV applied early in animals with severe septic shock protected the lung superior to Sham animals with conventional mechanical ventilation without septic shock. (with permission)[33]. F: Fibrinous deposit in the air compartment; Arrow: Blood in alveolus; Arrowhead: Congested alveolar capillary; Bracket: Thickened alveolar wall; APRV: Airway pressure release ventilation.
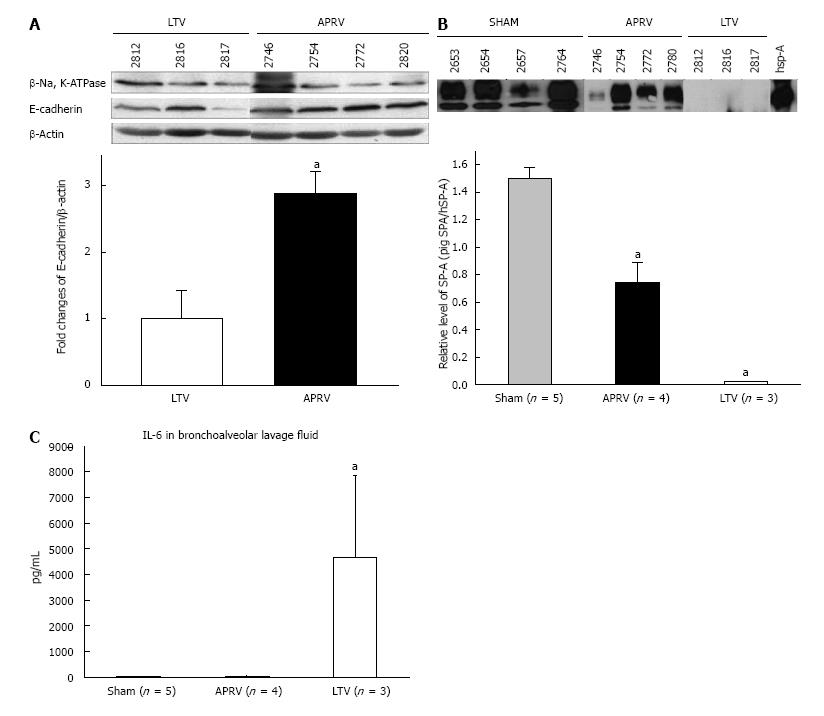
Figure 4 Bronchoalveolar lavage and lung tissue analysis.
A: Epithelial Cadherin in Lung tissue showing APRV had significantly greater E-Cadherin abundance in lung tissue than LTV (aP < 0.05); B: Surfactant protein A in BALF showing APRV had significantly higher SP-A abundance in BALF than LTV (aP < 0.05); C: Interleukin-6 (IL-6) in BALF showing APRV had significantly lower IL-6 in BALF than LTV (aP < 0.05)[33]. APRV: Airway pressure release ventilation; BALF: Bronchoalveolar lavage fluid (with permission)[33].
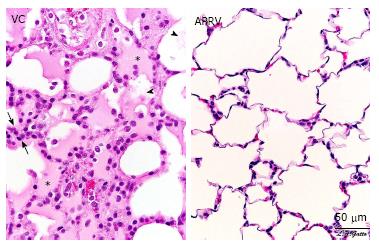
Figure 5 Histological comparison of a rat receiving early airway pressure release ventilation with a rat receiving volume cycled ventilation.
The VC animal exhibits hallmarks of acute respiratory distress syndrome, including alveolar flooding (stars), fibrinous deposits in the air compartment (arrowheads) and high cellularity (between arrows). The APRV animal shows patent alveoli with notable preservation of nearly normal histology (with permission)[35]. APRV: Airway pressure release ventilation; VC: Volume cycled ventilation.
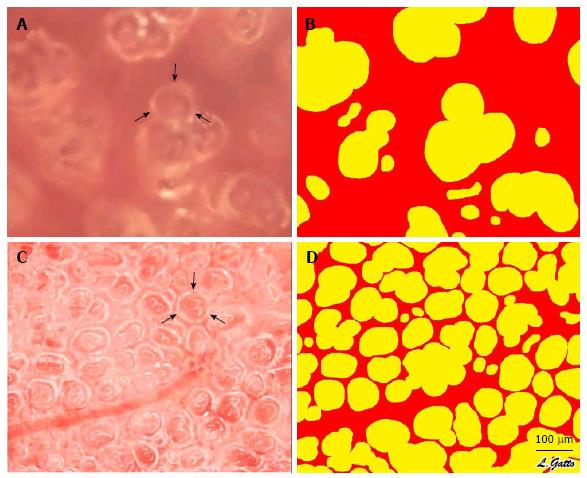
Figure 6 In vivo photomicrographs and image analysis of inflated subpleural alveoli in the volume cycled ventilation (A, B) and airway pressure release ventilation (C, D) groups.
Measurement of the % Air Space was accomplished by circling the inflated alveoli using computer image analysis. All inflated alveoli were then assigned the color yellow and noninflated areas were assigned the color red generating a sharp contrast for the image analysis software to identify and measure the % of inflated alveoli/microscopic field. Arrows (A, C) identify a single alveolus (with permission)[35]. VC: Volume cycled ventilation.
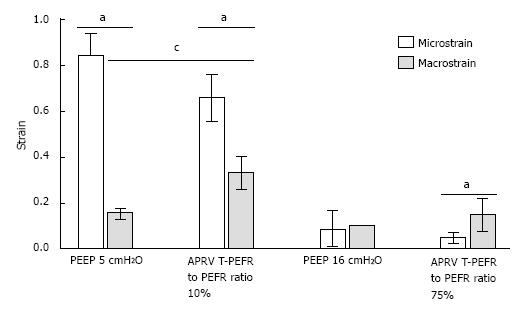
Figure 7 Macro-strain vs micro-strain.
Macro-strain was that calculated for the entire lung and Micro-strain calculated for individual alveoli in the same lung under the identical conditions. Low PEEP (5 cmH2O) with a conventional breath and an extended time at low pressure (10%) with APRV showed the largest difference between Macro- and Micro-strain. High PEEP (16 cmH2O) and a brief time at low pressure with APRV (75%) minimized the differences between Macro- and Micro-strain. See text for description of APRV settings. aP < 0.05 between Macro- and Micro-strain; cP < 0.05 between PEEP 5 and APRV 10 (with permission)[17]. APRV: Airway pressure release ventilation.
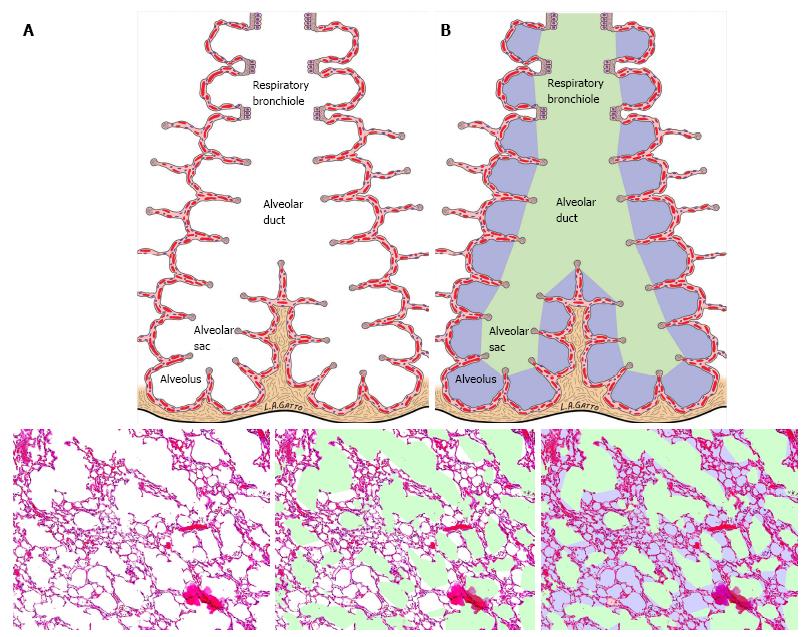
Figure 8 Impact of multiple ventilation strategies on the terminal airways.
A: Schematic of the terminal airway before and after color demarcation; B: A standard hematoxylin-eosin staining of the lung is first analyzed for conducting airway air spaces and demarcated in green. The alveoli are demarcated in lilac while the remaining interstitium, blood vessels and lymphatics are colored in magenta (with permission)[16].
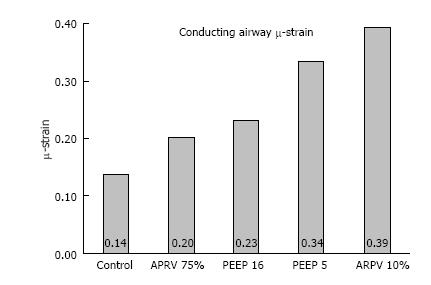
Figure 9 Airway duct μ-strain, was calculated from conducting airway perimeters at inspiration and expiration in all 4 mechanical breath strategies (CMV with PEEP 5 and 10; APRV with TLow at 10% and 75%) tested, plus a Control group with normal lung under mechanical ventilation.
(with permission)[16]. CMV: Conventional mechanical ventilation; APRV: Airway pressure release ventilation.
- Citation: Nieman GF, Gatto LA, Habashi NM. Reducing acute respiratory distress syndrome occurrence using mechanical ventilation. World J Respirol 2015; 5(3): 188-198
- URL: https://www.wjgnet.com/2218-6255/full/v5/i3/188.htm
- DOI: https://dx.doi.org/10.5320/wjr.v5.i3.188


