Copyright
©2014 Baishideng Publishing Group Inc.
World J Respirol. Nov 28, 2014; 4(3): 19-25
Published online Nov 28, 2014. doi: 10.5320/wjr.v4.i3.19
Published online Nov 28, 2014. doi: 10.5320/wjr.v4.i3.19
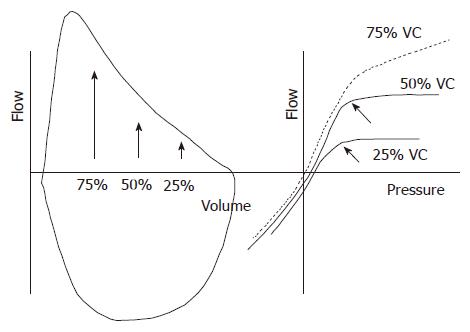
Figure 1 Relationship between maximum flow, volume and pleural pressure.
Left panel: Flow-volume curves during inspiratory and expiratory manoeuvres. The arrows indicate the volume at 75%, 50%, and 25% vital capacity; Right panel: flow and pleural pressure (Ppl) relationships during expiratory manoeuvres at different lung volumes. At 25% and 50% vital capacity (VC) flow plateaus at different pressures (oblique arrows). In contrast, at 75% VC flow keeps increasing with the increase of pressure. The lack of increased expiratory flow at 25% and 50% VC despite the increase in Ppl supports the concept of expiratory flow limitation.
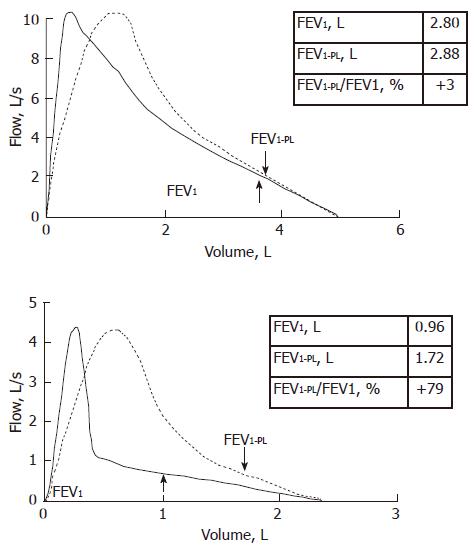
Figure 2 Effects of thoracic gas compression volume on spirometry.
Flow at the mouth is plotted against volume integrated from the flow signal (continuous line) or measured in a volume-compensated body plethysmograph (dashed line). The FEV1 at the mouth (FEV1) and in the plethysmograph (FEV1-PL) are indicated. The volume difference between the loops is the volume compressed within the chest wall during the forced expiratory manoeuvre (TGCV) and that does not contribute to the exhaled gas. Upper panel refers to a normal subject. The difference between FEV1-PL and FEV1 is 3%. Lower panel refers to a patient affected by chronic obstructive pulmonary disease with prevalent emphysema. TGCV is very large because of lung hyperinflation in addition to airflow obstruction. FEV1-PL is 79% greater than FEV1.
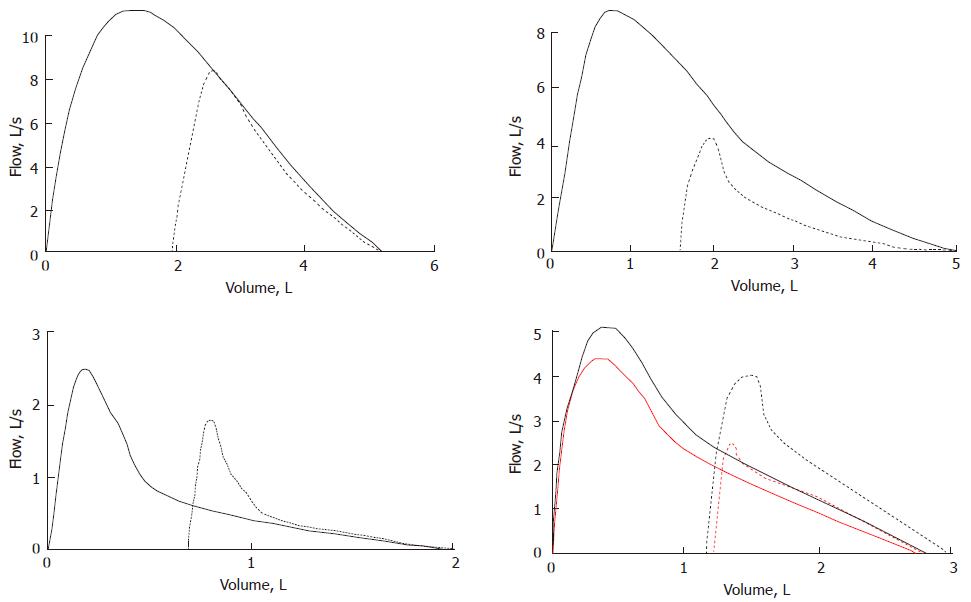
Figure 3 Examples of the effects of the deep breath on maximum flow and volume depending on the disease condition.
Continuous and dashed lines are maximal and partial flow-volume loops, respectively. Upper left panel is a normal case. The slight increase in flow after DB suggests a decrease of normal bronchial tone presumably provided by the vagus nerve. Upper right panel is the case of a mild asthmatic subjects during a bronchial challenge. The increase in flow after the deep breath indicates that a substantial part of the constrictor response to the chemical agent is ablated with DB. Lower left panel is the case of a patient affected by chronic obstructive lung disease in which taking a DB is associated with a decrease of flow. This is presumably due to the involvement of the peripheral lung regions that contribute to the lung elastic recoil and/or loss of airway-to-parenchyma interdependence. Lower right lung is the case of an asthmatic subject before and after (red and balck lines, respectively) inhaling a bronchodilator agent. Isovolume flow measured during manoeuvres initiated from mid lung volumes (dashed lines) is higher than flow after a maximum lung inflation (continuous lines).
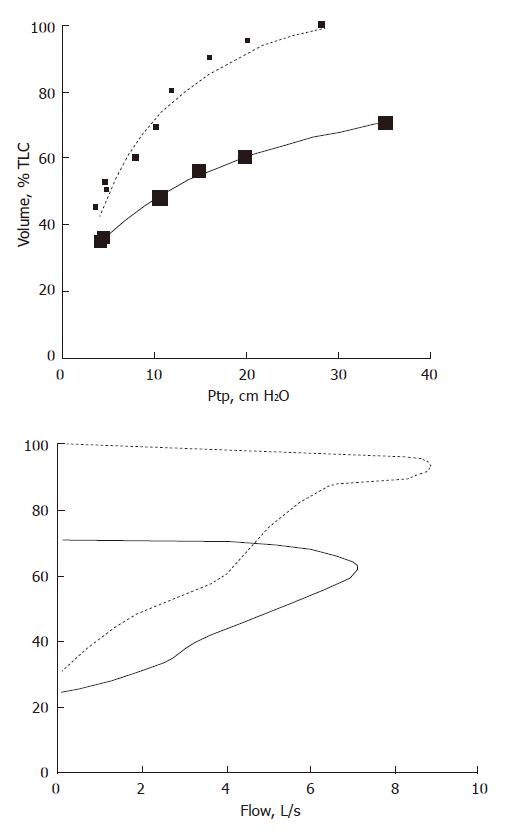
Figure 4 Effects of increased lung elastic recoil on maximal flow in a healthy subject (dashed lines) and a patients affected by pulmonary fibrosis (continuous lines).
Upper panel: transpulmonary pressure (Ptp) is plotted vs lung volume; Lower panel: flow is plotted vs volume. With the increase in Ptp, maximal flow increases. This compensates for the decrease in FEV1 expected from the decrease in total lung capacity (TLC).
- Citation: Antonelli A, Pellegrino GM, Sferrazza Papa GF, Pellegrino R. Pitfalls in spirometry: Clinical relevance. World J Respirol 2014; 4(3): 19-25
- URL: https://www.wjgnet.com/2218-6255/full/v4/i3/19.htm
- DOI: https://dx.doi.org/10.5320/wjr.v4.i3.19


