Copyright
©2013 Baishideng Publishing Group Co.
World J Respirol. Jul 28, 2013; 3(2): 11-19
Published online Jul 28, 2013. doi: 10.5320/wjr.v3.i2.11
Published online Jul 28, 2013. doi: 10.5320/wjr.v3.i2.11
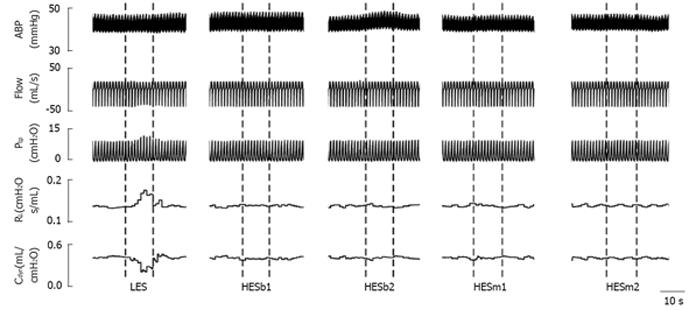
Figure 1 Typical total lung resistance and dynamic pulmonary compliance responses to electrical stimulations in an Ova-sensitized guinea pig.
The traces from the top to bottom are arterial blood pressure (ABP), airflow (Flow), Trans-pulmonary pressure (Ptp), total lung resistance (RL) and dynamic pulmonary compliance (Cdyn). The dashed lines in each column reflect the on- and off-set of a given electrical stimulation. Vagal electrical stimulation included low-frequency electrical stimulation (LES, monophasic stimulation at 50 Hz); HESb1 and HESb2 (biphasic waveform at 1 and 2.5 kHz); and HESm1 and HESm2 (monophasic waveform at 1 kHz and 2.5 kHz), which are the same for the following figures.
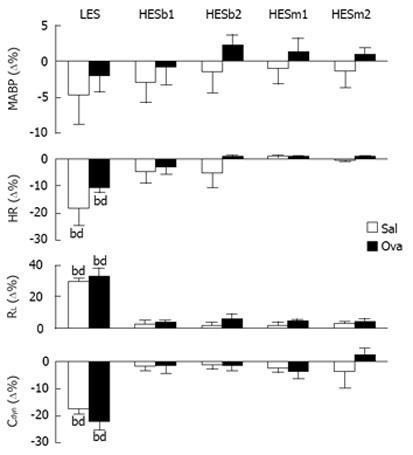
Figure 2 Group data showing the responses to vagal electrical stimulations.
MABP: Mean arterial blood pressure; HR: Heart rate; RL: Total lung resistance; Cdyn: Dynamic pulmonary compliance. n = 9 and 8 in the Sal- and Ova-pretreated guinea pigs; Mean ± SE. bP < 0.01, vs the data immediately before electrical stimulation presented as “0”; dP < 0.01, low-frequency electrical stimulation (LES) vs high-frequency electrical stimulations (HESs).
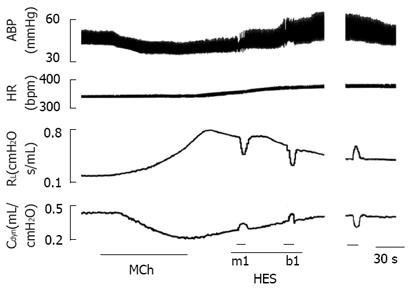
Figure 3 Typical examples exhibiting cardiovascular and airway responses to methacholine aerosol (100 μg/mL per minute for 2 min) and to vagal electrical stimulation in an anesthetized and paralyzed Ova-pretreated guinea pig.
The traces from the top to bottom are arterial blood pressure (ABP), heart rate (HR), total lung resistance (RL) and dynamic pulmonary compliance (Cdyn). The duration of the break is about 1 min. MCh: Methacholine. HES: High-frequency electrical stimulation.
Figure 4 Peak airway responses to methacholine aerosol (100 μg/mL per minute for 2 min) and the associated cardiovascular changes.
n = 9 and 8 in Sal- and Ova-treated guinea pigs respectively; mean ± SE. bP < 0.01, vs the data of pre-methacholine (MCh) challenge presented as “0”; dP < 0.01 between Sal- and Ova-treated groups. MABP: Mean arterial blood pressure; HR: Heart rate; RL: Total lung resistance; Cdyn: Dynamic pulmonary compliance.
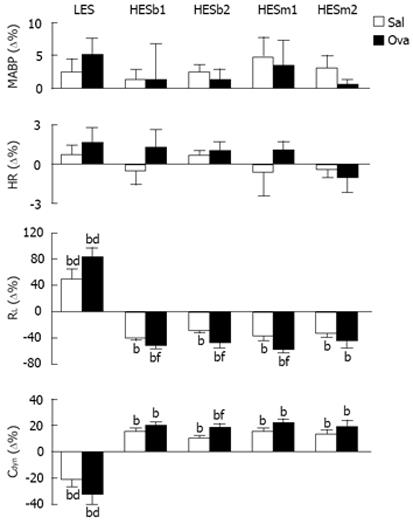
Figure 5 Airway and cardiovascular responses to the vagal electrical stimulations after exposure to methacholine aerosal (100 μg/mL per minute for 2 min).
n = 8 and 9 in Sal- and Ova-treated guinea pigs; Mean ± SE. bP < 0.01, compared to the data before methacholine (MCh) challenge; dP < 0.01 LES vs HESs; fP < 0.01 between Sal- and Ova-treated groups. MABP: Mean arterial blood pressure; HR: Heart rate; RL: Total lung resistance; Cdyn: Dynamic pulmonary compliance.
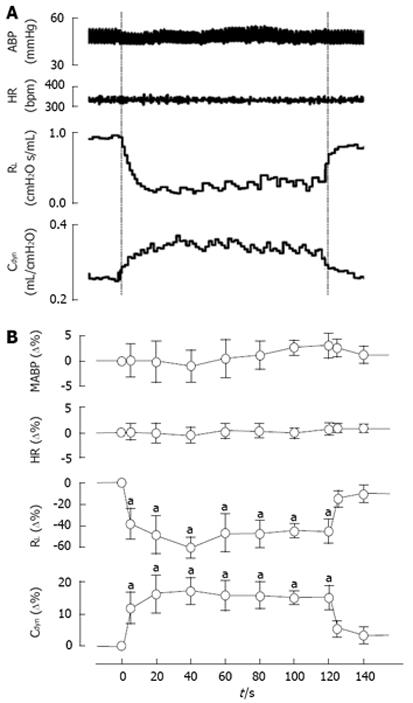
Figure 6 Cardiovascular and airway responses to 2 min vagal high-frequency electrical stimulation after exposure to methacholine aerosal (100 μg/mL per minute for 2 min).
A: HESm1-evoked responses in an Ova-treated guinea pig about 2 min after initiation of methacholine (MCh) challenge, in which the baseline values of total lung resistance (RL) and dynamic pulmonary compliance (Cdyn) were 0.1 cmH2O s/mL and 0.4 mL/cmH2O respectively; B: The averaged data of MABP, HR, RL and Cdyn from three guinea pigs (five trials) are illustrated in panel. In both panels, the traces are arterial blood pressure (ABP/MABP), heart rate (HR), RL, and Cdyn. n = 5 trials (3 guinea pigs); Mean ± SE; aP < 0.05, high-frequency electrical stimulation (HES)-evoked responses vs the data before electrical stimulation presented as “0”.
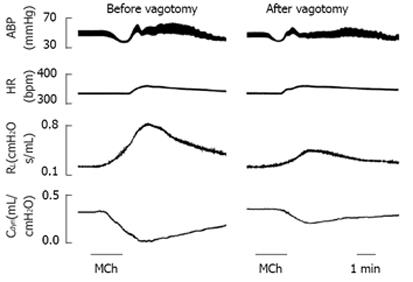
Figure 7 Comparison of the cardiovascular and airway responses to methacholine aerosol (100 μg/mL per minute for 2 min) before and after bivagotomy in an anesthetized and paralyzed Ova-treated guinea pig.
The traces are arterial blood pressure (ABP), heart rate (HR), total lung resistance (RL), and dynamic pulmonary compliance (Cdyn).
- Citation: Zhuang J, Bailet D, Curtis R, Xu F. High-frequency electrical stimulation of cervical vagi reduces airway response to methacholine. World J Respirol 2013; 3(2): 11-19
- URL: https://www.wjgnet.com/2218-6255/full/v3/i2/11.htm
- DOI: https://dx.doi.org/10.5320/wjr.v3.i2.11


