INTRODUCTION
Evaluation of oral function is useful for tracking longitudinal changes in swallowing function. We performed a review of videofluoroscopic (VF) evaluation of swallowing to determine whether incomplete lingual range of motion corresponds to difficulties with bolus clearance, propulsion, and containment. There are various assessment tools for clinical practice of dysphagia, such as the Sydney swallowing questionnaire[1] and the MD Anderson dysphagia inventory[2] which were self-administered questionnaires, but it is extremely difficult to objectively and quantitatively evaluate the oral phase in swallowing function, because a self-administered questionnaire have difficulty in assessing symptoms of dysphagia in patients who are not consciously aware of swallowing dysfunction or aspirate silently. Especially, there is a high incidence of silent aspiration in patients with neuromuscular and other neurological disorders (NNMD)[3-7]. On the other hand, Han et al[8] proposed a 100-point VF dysphagia scale and established some subscales, such as “bolus formation” and “mastication,” for oral phase. However, the grading standard for the subscales in the oral phase is vague, because of the complexity of masticatory or tongue function. In recent years, depending on development of image analyzing software, some studies tried to analyze kinematic swallowing movements. van der Kruis et al[9] reviewed researches biochemically analyzing hyoid bone displacement in VF. The tongue has an important role in mastication and swallowing because it transports food to the molars, initiates mastication, mixes foods with saliva, and propels a food bolus into the pharynx. Clinically, tongue function consists of various factors, including mobility, shape variation, and variable posture of the tongue[10]. Several recent studies have tried to quantitatively assess tongue function quantitatively by analyzing tongue movement based on VF images[11], to measure tongue thickness by ultrasonography[12], and to measure tongue pressure as surrogate for tongue strength[13,14].
In dysphagia in patients with NNMD, tongue dysfunction is an important factor, particularly in the oral phase. Parkinsonian patients exhibit tongue movement problems, and patients with muscular disorders show tongue weakness. These symptoms can cause aspiration or suffocation which may produce serious complications. Therefore, patients with NNMD need appropriate long-term follow-up for swallowing function in prevention of aspiration pneumonia and management of nutrition. However, because most of research studies concerning dysphagia have been conducted on patients with stroke, there is an absolute lack of information on dysphagia in patients with NNMD who have a chronic course.
In this review article, the current state of quantitative assessments of tongue function for identification and management of dysphagia in patients with NNMD has been outlined on the basis of some studies.
Methods
A literature review was completed on MedLine using the following search terms: tongue movements, tongue thickness, and tongue pressure in NNMD. A search for these words yielded 22 results from 1994 to 2014. The specific term “tongue function” search combined with “parkinsonian syndromes” yielded 31 results, “tongue movements” 28, “tongue thickness” 0, and “tongue pressure” 3. The specific term “tongue function” search combined with “neuromuscular diseases” yielded 58 results, “tongue movements” 39, “tongue thickness” 2, and “tongue pressure” 17. Of these articles 22 were considered relevant and included in this review.
EVALUATION OF TONGUE FUNCTION BY USING VF IMAGES
Bradykinesia and muscle rigidity observed in Parkinson’s disease (PD) are considered causes of dysphagia. In most PD patients, swallowing dysfunction is related to abnormal movements associated with oropharyngeal dysfunction. In the oral phase in PD patients, related movement abnormalities include labial bolus leakage, incomplete or hesitant mastication, tongue tremor, tongue pumping, prolonged tongue elevation, and slowed and small mandibular excursion[15-18]. Troche et al[19] evaluated the swallowing function in the oral phase of PD patients using bolus transit time and the number of tongue thrusts on VF images, but only a few studies have quantitatively assessed mandibular and tongue movements in PD patients.
Nilsson et al[20] described that prolongation of the oropharyngeal transit time may reflect dysfunction caused by rigidity and motor deterioration and that rigidity and bradykinesia influence the motility function of the tongue. Johnston et al[21] suggested that the oral phase of swallowing is under voluntary control, and Nagaya et al[17] indicated that its alterations are related to bradykinesia and rigidity.
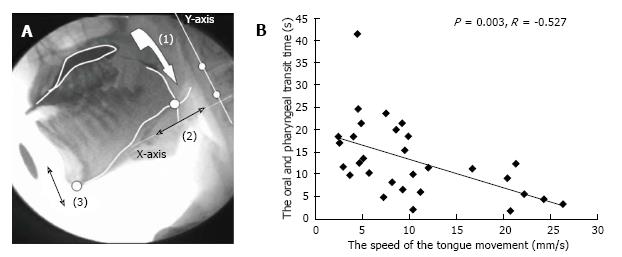
To perceive the tongue movement accurately, Steele et al[22] attached three transducer coils to the dorsal surface of the tongue. However, we tried to more conveniently demonstrate a relationship between food transportation and abnormal movements of the tongue by analyzing VF images of 30 PD patients[23]. Measurements of bolus transit and movements of the mandible and tongue were completed by analyzing the images of swallow trials frame-by-frame or in slow motion using dynamic image analysis software (Dipp-Motion Pro; Ditect, Tokyo, Japan). The movement of the point where the tongue line and the mandible line intersected was calculated on the Y-axis, which was based on two optional points on the cervical vertebrae, for evaluating the tongue movement (Figure 1 reproduced from Ref. [22]). The tongue movement distances (mm) were divided by the oropharyngeal transit time (s), which was obtained from a measurement of the speed of tongue movements. The average tongue movements were 15.4 ± 9.2 mm/s in the mild/moderate PD group (Hoehn and Yahr stages II and III) and 11.0 ± 7.2 mm/s in the advanced PD group (Hoehn and Yahr stages IV and V). The oropharyngeal transit time of the advanced group was significantly longer than that of the mild/moderate group (P = 0.045). The speed of tongue movement negatively correlated with the oropharyngeal transit time (P = 0.003, r = -0.527). These results indicated the importance of the mandibular and tongue function in patients with PD.
Figure 1 Analysis of tongue movement by using videofluoroscopic images.
A: Analysis of videofluoroscopic (VF) images: (1) Oropharyngeal transit time, (2) Distance of tongue movement along the X-axis, (3) Distance of mandibular movement along the Y-axis; B: Distribution and relationship between the oropharyngeal transit time and speed of tongue movement[23].
Kitashima et al[24] also compared the swallowing function in PD patients quantitatively between DBS ON and OFF states after DBS surgery analyzing the speed of tongue movement in VF images and suggested that STN-DBS may influence the tongue movement.
Steele et al[22] also investigated tongue movement in patients with moderate PD[25] and reported that PD participants even in early stages showed smaller and more variable movements in the horizontal movement plane.
With regard to other types of NNMD patients, Higo et al[26] used VF images to assess swallowing function on the basis of parameters, such as tongue base movement and bolus transport from the mouth to pharynx, in patients with multiple system atrophy with a clinical predominance of cerebellar systems (MSA-C), myasthenia gravis (MG)[7], and amyotrophic lateral sclerosis (ALS)[27]. They observed disturbed bolus transport in patients with these NNMDs quantitatively in the studies. Patients in the early stage of MSA-C showed disturbance in bolus transportation from the oral cavity to the pharynx which will be caused by progression of cerebellar dysfunction and overlapped parkinsonism[26]. In patients with MG, a significant correlation between disturbance of laryngeal elevation and aspiration was found[7]. Most of ALS patients preserved normal upper esophageal sphincter relaxation, however some patients showed upper esophageal sphincter dysfunction[27].
MEASUREMENT OF TONGUE THICKNESS BY USING ULTRASONOGRAPHY
It is possible to assess tongue thickness of healthy persons or mild-stage neuromuscular patients by inspection or palpation to a certain extent, but it is difficult to evaluate tongue atrophy of patients with severe-stage disease because they have difficulty protruding their tongues. Furthermore, there are differences in tongue thickness between the rest and protrusion positions. During mouth opening, which results in contraction of tongue muscles to a certain extent, tongue muscles will waste away or become paralyzed. Liégeois et al[10] measured the lingual volume in healthy subjects using magnetic resonance imaging (MRI) and suggested significant correlations between tongue volume and body height, weight, and the body mass index (BMI)[10], but MRI technique is tedious and expensive. Therefore, to assess the thickness of an atrophied and paralyzed tongue in detail in patients who have difficulty protruding or moving their tongue, ultrasound examination is more convenient[12] and effective than is inspection or palpation alone.
The so-called “pseudohypertrophy” (enlargement) in Duchenne muscular dystrophy (DMD) patients was found in a former study that measured the transverse width of the tongue[28], but no reports have shown a relationship between weakness and pseudohypertrophy of the tongue. A previous study of Van Den Engel-Hoek et al[29] showed the possibility of ultrasound examination to differentiate patients with DMD from healthy persons measuring tongue thickness in five DMD patients. The tongue thickness of the DMD patients ranged from 43.9 mm to 68.4 mm, whereas the one in healthy individuals was 47.3 ± 20.1 mm. They again have recently reported on the convenience and good reproducibility of quantitative muscle ultrasound to measure tongue thickness in DMD patients[30], and that tongue thickness increased in advanced stages. However, they have only evaluated patients with muscular dystrophy.
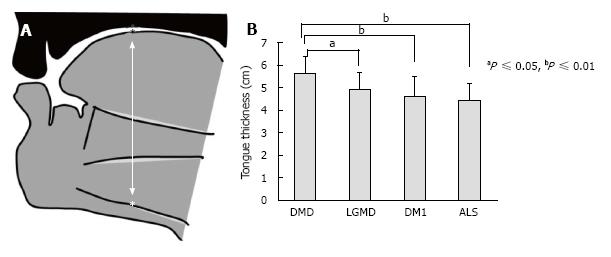
We also compared tongue thickness among 130 patients with DMD, limb girdle muscular dystrophy (LGMD), myotonic dystrophy type 1 (DM1) and ALS (Figure 2 reproduced from Ref. [31])[31]. The DMD group showed a tongue thickness of 56.3 ± 7.3 mm, which was significantly higher than those of other groups. The ALS group had a tongue thickness of 44.4 ± 7.2 mm, which was significant correlated with maximum tongue pressure.
Figure 2 Measurement of tongue thickness by using ultrasonography.
A: Measurement of tongue thickness, the upper boundary of the mylohyoid raphe, and the upper surface of the tongue; B: Comparison of tongue thickness among the four groups[31]. DMD: Duchenne muscular dystrophy; LGMD: Limb girdle muscular dystrophy; DM1: Myotonic dystrophy type 1; ALS: Amyotrophic lateral sclerosis.
“Tongue pseudohypertrophy” in DMD patients could be predicted to cause limited tongue movement because of the lack of space. We tried to describe the distinctive relationship between tongue thickness and tongue movement function in NNMD patients[31]. However, the increased tongue thickness was associated with a tendency towards an increase rather than a decrease the mobility of tongue root (P = 0.062, r = 0.414). The limitation of tongue movement may require several small movements of the tongue to transport the bolus through the oral cavity and pharynx.
EVALUATION OF TONGUE STRENGTH BY MEASURING TONGUE PRESSURE
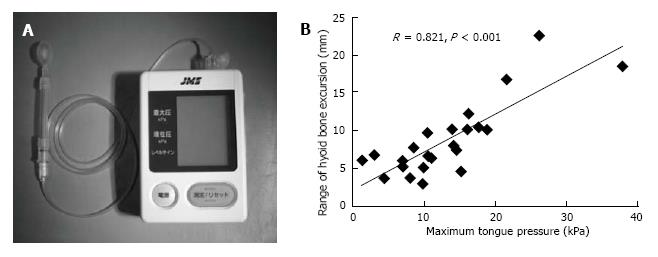
Hayashi et al[32] measured tongue pressure by a method that used a handheld probe (JMS Co., Ltd., Hiroshima, Japan) (Figure 3B reproduced from Ref. [32]). The probe was assembled with a small balloon and pressurized with air at 19.6 kPa. Patients were asked to compress the balloon onto the palate for approximately 7 s using maximum voluntary effort of the tongue. The increase in the inner pressure of the balloon was taken to be the as tongue pressure. The average maximum tongue pressure in healthy people by age group was 41.7 ± 9.7 kPa for those in their twenties, 40.4 ± 9.8 kPa for those in their forties, and 37.6 ± 8.8 kPa for those in their sixties[33].
Figure 3 Measurement of tongue pressure as tongue strength.
A: The tongue pressure measuring device (a handy probe) is shown; B: Correlation between the maximum tongue pressure and range of hyoid bone excursion in the Duchenne muscular dystrophy group[30].
Using the JMS system, the average maximum tongue pressure was reported to be 15.3 ± 6.4 kPa in patients with spinal and bulbar muscular atrophy (SBMA) by Mano et al[34], and 11.8 ± 5.3 kPa in patients with SBMA and 15.0 ± 14.1 kPa in patients with ALS by Morimoto et al[35]. Using the Iowa oral performance instrument (IOPI)[13], Easterling et al[36] showed that tongue pressures ranged from 22.1 ± 11.8 kPa to 13.5 ± 10.9 kPa in patients with ALS, and Palmer et al[37] reported pressures that range from 19.5 ± 0.7 kPa to 26.9 ± 7.8 kPa in patients with oculopharyngeal muscular dystrophy (OPMD)[37]. These values were less than half of the ones of healthy people matched by age.
We compared dysphagia between 20 patients with DM1 and 24 patients with DMD on the basis of the maximum tongue pressure and the range of hyoid bone excursion during pharyngeal transit time, and the area of pharyngeal residue after the first swallow on VF images[38]. The range of hyoid bone excursion and area of pharyngeal residue of the DM1 group were significantly larger than those of the DMD group (P = 0.001, P < 0.001). However, there was no significant difference in maximum tongue pressures measured by JMS system between the DM1 group (12.0 ± 6.9 kPa) and the DMD group (13.6 ± 8.0 kPa).
Hori et al[14] used a tactile sensor system in the palatal plate to measure tongue pressure. This system could be useful for measuring tongue pressure and activity during oropharyngeal swallowing. Hamanaka-Kondoh et al[39] measured tongue pressure in DMD patients while they swallowed water and reported that the subsequent order of tongue-palate contact disappeared and the maximal magnitude and value of tongue pressure on the mid-anterior palate were smaller.
With regard to the relationship between tongue thickness, tongue pressure, and VF findings, we detected significant correlations between tongue thickness and maximum tongue pressure in the ALS group[31], and between range of hyoid bone excursion and maximum tongue pressure in patients with DMD but not with DM1[38]. These results suggest that the type of NNMD may affect the relationship among these factors.
RELATIONSHIP BETWEEN TONGUE PRESSURE AND SWALLOWING PRESSURE
Finally, we can conveniently predict swallowing pressure from the data of tongue pressure data. The average values of swallowing pressure measured using manometry in the oropharynx were 131.4 mmHg in patients with PD in a study by Sung et al[40], 53.3 mmHg in patients with ALS in a study of by Higo et al[26], and 24 mmHg in patients with DM1 in a study by Modolell et al[41]. The swallowing pressures were lower in the PD patients than in the control group, and those in patients with ALS and DM1 were less than half of those in control group.
We analyzed the relationship between tongue and swallowing pressure in patients with NNMD. We measured the largest change of swallowing pressure in the hypopharynx and the upper esophageal sphincter (UES) of 24 DM1 patients during several swallowing events. In the DM1 group, the maximum tongue pressure (13.4 ± 6.8 kPa) significantly correlated with maximum swallowing pressure (53.3 ± 27.0 mmHg). This result suggests that reduced tongue and swallowing pressure may induce pharyngeal residue and increase the risk of aspiration and chocking on large pieces of solid food.
Certainly, an indication for an oral feeding tube should not merely depend on outcomes of the VF or the other assessments of tongue function. However, we expect to apply the data acquired by assessing tongue function to establishing a standard for introduction of tube feeding to patients. To develop such convenient guidelines, more data concerning tongue function and analysis of the relationship between tongue dysfunction and symptoms in the pharyngeal phase are needed.
DISCUSSION
There are few reviews that include extensive data on tongue movements, tongue thickness, and tongue pressure in NNMD. Through this review of the current literature, it is obvious that the data collected on tongue dysfunction in NNMD is limited in quality and quantity.
Despite the development of image analyzing software, there are few studies which analyze tongue movements in VF images of NNMD patients. However, to understand the progress of dysphagia in patients with NNMD for long periods, it is necessary to conveniently assess tongue movements at regular intervals. Although the method used by Umemoto et al[23] is thought to be useful for quantifying rigidity or bradykinesia of tongue movements in patients with parkinsonian diseases, more attempt to facilitate the method is requested in order to diffuse the analysis of tongue movements onto the daily clinical practice.
A change in volume of tongue in patients with DMD or ALS with progression of diseases is well known. However, we have not had such an objective data regarding the change. Although the previous study of van Den Engel-Hoek et al[30] showed that tongue hypertrophy was found 70% of 18 patients with DMD[30], they did not mention the relationship between tongue hypertrophy and tongue strength. More studies are needed to test the hypothesis that tongue muscle tissue is replaced with connective tissue or fat under a tongue hypertrophy. Regarding tongue atrophy in ALS patient, we could show a significant correlation between tongue thickness and maximum tongue pressure[31].
There are two methods of tongue pressure measurement, a balloon system for compression onto the palate[32,33] and a tactile sensor system in the palatal plate[6,39]. The balloon system is so convenient that many data of tongue pressure based on each NNMD have been collected[34-37], but the data are not reflected in dynamic water or food swallow. In the other hand, the tactile sensor system in the palatal plate is available during swallowing water or food. However, the penetration rate of the system is not sufficient and the number of report regarding NNMD using the system remain is just only one[39]. In the future, based on each NNMD and each stage of disease, more data is expected and the meaning of data of each channel of the tactile sensor system should be clearly understood.
All data of analysis of VF images, tongue thickness, and tongue pressure are insufficient. In the future, to establish a better way of managing dysphagia in patients with NNMD, we should collect such data and draft a guideline on methods to adjust diet or introduce tube feeding for the patients. In the process of producing the guideline, we need to clarify the characteristic in tongue dysfunction of each NNMD and the relationship between the degree of tongue dysfunction and appropriate nutrition management.
CONCLUSION
Through some studies outlined in this article, changes in tongue movements, thickness, and tongue pressure with progression of NNMD have been suggested. More studies are needed to develop guidelines what types of tongue dysfunction give an indication of adjusting diet and introducing tube feeding to NNMD patients.
P- Reviewer: Buckley JD, Lauersen JB S- Editor: Ji FF L- Editor: A E- Editor: Lu YJ


