Copyright
©The Author(s) 2015.
World J Otorhinolaryngol. May 28, 2015; 5(2): 58-64
Published online May 28, 2015. doi: 10.5319/wjo.v5.i2.58
Published online May 28, 2015. doi: 10.5319/wjo.v5.i2.58
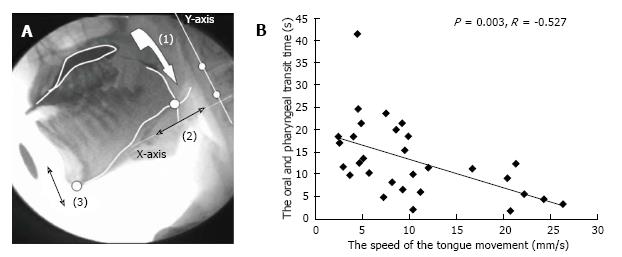
Figure 1 Analysis of tongue movement by using videofluoroscopic images.
A: Analysis of videofluoroscopic (VF) images: (1) Oropharyngeal transit time, (2) Distance of tongue movement along the X-axis, (3) Distance of mandibular movement along the Y-axis; B: Distribution and relationship between the oropharyngeal transit time and speed of tongue movement[23].
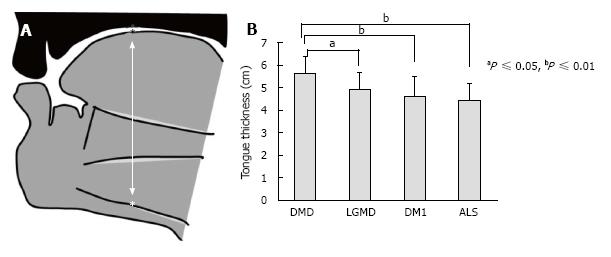
Figure 2 Measurement of tongue thickness by using ultrasonography.
A: Measurement of tongue thickness, the upper boundary of the mylohyoid raphe, and the upper surface of the tongue; B: Comparison of tongue thickness among the four groups[31]. DMD: Duchenne muscular dystrophy; LGMD: Limb girdle muscular dystrophy; DM1: Myotonic dystrophy type 1; ALS: Amyotrophic lateral sclerosis.
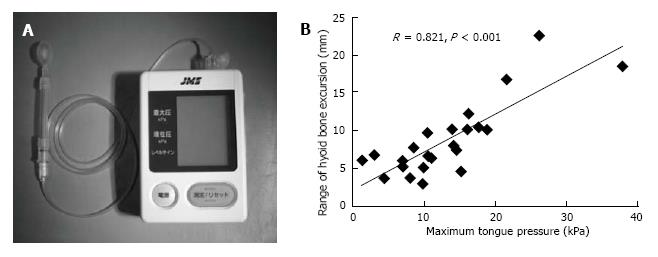
Figure 3 Measurement of tongue pressure as tongue strength.
A: The tongue pressure measuring device (a handy probe) is shown; B: Correlation between the maximum tongue pressure and range of hyoid bone excursion in the Duchenne muscular dystrophy group[30].
- Citation: Umemoto G. Tongue dysfunction in neurological and neuromuscular disorders: A narrative literature review. World J Otorhinolaryngol 2015; 5(2): 58-64
- URL: https://www.wjgnet.com/2218-6247/full/v5/i2/58.htm
- DOI: https://dx.doi.org/10.5319/wjo.v5.i2.58


