Copyright
©The Author(s) 2015.
World J Ophthalmol. May 12, 2015; 5(2): 86-98
Published online May 12, 2015. doi: 10.5318/wjo.v5.i2.86
Published online May 12, 2015. doi: 10.5318/wjo.v5.i2.86
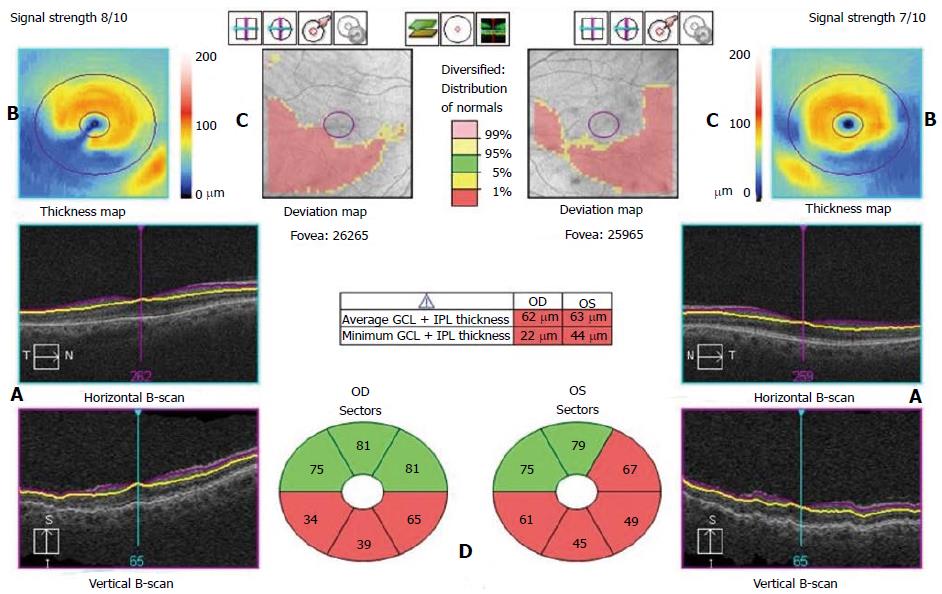
Figure 1 Cirrus HD-optical coherence tomography.
A: Segmentation. Horizontal and vertical B-scans. The purple line represents the inner boundary of the ganglion cell layer and the yellow line represents the outer boundary of the inner plexiform layer; B: Thickness map. Calculation of the ganglion cell layer (GCL) + inner plexiform layer (IPL) thickness data from an elliptical annulus, 6 mm × 6 mm grid, centered on the fovea; C: Deviation map. Comparison of the GCL + IPL thickness results to a normative database; D: Sectors. Ganglion cell analysis segmentation algorithm that divides the elliptical annulus of the thickness map into 6 equal sectors expressed in micrometers. Each spoke represents the average of the pixels along that spoke that lie within the measurement annulus.
Figure 2 RTVue.
A: Thickness map. The thickness map is color coded where thicker regions of the ganglion cell complex are displayed in hot colors (yellow and orange), and thinner areas are displayed in cooler colors (blue and green); B: Deviation map. Calculated based on comparing the thickness map to the normative databases. The deviation map shows the percent loss from normal as determined by the normative database; C: Significance map. Shows regions where the change from normal reaches statistical significance. The significance map is color-coded where green represents values within the normal range (P = 0.05-0.95), yellow indicates borderline results (P < 0.05), and red represents outside normal limits (P < 0.01).
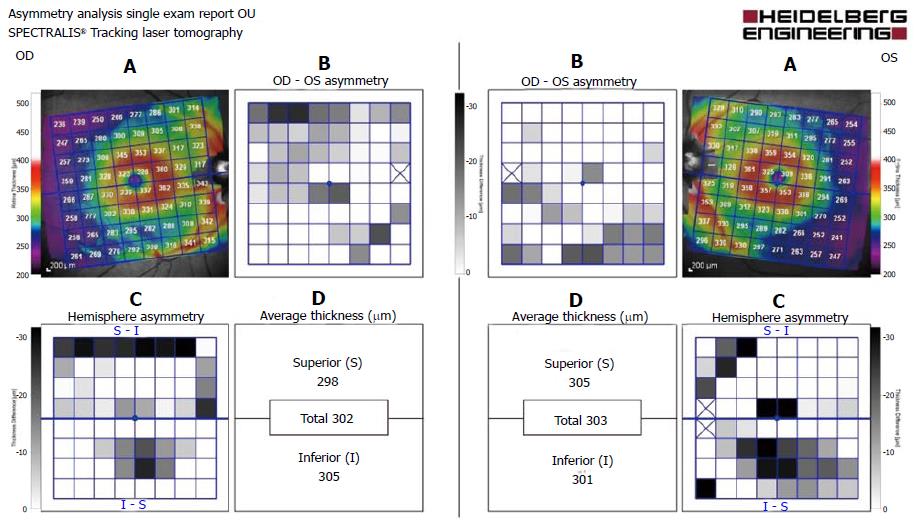
Figure 3 Spectralis.
A: Thickness map - the entire retinal thickness in the posterior pole displayed as a color coded thickness map for an 8 × 8 grid centered on the foveal pit positioned symmetrically to the fovea-disc axis; B: Asymmetry map - examination by grid of the asymmetry between the thicknesses in the corresponding cell of the fellow eye. Asymmetry color scale - darker grey indicates larger differences. The closer the value is to zero (white color), the better the symmetry; C: Hemisphere analysis - displays the asymmetry between the superior and the inferior hemisphere of each eye. The fovea-disc axis is the horizontal symmetry line. The lower half compares the inferior to the superior; D: Mean thickness - represents the mean retinal thickness for the superior and inferior hemisphere, as well as the total mean thickness over the entire 8 × 8 grid.
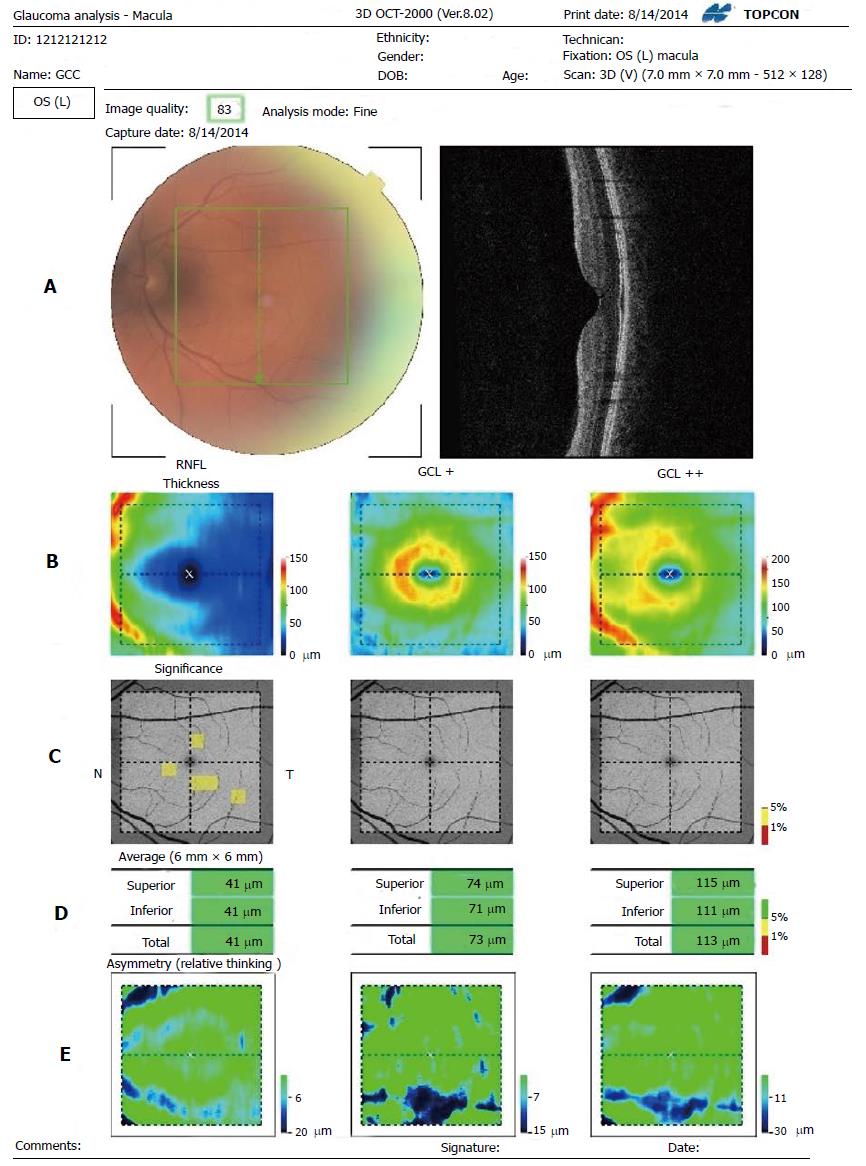
Figure 4 Three dimensions optical coherence tomography 2000.
A: Segmentation: 7 mm2 area centered on the fovea with a scan density of 512 vertical × 128 horizontal scans; B: Thickness map. Average regional thickness is calculated for RNFL, GCL+ (GCL + IPL), GCL++ (RNFL + GCL + IPL). Each cell is calculated and compared to the normative database of the device; C: Significance map. From left to right, 10 × 10 grid comparison maps covering 6 mm × 6 mm area of RNFL, GCL+ and GCL++ are shown. The comparison result is displayed with the color in the legend on the right. The background image is red free image; D: Average thickness. From left to right, three average thicknesses of RNFL, GCL+ and GCL++. The top is “Superior” which means average in the upper half area, the middle is “Inferior” which means average in the lower half area, and the bottom is “Total’ which means average in the total area. Each average thickness is compared to the normative data and displayed according to color; E: Asymmetry map. From left to right, subtraction thickness maps covering 6 mm × 6 mm area of RNFL, GCL+ and GCL++ are shown. The subtraction is performed between two points which symmetrically lie with respect to the center horizontal line. In the upper half, the value in each point is calculated such that thickness of the point is subtracted from the thickness of the corresponding line-symmetry point below and vice versa. Blue indicates that the thickness of the point is thinner than that of the corresponding point. RNFL: Retinal nerve fiber layer; GCL: Ganglion cell layer; IPL: Inner plexiform layer.
- Citation: Meshi A, Goldenberg D, Armarnik S, Segal O, Geffen N. Systematic review of macular ganglion cell complex analysis using spectral domain optical coherence tomography for glaucoma assessment. World J Ophthalmol 2015; 5(2): 86-98
- URL: https://www.wjgnet.com/2218-6239/full/v5/i2/86.htm
- DOI: https://dx.doi.org/10.5318/wjo.v5.i2.86


