Copyright
©2014 Baishideng Publishing Group Inc.
World J Ophthalmol. Nov 12, 2014; 4(4): 113-123
Published online Nov 12, 2014. doi: 10.5318/wjo.v4.i4.113
Published online Nov 12, 2014. doi: 10.5318/wjo.v4.i4.113
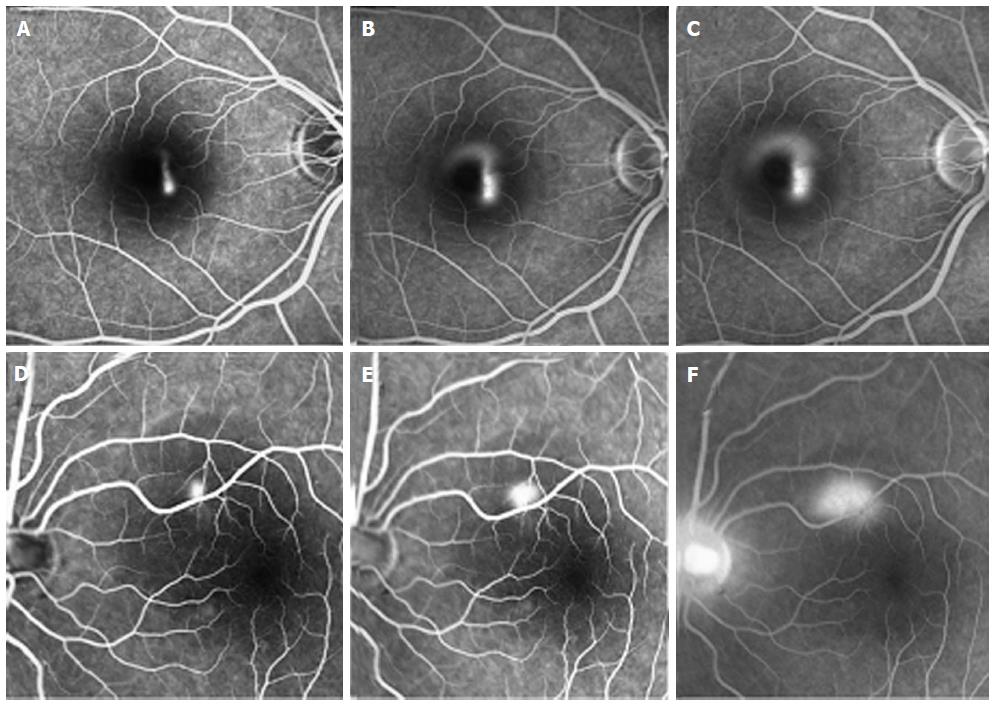
Figure 1 Two different patterns of hyperfluorescent dye leakage on fluorescein angiogram in acute central serous chorioretinopathy; Smokestack pattern of leakage (A, B and C) and inkblot pattern of dye leakage (D, E and F).
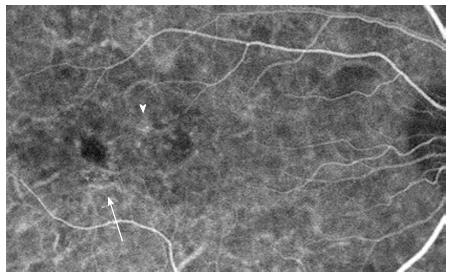
Figure 2 Indocyanine green angiography in a patient with chronic central serous chorioretinopathy.
Note congestion and dilatation of choroidal capillaries and veins (arrow) and choroidal staining (arrowhead).
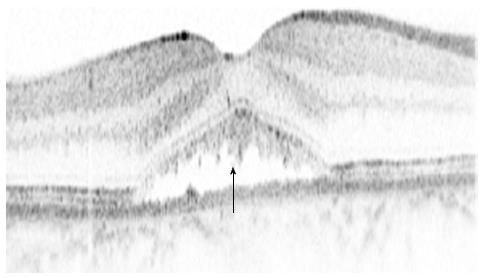
Figure 3 Spectral domain optical coherence tomography of acute central serous chorioretinopathy.
Note high reflective subretinal deposits within the area of a serous retinal detachment (arrow).
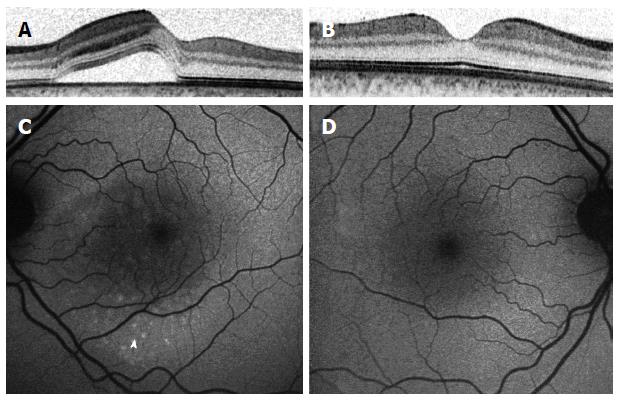
Figure 4 Imaging of a 38-year-old patient with central serous chorioretinopathy, one month following the beginning of his symptoms.
Comparison of left (A) and right (B) eyes imaged with spectral domain optical coherence tomography shows a serous retinal detachment in his left eye. Minimal changes are seen with fundus autofluorescence imaging (C), consisting of a granular pattern of increased autofluorescence in the area of retinal detachment (arrowhead), compared to images of the right eye (D).
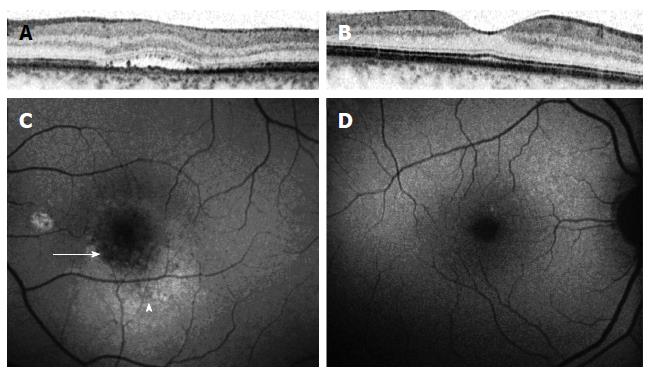
Figure 5 A 36-year-old patient with central serous chorioretinopathy, six months following the beginning of his symptoms.
Comparison of left (A) and right (B) eyes imaged with spectral domain optical coherence tomography shows a serous retinal detachment in his left eye. In fundus autofluorescence imaging of the left eye (C) note the hyperautofluorescent in the detached area (arrow) beginning to form the manner of inferior gravitation (arrowhead), compared to images of the right eye (D).
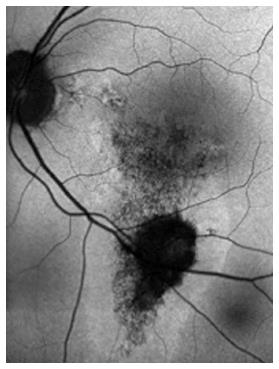
Figure 6 Fundus autofluorescence of a patient with chronic central serous chorioretinopathy showing inferior gravitational tracks and areas of decreased autofluorescence corresponding to areas of atrophy.
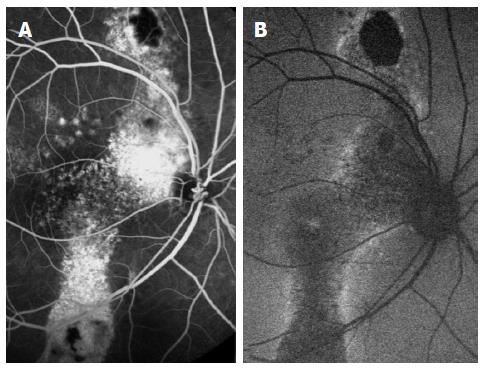
Figure 7 Chronic central serous chorioretinopathy; imaging from the same eye.
Fluorescein angiography (A) with extensive hyperfluorescent areas, corresponding to areas of atrophy, seen as areas of decreased autofluorescence (B). Note the inferior gravitation pattern in both images.
- Citation: Schaap-Fogler M, Ehrlich R. What is new in central serous chorioretinopathy? World J Ophthalmol 2014; 4(4): 113-123
- URL: https://www.wjgnet.com/2218-6239/full/v4/i4/113.htm
- DOI: https://dx.doi.org/10.5318/wjo.v4.i4.113


