Copyright
©2014 Baishideng Publishing Group Inc.
World J Ophthalmol. Aug 12, 2014; 4(3): 75-81
Published online Aug 12, 2014. doi: 10.5318/wjo.v4.i3.75
Published online Aug 12, 2014. doi: 10.5318/wjo.v4.i3.75
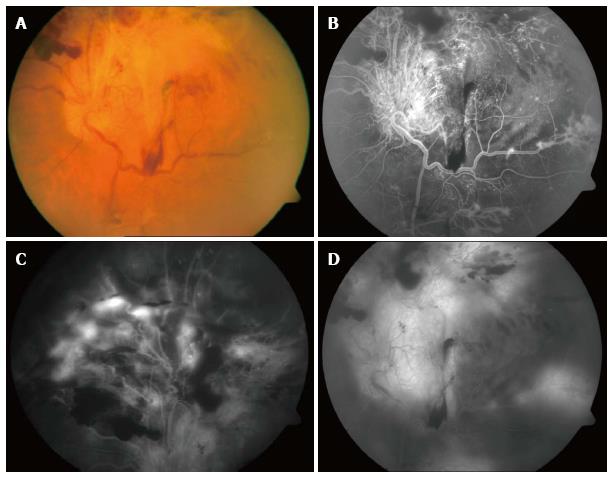
Figure 1 Preoperative images of the retina showing diabetic retinal detachment involving the posterior pole (A), the superior retina (B), and the region near the arcade (C), as well as subhyaloid and preretinal hemorrhage in the equator (D).
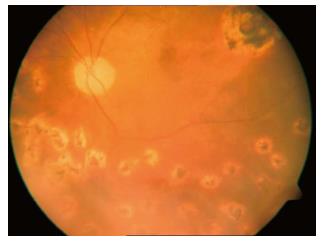
Figure 2 Postoperative image of the retina after silicone oil removal showing the retina attached and the posterior pole retinal tear treated with a laser.
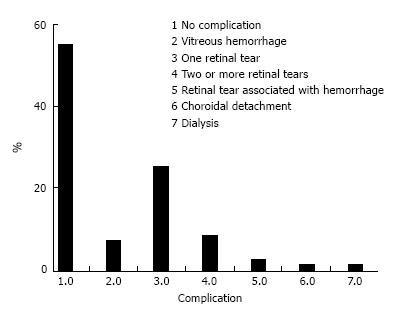
Figure 3 The percentage of intraoperative complications.
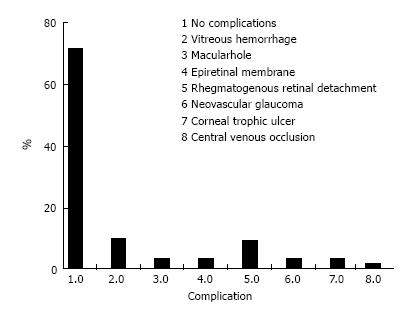
Figure 4 Histogram showing postoperative complications: Frequency distribution.
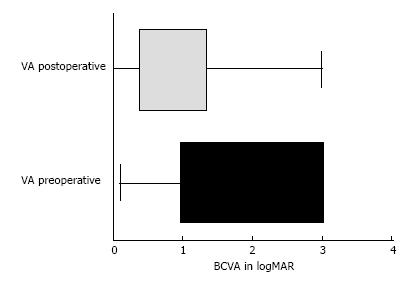
Figure 5 Comparison of pre- and postoperative visual acuity: Horizontal box-and - whiskers plot.
VA: Visual acuity; BCVA: Best-corrected visual acuity.
- Citation: Ferreira MA, Ferreira REA, Silva NS. Preoperative intravitreal bevacizumab and silicone oil tamponade for vitrectomy in diabetic retinopathy. World J Ophthalmol 2014; 4(3): 75-81
- URL: https://www.wjgnet.com/2218-6239/full/v4/i3/75.htm
- DOI: https://dx.doi.org/10.5318/wjo.v4.i3.75


