Copyright
©2012 Baishideng.
World J Obstet Gynecol. Oct 10, 2012; 1(3): 29-34
Published online Oct 10, 2012. doi: 10.5317/wjog.v1.i3.29
Published online Oct 10, 2012. doi: 10.5317/wjog.v1.i3.29
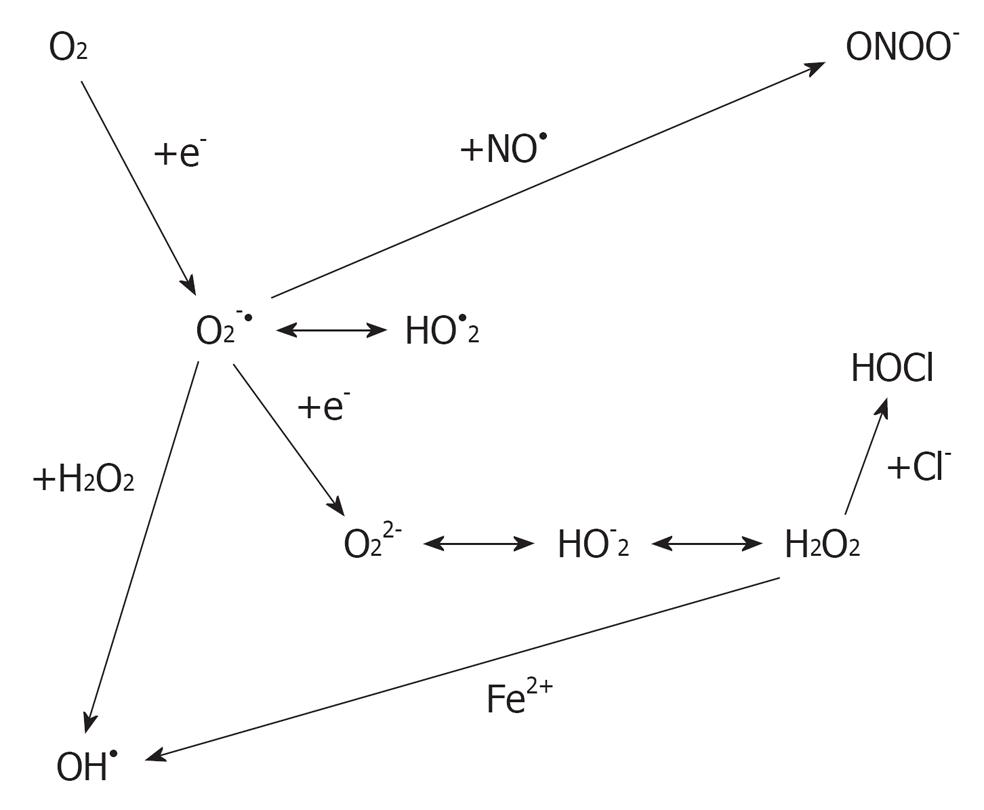
Figure 1 Derivation of reactive oxygen species from oxygen.
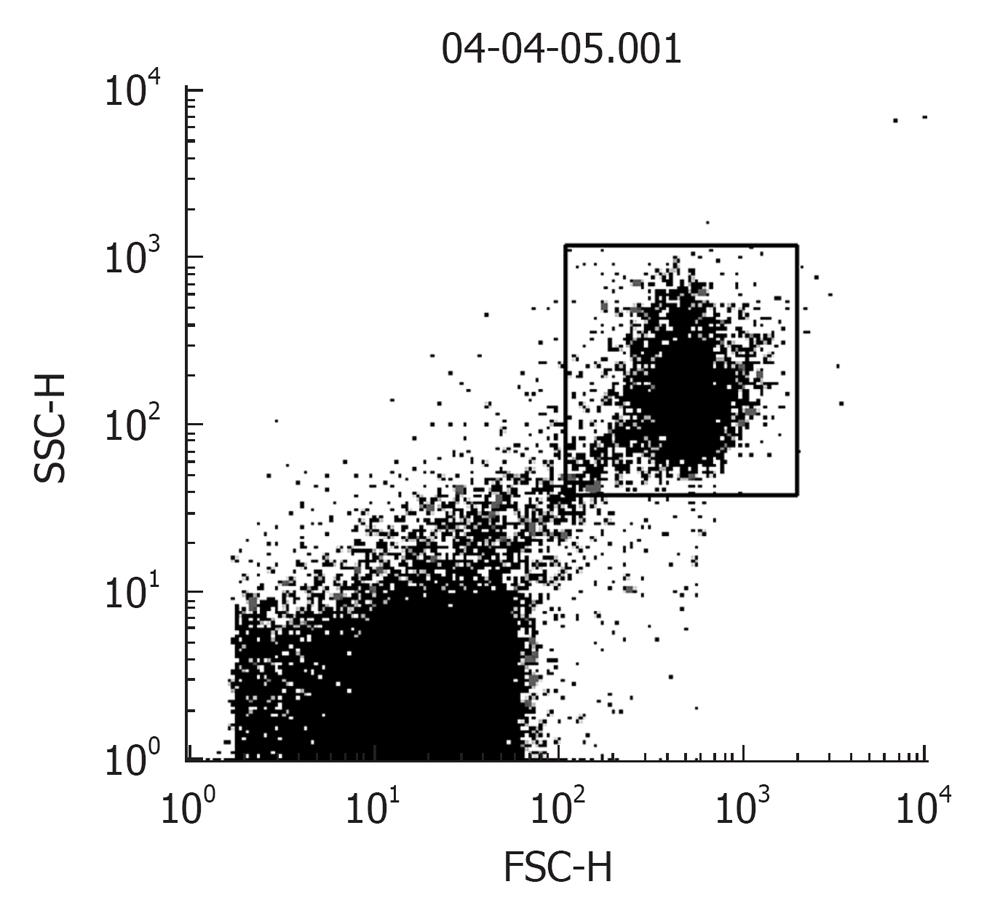
Figure 2 A dot plot of sperm cells showing the spread of the total recorded “events”.
Gated population (top right): sperm cells and bottom left: non-sperm particles, debris.
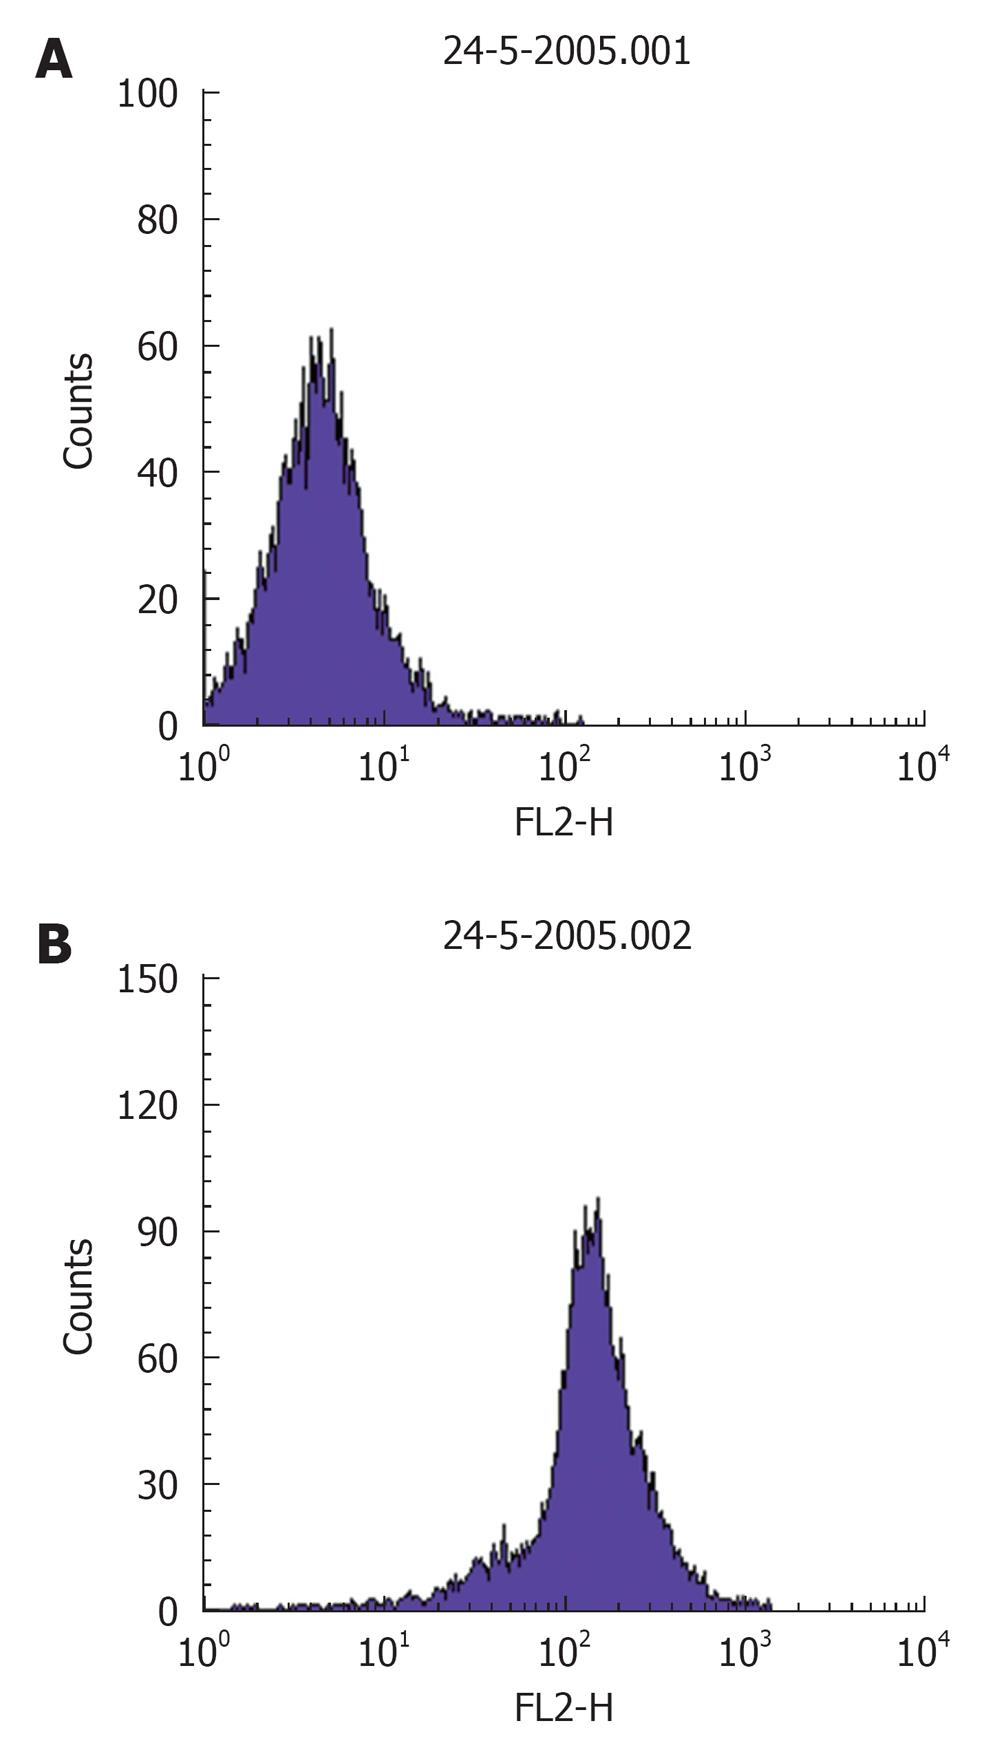
Figure 3 A representative frequency histogram showing baseline fluorescence (log) of DCFH on x-axis (A) and a shift to right depicting an increase in fluorescence intensity (B).
-
Citation: Lampiao F. Free radicals generation in an
in vitro fertilization setting and how to minimize them. World J Obstet Gynecol 2012; 1(3): 29-34 - URL: https://www.wjgnet.com/2218-6220/full/v1/i3/29.htm
- DOI: https://dx.doi.org/10.5317/wjog.v1.i3.29


