Copyright
©The Author(s) 2015.
World J Neurol. Dec 28, 2015; 5(4): 113-131
Published online Dec 28, 2015. doi: 10.5316/wjn.v5.i4.113
Published online Dec 28, 2015. doi: 10.5316/wjn.v5.i4.113
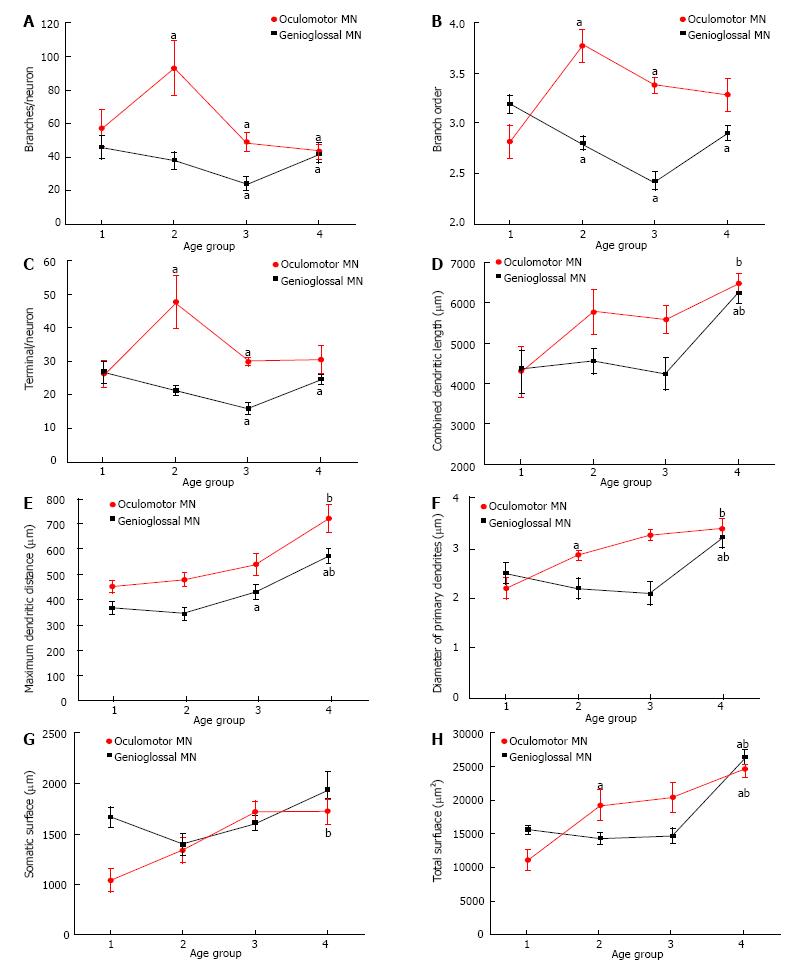
Figure 1 Postnatal maturation of morphological properties of motoneurons from genioglossal and oculomotor nuclei.
A-C: Changes in dendritic complexity measured as number of branches per neuron (A), branch order (B) and number of terminals per neuron (C). Note that in GG MNs complexity decreases up to P15 and then increases, while in OCM MNs there is an increase up to P10 and then decreases. The 2 opposite development strategies lead to the same outcome in the adult rat when compared with initial values; D and E: Changes in neuronal length measured as combined dendritic length (D) and maximum distance from soma to dendritic terminal (E). Note in D-E that dendritic length progressively increases for both populations of MNs with the most relevant changes at the late stages of development; F and H: Changes in neuronal size measured as diameter of primary dendrites (F), somatic surface (G) and total surface area (H). Note that in F and H OCM MNs grow between P1 and P10, while GG MNs increase mainly between P15 and P30. OCM MNs show a slow growth of the somatic surface along development, while it is already established at birth in the case of GG MNs. In this figure and the following: (1) the plots illustrate mean values for each parameter and age for OCM (red circle) and GG (black square) MNs; (2) measures are expressed in mean ± standard error; (3) the “a“ indicates statistical significance between two consecutive age groups; and (4) the “b“ represents statistical significance between age group 1 and age group 4. The age groups 1, 2, 3 and 4 correspond to P1-P5, P6-P10, P11-P15 and P21-P30, respectively. The data from GG[5,7] and OCM[11] come from previous studies. MNs: Motoneurons; GG: Genioglossal; OCM: Oculomotor.
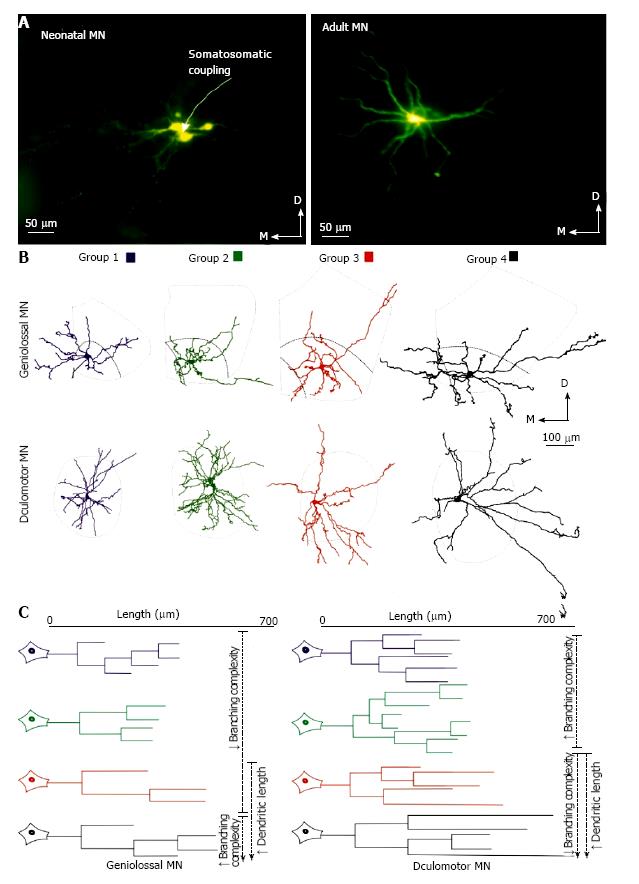
Figure 2 Summary of the main morphological changes of motoneurons from genioglossal and oculomotor nuclei.
A: Photomicrographs of representative GG MNs injected intracellularly with Lucifer yellow in a newborn (left image) and juvenile adult rat (right image). Note the presence of coupling between neonatal MNs. Only one cell was injected, however 3-4 are labeled; B: Changes in nucleus size and dendritic arborization orientation of MNs during postnatal development. It is remarkable that dendrites in the younger MNs are restricted to the nucleus boundaires, whereas the 2 oldest groups show some portions of dendrites outside those limits, preferably in the ventrolateral axis. The outer line indicates the boundary of the nuclei, and the inner line shows the limits of the GG nucleus; C: Dendrograms for a representative dendrite for each age group of GG (left) and OCM (right) MNs. Note the growth in length for both groups of MNs and the changes in dendrite architecture that take place during development. The data from GG[3,5] and OCM[11] come from previous studies. MNs: Motoneurons; GG: Genioglossal; OCM: Oculomotor.
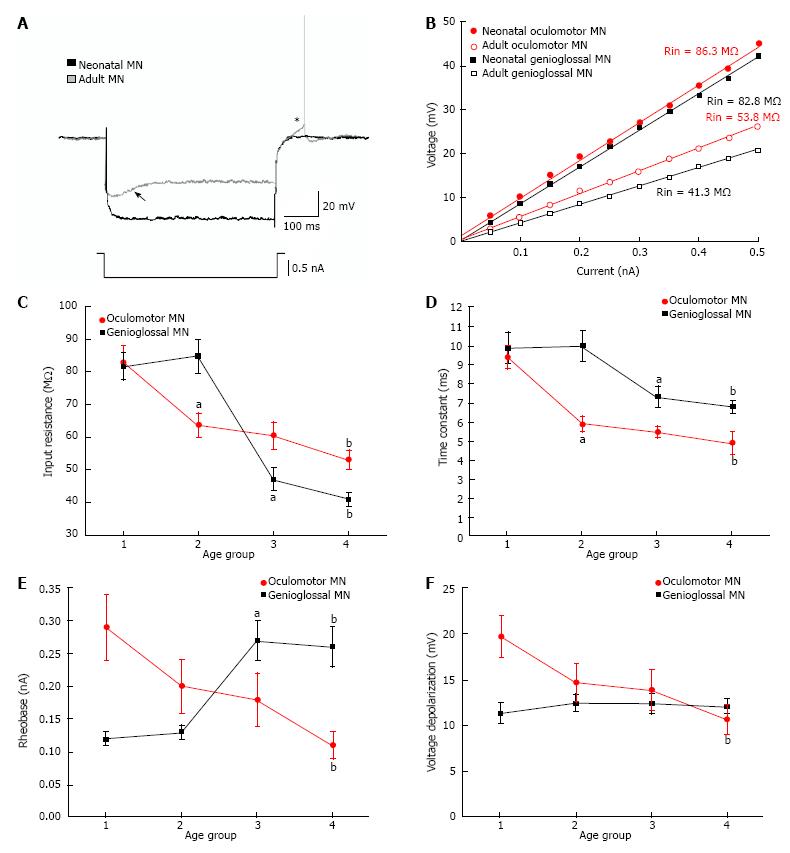
Figure 3 Postnatal maturation of passive membrane properties of motoneurons from genioglossal and oculomotor nuclei.
A: Voltage membrane response for one representative GG neonatal MN and one representative adult MN to negative current pulses of 0.8 nA. As shown, the same current amplitude of current evokes a larger hyperpolarization in the youngest MN. Also note the presence of sag (see arrow) and postinhibitory rebound (asterisk) in the adult MN but not in the neonatal one; B: Relationship between current intensity and voltage response in neonatal and adult MNs: Neonatal OCM MN (filled red circle); adult OCM MN (open red circle); neonatal GG MN (filled black square); adult GG MN (open black square). The slope of the relationship determines input resistance. Note that, for both populations of MNs, input resistance decreases with development although this decrement is bigger for GG MNs; C-F: Plots illustrating changes on input resistance (C), time constant (D), rheobase (E) and voltage depolarization (F) during postnatal development for GG and OCM MNs. Input resistance and time constant decrease during development in both populations, while rheobase increases in GG MNs and decreases in OCM MNs. The "a" indicates statistical significance between two consecutive age groups; and the "b" represents statistical significance between age group 1 and age group 4. The age groups 1,2,3 and 4 correspond to P1-P5, P6-P10, P11-P15 and P21-P30, respectively. The data from GG[4] and OCM[10] come from previous studies. MNs: Motoneurons; GG: Genioglossal; OCM: Oculomotor.
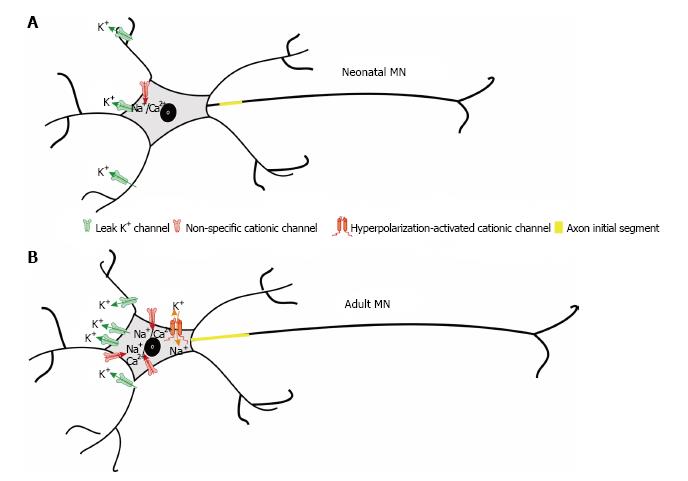
Figure 4 Hypothesis of mechanisms underlying input resistance and rheobase modifications during development.
Schematic drawings illustrating proposed differences in ion channels (number, type and distribution) and axon initial segment (length and proximity to soma), between neonatal (A) and adult (B) MNs. Note that, in the adult MN, the axon initial segment is represented larger and closer to soma. Besides, in the neonatal MN, leak potassium channels are located more distal to the soma and in a less number. Hyperpolarization-activated cationic channels responsible to the sag are only present in the adult MN, with a high number of non-specific cationic channels responsible for the persistent calcium and sodium currents. MNs: Motoneurons.
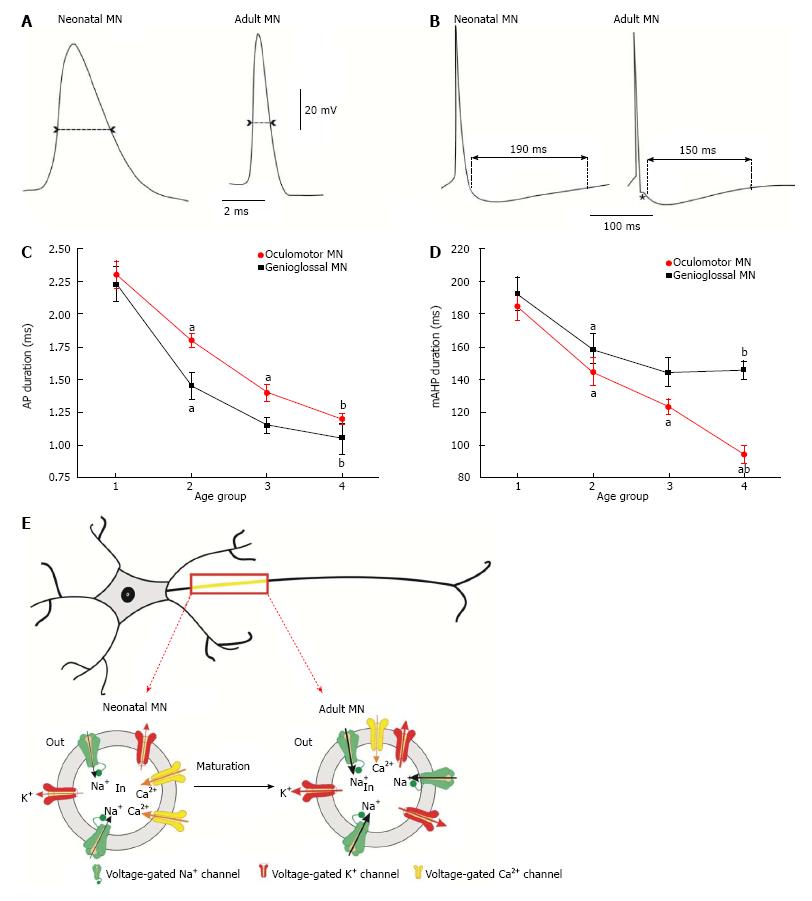
Figure 5 Postnatal maturation of action potential characteristics of motoneurons from genioglossal and oculomotor nuclei.
A and B: Recordings illustrating a representative action potential from one neonatal and one adult MN, at two different time scales, emphasizing the duration of the action potential (A) and the duration of the medium afterhyperpolarization phase of the action potential (B). Note the shortening in both phases during development. Also remarkable the presence of afterdepolarization phase in the adult MN (see asterisk); C and D: Plots illustrating the changes on action potential duration (C), and medium afterhyperpolarization phase duration (D) during postnatal development for GG and OCM MNs. Both populations show a decrease in these parameters. However it should be noted that, in GG MNs, changes in the afterhyperpolarization phase cease to decrease at the second postnatal week and, in the OCM MNs, this decrease is bigger and continuous up to P30; E: Schematic drawing illustrating proposed differences in ion channels (number and kinetics) underlying action potentials between neonatal and adult MNs. Note, for the adult MN, a higher number of potassium and sodium voltage gated channels and larger conductances (thick arrows) when compared with the neonatal MN. We also proposed the existence of less voltage gated calcium channels with lower conductances (thin arrows) for the adult MNs. The "a" indicates statistical significance between two consecutive age groups; and the "b" represents statistical significance between age group 1 and age group 4. The age groups 1,2,3 and 4 correspond to P1-P5, P6-P10, P11-P15 and P21-P30, respectively. The data from GG[4] and OCM[10] come from previous studies. MNs: Motoneurons; GG: Genioglossal; OCM: Oculomotor.
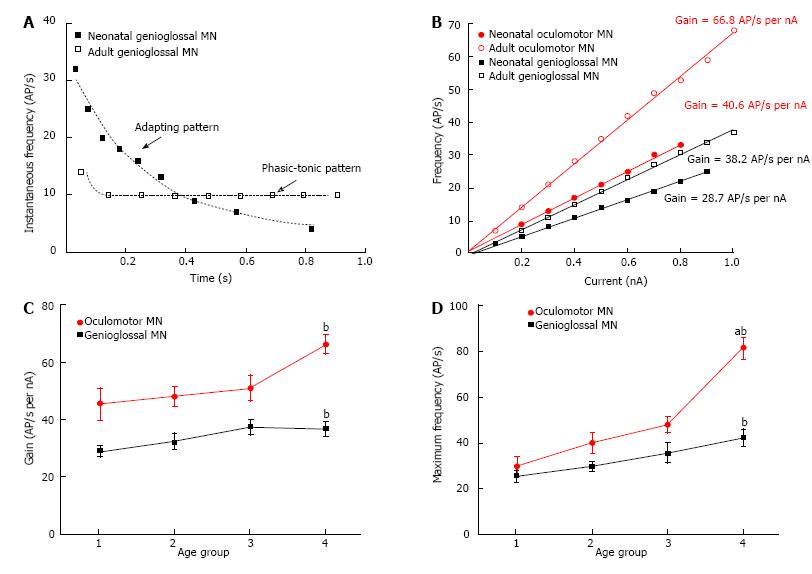
Figure 6 Postnatal maturation of repetitive firing properties of motoneurons from genioglossal and oculomotor nuclei.
A: Instantaneous firing frequency evoked by depolarizing current stimulus of 0.3 nA for a representative MN from the GG nucleus. Only the neonatal MN shows an adapting firing pattern while the adult MN shows a phasic-tonic pattern; B: Relationship between current (I) and firing (F) for a representative neonatal MN (filled red circle) and an adult OCM MN (open red circle); and for a representative neonatal MN (filled black square) and an adult MN (open black square). The slope of the I-F relationship is the gain; C, D: Plots illustrating the changes on gain (C) and maximum firing frequency (D) during postnatal development for GG and OCM MNs. Note that gain and maximun firing frequency increase with age, although these increments are larger for OCM MNs. The "a" indicates statistical significance between two consecutive age groups; and the "b" represents statistical significance between age group 1 and age group 4. The age groups 1,2,3 and 4 correspond to P1-P5, P6-P10, P11-P15 and P21-P30, respectively. The data from GG[4] and OCM[10] come from previous studies. MNs: Motoneurons; GG: Genioglossal; OCM: Oculomotor.
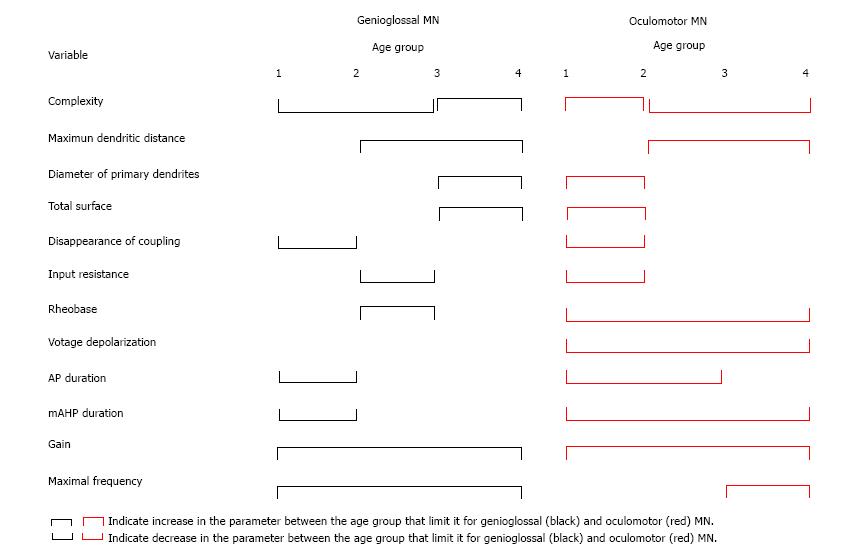
Figure 7 Summary of changes during postnatal periods for genioglossal (black) and oculomotor (red) motoneuron.
MNs: Motoneurons.
- Citation: Carrascal L, Nieto-González J, Pardillo-Díaz R, Pásaro R, Barrionuevo G, Torres B, Cameron WE, Núñez-Abades P. Time windows for postnatal changes in morphology and membrane excitability of genioglossal and oculomotor motoneurons. World J Neurol 2015; 5(4): 113-131
- URL: https://www.wjgnet.com/2218-6212/full/v5/i4/113.htm
- DOI: https://dx.doi.org/10.5316/wjn.v5.i4.113


