Copyright
©2013 Baishideng Publishing Group Co.
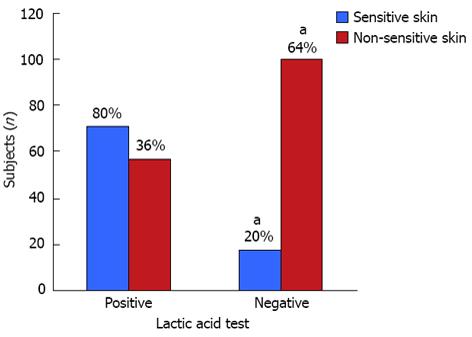
Figure 1 Relationship between the lactic acid stinging test response and self-diagnosis of sensitive skin in study subjects.
Of the 246 subjects, 128 were positive and 118 were negative for the test. Bars represent the proportion of subjects with self-diagnosis of sensitive (n = 89) and non-sensitive skin (n = 157) and their results to the test. χ2 test, aP < 0.05 vs positive for the test.
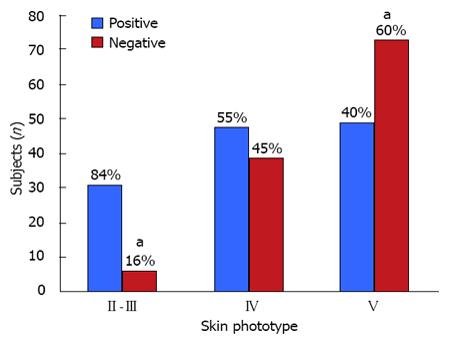
Figure 2 Relationship between skin phototype and lactic acid stinging test response.
Subjects with lighter skin phototypes were more prone to display a positive response to lactic acid stinging test (84%), than subjects with the darker skin phototype in the sample population (40%). χ2 test, aP < 0.05 vs positive for the test.
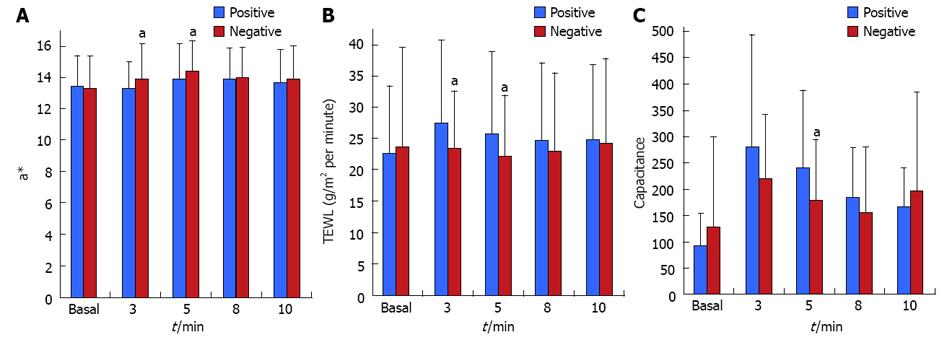
Figure 3 Differences in the skin biophysical response between those that were positive (n = 128) or negative (n = 118) to LAST.
A: a* values, in arbitrary units; B: Transepidermal water loss, in g/m2 per minute; C: Capacitance, in arbitrary units. Bars represent the mean and error bars represent the standard deviation. Mann-Whitney U test, aP < 0.05 vs positive for the test.
- Citation: Hernández-Blanco D, Castanedo-Cázares JP, Ehnis-Pérez A, Jasso-Ávila I, Conde-Salazar L, Torres-Álvarez B. Prevalence of sensitive skin and its biophysical response in a Mexican population. World J Dermatol 2013; 2(1): 1-7
- URL: https://www.wjgnet.com/2218-6190/full/v2/i1/1.htm
- DOI: https://dx.doi.org/10.5314/wjd.v2.i1.1


