Copyright
©2014 Baishideng Publishing Group Co.
World J Anesthesiol. Mar 27, 2014; 3(1): 96-104
Published online Mar 27, 2014. doi: 10.5313/wja.v3.i1.96
Published online Mar 27, 2014. doi: 10.5313/wja.v3.i1.96
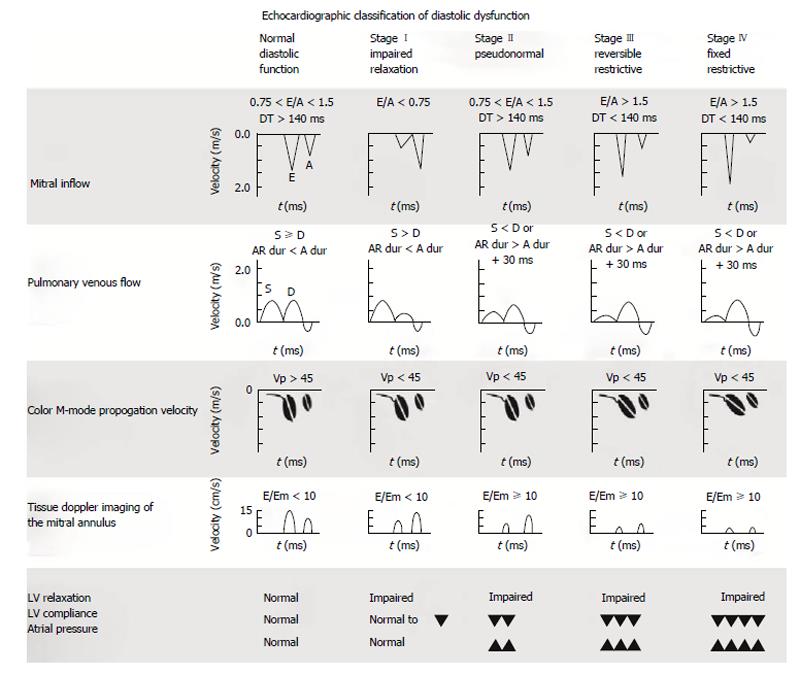
Figure 1 Diastolic function classification.
Echocardiographic classification of diastolic dysfunction adapted for transesophageal echocardiography is shown. A: Peak late diastolic transmitral flow velocity; A dur: Duration of mitral inflow A-wave; AR dur: Peak pulmonary venous atrial reversal flow velocity duration; D: Peak diastolic pulmonary venous flow velocity; DT: Deceleration time; E: Peak early diastolic transmitral flow velocity; Em: Peak early diastolic myocardial velocity; LV: Left ventricle; S: Peak systolic pulmonary venous flow velocity; Vp: Flow propagation velocity. With permission of Informa Healthcare adapt from reference[36].
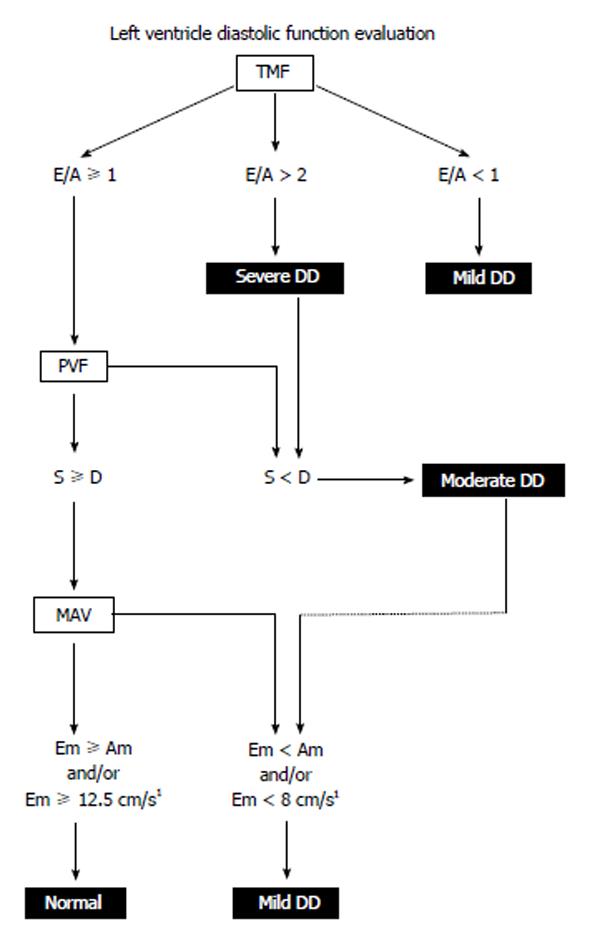
Figure 2 Left ventricle diastolic dysfunction algorithm.
LV diastolic function is classified using pulsed wave Doppler of the TMF, PVF and tissue Doppler examination of MAV. Patients with a pacemaker, atrial fibrillation, non-sinus rhythm, mitral stenosis, severe mitral and aortic regurgitation are excluded from analysis. 1Normal Em is within an 8-12.5 cm/s interval. A: Peak late diastolic TMF velocity; Am: Peak late diastolic MAV; D: Peak diastolic PVF velocity; DD: Diastolic dysfunction; E: Peak early diastolic TMF velocity; Em: Peak early diastolic MAV; LV: Left ventricle; MAV: Mitral annular velocity; PVF: Pulmonary venous flow; S: Peak systolic PVF velocity; TMF: Transmitral flow. With permission of Informa Healthcare adapt from reference[36].
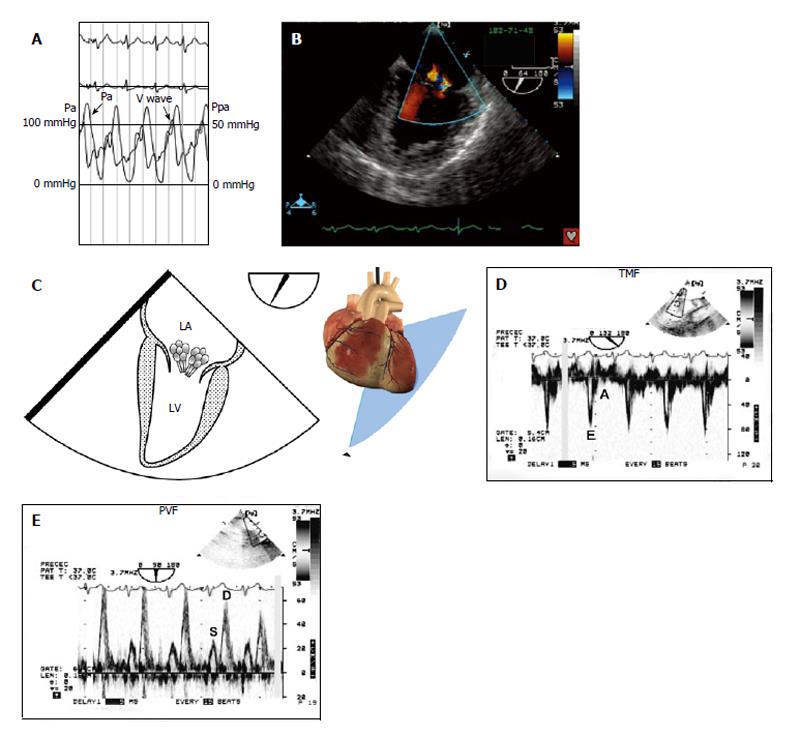
Figure 3 Stage III left ventricle diastolic dysfunction (restrictive filling).
A 61-year-old woman with cardiogenic shock is brought to the operating room for emergency coronary revascularization. A: She was hemodynamically unstable on an intra-aortic balloon pump and vasoactive support; B and C: A 50 mmHg “V” wave on the wedged pulmonary artery catheter tracing was seen without any significant mitral regurgitation on color flow imaging; D: TMF showed an E/A ratio > 2 with a deceleration time < 60 ms and isovolumic relaxation time of 40 ms; E: The left upper PVF showed an abnormal S/D ratio with S wave blunting; A: Peak late diastolic TMF velocity; D: Peak diastolic PVF velocity; E: Peak early diastolic TMF velocity. LA: Left atrium; LV: Left ventricle; Pa: Arterial pressure; Ppa: Pulmonary arterial pressure; PVF: Pulmonary venous flow; S: Peak systolic PVF velocity; TMF: Transmitral flow. With permission of Informa Healthcare adapt from reference[36].
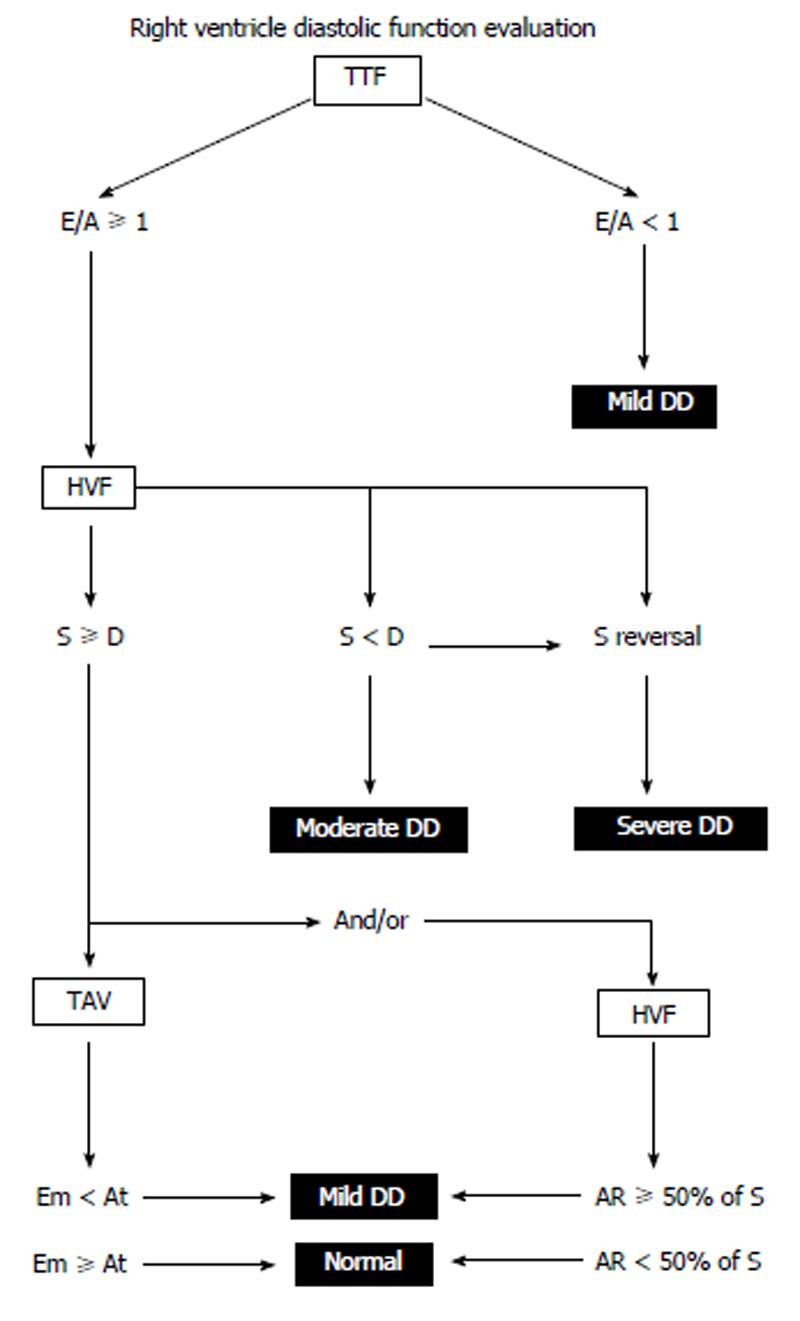
Figure 4 Right ventricle diastolic dysfunction algorithm.
Diastolic function is classified by pulsed wave Doppler of the TTF, HVF and tissue Doppler imaging of the TAV. Patients with a pacemaker, atrial fibrillation, non-sinus rhythm, moderate to severe tricuspid regurgitation and tricuspid annuloplasty are excluded from analysis. A: Peak late diastolic TTF velocity; AR: Peak atrial reversal HVF velocity; At: Peak late diastolic TAV; DD: Diastolic dysfunction; D: Peak diastolic HVF velocity; E: Peak early diastolic TTF velocity; Et: Peak early diastolic TAV; HVF: Hepatic venous flow; RV: Right ventricle; S: Peak systolic HVF velocity; TAV: Tricuspid annular velocity; TTF: Transtricuspid flow. With permission of Informa Healthcare adapt from reference[36].
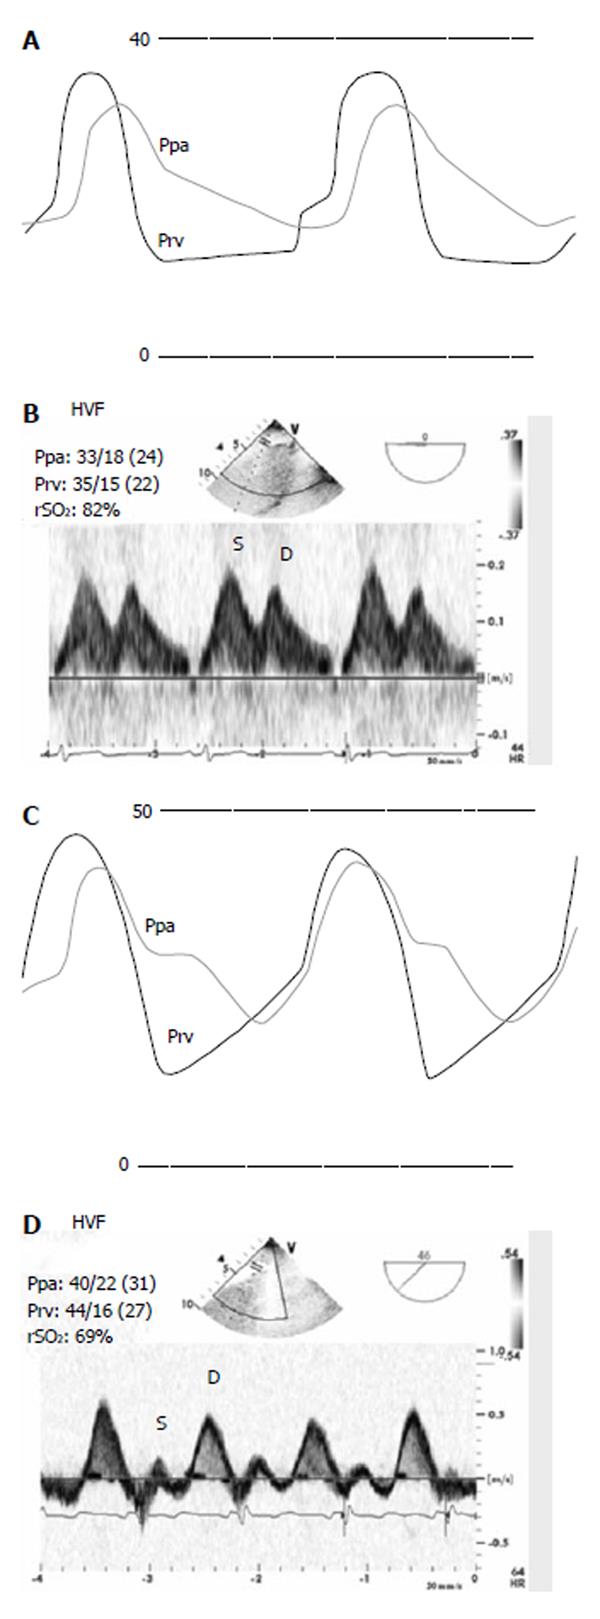
Figure 5 Zoomed right ventricular pressure and pulmonary artery pressure with their corresponding Doppler hepatic venous flow before (A, B) and after cardiopulmonary bypass.
Note the change in the diastolic slope of the right ventricular pressure (Prv) waveform and the corresponding change in the systolic (S) to diastolic (D) ratio of the hepatic venous flow. After cardiopulmonary bypass, the regional oxygen saturation of the brain (rSO2) was lower, but still within normal limits (60% ± 5%). With permission from Wolters Kluwer Health, Lippincott Williams and Wilkins adapt from reference[44]. HVF: Hepatic venous flow; Ppa: Pulmonary artery pressure.
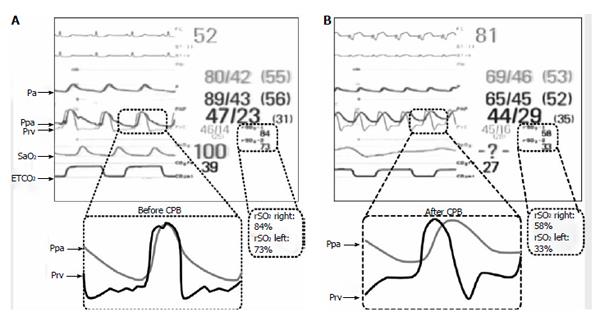
Figure 6 Hemodynamic waveforms combined with regional near infrared spectroscopy values obtained before (A) and after cardiopulmonary bypass (B).
The upper near infrared spectroscopy (NIRS) value was obtained from the right lower extremity and the lower NIRS value is from the brain. Note that after cardiopulmonary bypass (CPB), both values were reduced significantly. This was associated with failure to wean from CPB and significant hemodynamic instability. The etiology was a result of acute right ventricular (RV) failure, demonstrated on the right ventricular pressure (Prv) waveform. Note the change Prv from a normal shape before CPB to a square root sign, with diastolic equalisation after CPB. Note also that the pulmonary artery pressure (Ppa) systolic values were lower after CPB and non diagnostic of acute RV failure. The right atrial pressure was 16 mmHg compared to 14 mmHg before CPB. ETCO2: End-tidal carbon dioxide; Paf: Femoral arterial pressure; Par: Radial arterial pressure; SaO2: Oxygen saturation. With permission from Wolters Kluwer Health, Lippincott Williams and Wilkins adapt from reference[44].
- Citation: Denault AY, Couture P. Practical diastology. World J Anesthesiol 2014; 3(1): 96-104
- URL: https://www.wjgnet.com/2218-6182/full/v3/i1/96.htm
- DOI: https://dx.doi.org/10.5313/wja.v3.i1.96


