Copyright
©The Author(s) 2021.
World J Anesthesiol. Oct 13, 2021; 10(1): 1-6
Published online Oct 13, 2021. doi: 10.5313/wja.v10.i1.1
Published online Oct 13, 2021. doi: 10.5313/wja.v10.i1.1
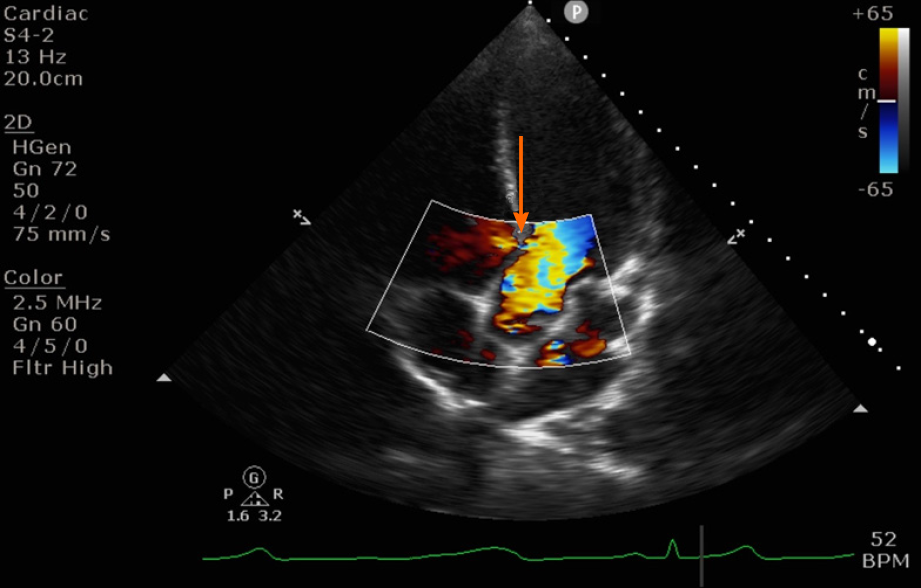
Figure 1
Transthoracic echocardiography apical 4 chamber view showing a small peri membranous ventricular septal defect with a left to right shunt (orange arrow).
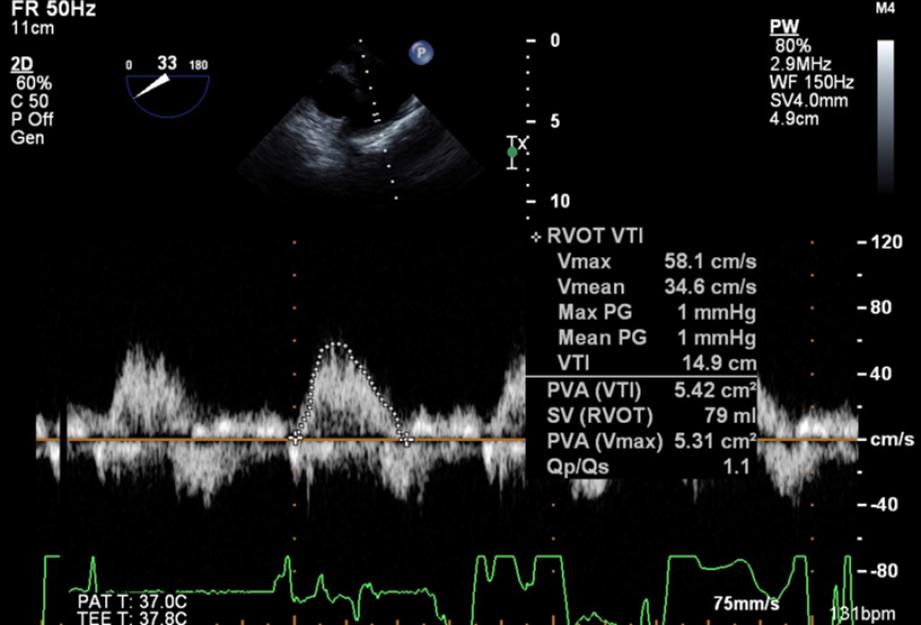
Figure 2
Continuity equation to calculate shunt fraction Qp:Qs using transesophageal echocardiography.
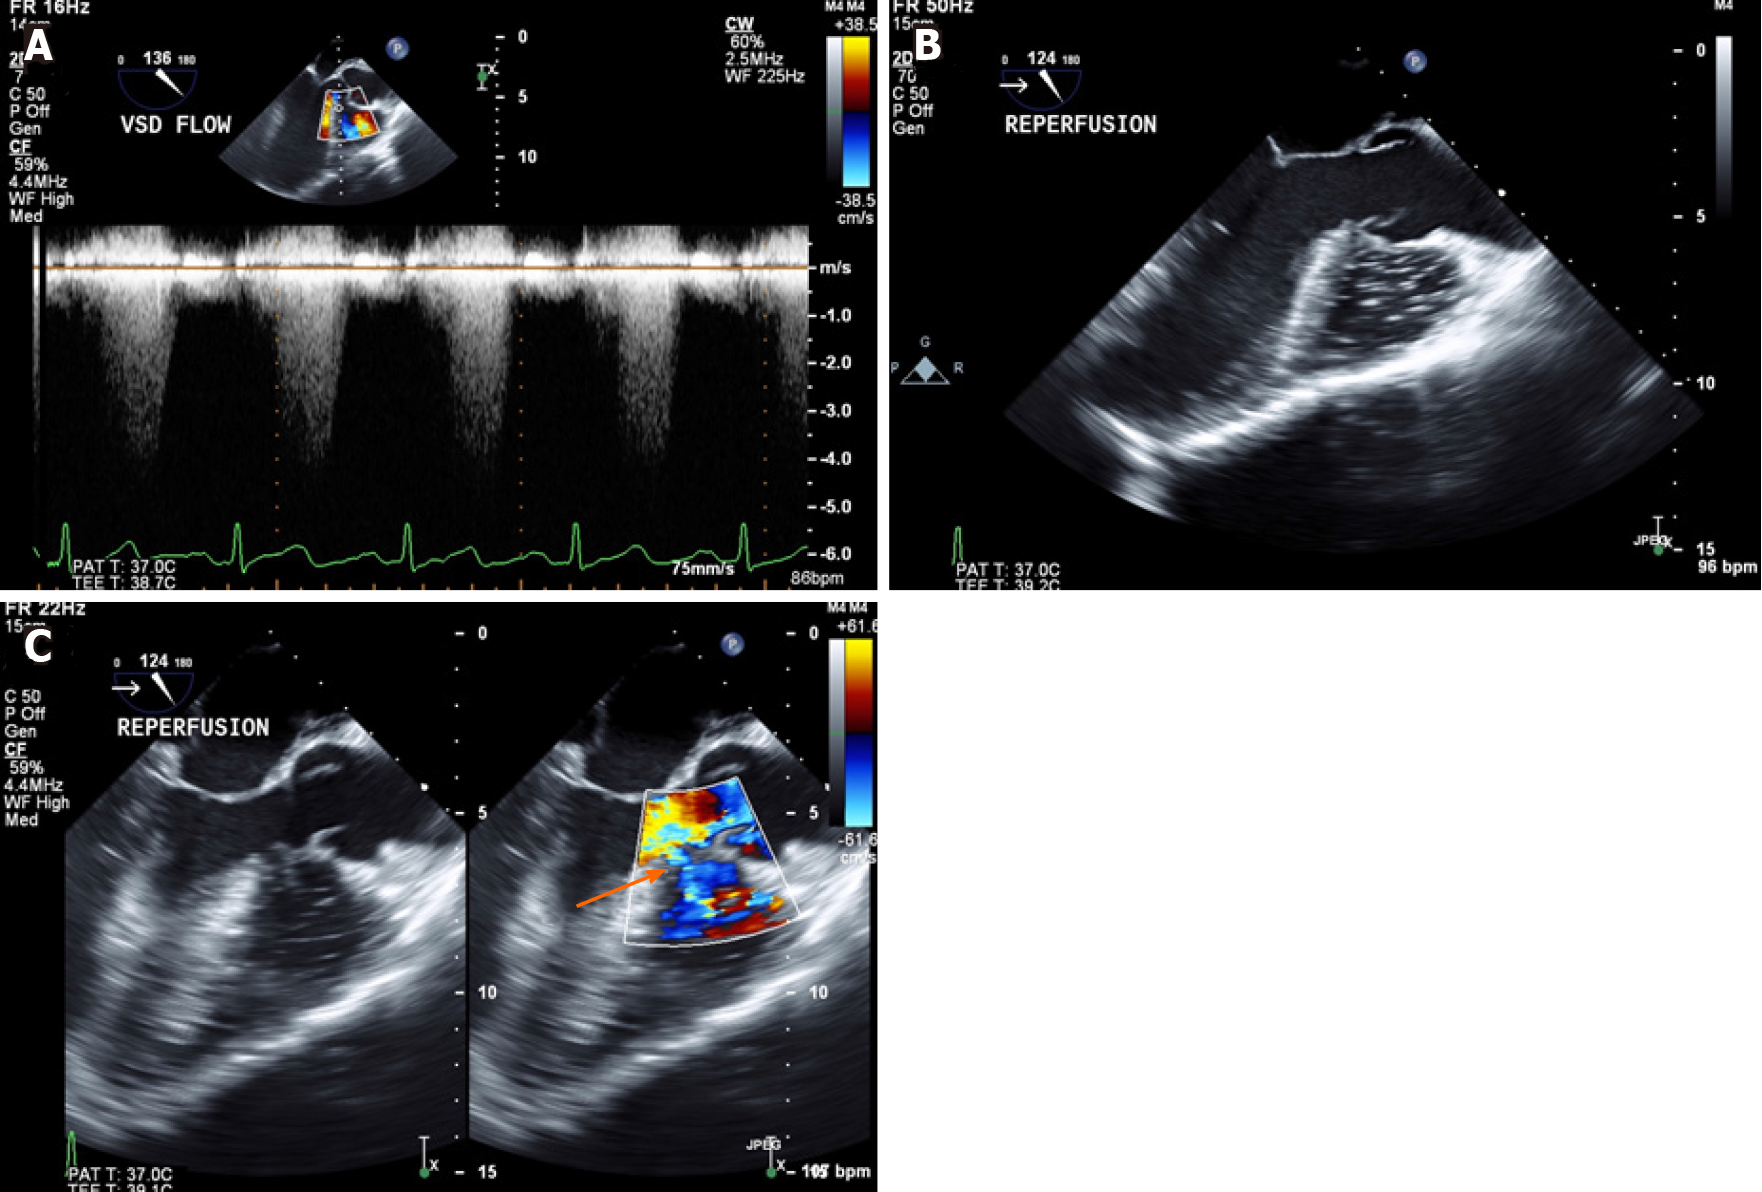
Figure 3 Transesophageal echocardiography mid esophageal long axis view.
A: Continuous wave doppler to calculate shunt flow velocity across the ventricular septal defect; B: Air/debris from newly implanted liver in the right ventricle only; C: Unchanged direction of left to right shunt (orange arrow) post reperfusion.
- Citation: Desai TV, Dhir A, Quan D, Zamper R. Intraoperative management of liver transplant in a patient with an undiagnosed ventricular septal defect: A case report. World J Anesthesiol 2021; 10(1): 1-6
- URL: https://www.wjgnet.com/2218-6182/full/v10/i1/1.htm
- DOI: https://dx.doi.org/10.5313/wja.v10.i1.1


