Copyright
©The Author(s) 2018.
World J Orthop. Sep 18, 2018; 9(9): 120-129
Published online Sep 18, 2018. doi: 10.5312/wjo.v9.i9.120
Published online Sep 18, 2018. doi: 10.5312/wjo.v9.i9.120
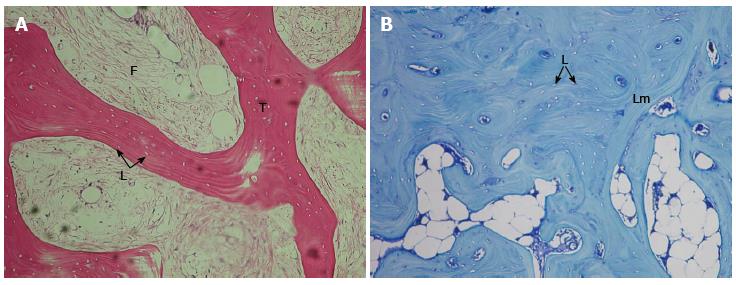
Figure 1 Cryosurgically-induced osteonecrosis of the femoral head (No-t group).
The specimen was retrieved 12 wk postoperatively. A: Cancellous lamellar bone (T) with empty bone lacunae (L) marked with arrows, and fibrotic/loose connective tissue marrow space (F), indicating osteonecrosis (Obj. × 10, H and E); B: Lamellar compact bone (Lm) of cortical type, in between spaces filled with adipose tissue (A). The absence of nuclei in osteocyte’s lacunae (L) (marked with arrows) indicates that the bone is necrotic (Obj. × 10, TB).
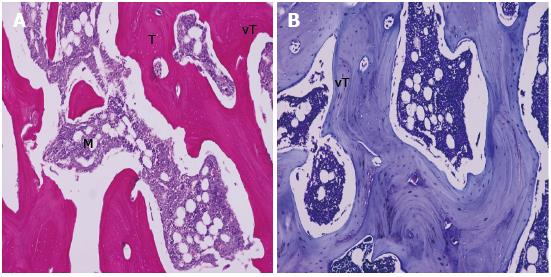
Figure 2 Osteonecrosis of the femoral head treated with a single injection of 500 μg vascular endothelial growth factor (t-VEGFμ group); specimen retrieved 12 wk postoperatively.
A well-formed cancellous bone network with thickened lamellar trabeculae is visible, while the in between spaces are filled with normal marrow cells (M). A: Newly formed (vT) were noticed on the surface of the trabeculae (T) (Obj. × 10, H and E). B: Almost all trabeculae’s (T) surface is covered by newly (vT) formed bone (Obj. × 10, TB).
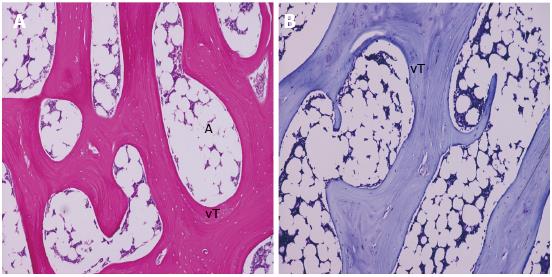
Figure 3 Osteonecrosis of the femoral head treated with prolonged delivery of 500 μg of vascular endothelial growth factor through a pump (t-VEGFpump-μ group).
At 12 wk postoperatively, a well-formed trabecular network is visible, with slightly thickened lamellar trabeculae, and normal marrow cells and adipose tissue (A) in between. A: Few trabeculae are covered by newly formed bone (vT), the presence of nuclei in lacunae is noticed (Obj. × 10, H and E); B: New bone (vT) formation is observed on the surface of some trabeculae (Obj. × 10, TB).
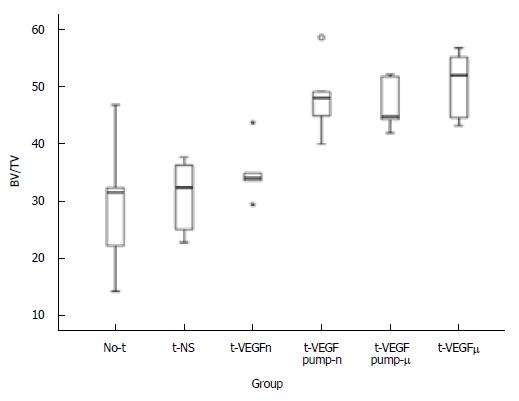
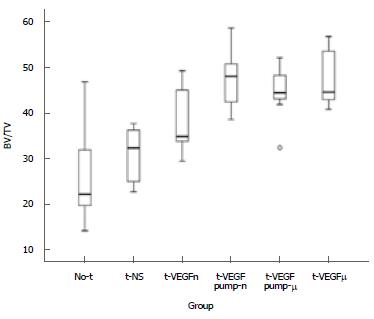
Figure 4 Comparative boxplot of the bone volume/total volume values across the different groups for the decalcified specimens.
BV/TV: Bone volume/total volume; VEGF: Vascular endothelial growth factor.
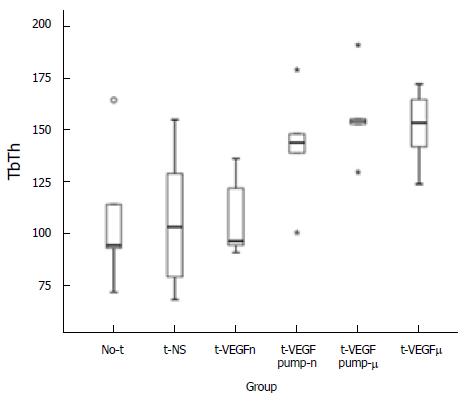
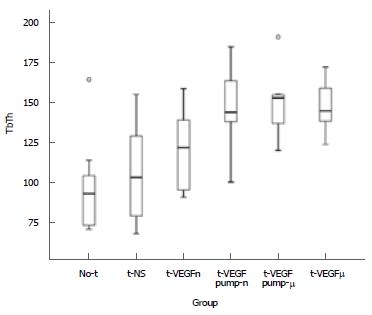
Figure 5 Comparative boxplot of the trabecular thickness values across the different groups for the decalcified specimens.
Higher box and whiskers stand for higher TbTh values. TbTh: Trabecular thickness; VEGF: Vascular endothelial growth factor.
Figure 6 Comparative boxplot of the bone volume/total volume values across the different groups for the decalcified and non-decalcified specimens.
BV/TV: Bone volume/total volume; VEGF: Vascular endothelial growth factor.
Figure 7 Comparative boxplot of the trabecular thickness values across the different groups for the decalcified and non-decalcified specimens.
Higher box and whiskers stand for higher TbTh values. TbTh: Trabecular thickness; VEGF: Vascular endothelial growth factor.
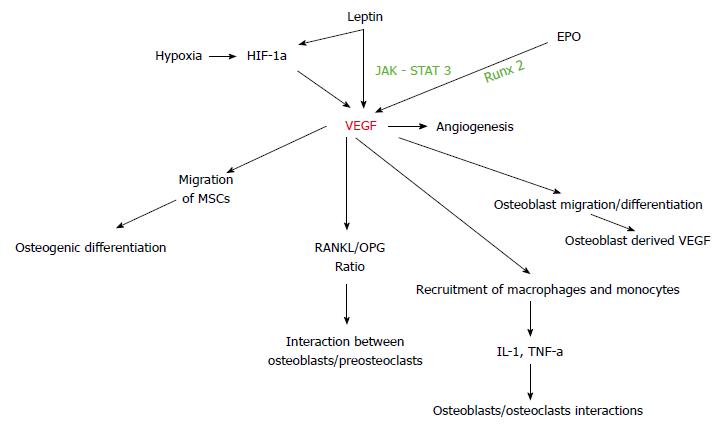
Figure 8 Diagram summarizing potential interactions of vascular endothelial growth factor related to bone tissue healing in femoral head osteonecrosis.
VEGF: Vascular endothelial growth factor; HIF: Hypoxia–inducible factor; EPO: Erythropoietin; TNF: Tumor necrosis factor; IL: Interleukin.
- Citation: Dailiana ZH, Stefanou N, Khaldi L, Dimakopoulos G, Bowers JR, Fink C, Urbaniak JR. Vascular endothelial growth factor for the treatment of femoral head osteonecrosis: An experimental study in canines. World J Orthop 2018; 9(9): 120-129
- URL: https://www.wjgnet.com/2218-5836/full/v9/i9/120.htm
- DOI: https://dx.doi.org/10.5312/wjo.v9.i9.120


