Copyright
©The Author(s) 2017.
World J Orthop. May 18, 2017; 8(5): 385-393
Published online May 18, 2017. doi: 10.5312/wjo.v8.i5.385
Published online May 18, 2017. doi: 10.5312/wjo.v8.i5.385
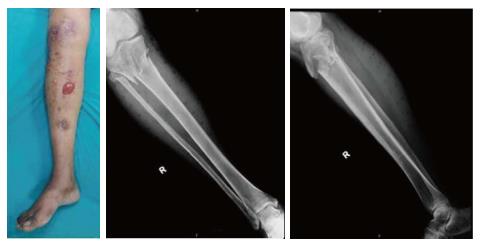
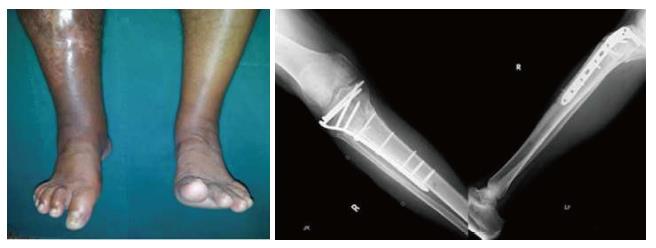
Figure 1 Clinical photograph and radiograph of a patient with right proximal tibial fracture and compartment syndrome.
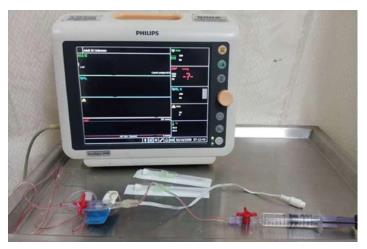
Figure 2 Equipment used for compartment pressure measurement; 18G iv cannula, saline filled line with electronic transducer and Philips VM8 monitor.
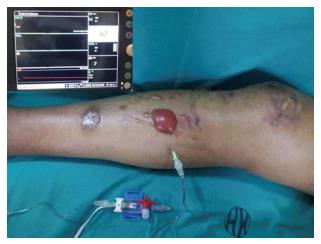
Figure 3 Deep posterior compartment pressure of 67 mmHg in the same patient (clinical photograph in Figure 1).
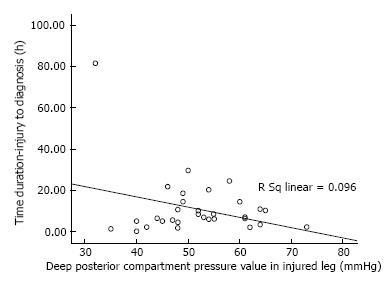
Figure 4 Correlation of time since injury to pressure values.
Figure 5 Residual right side toe deformity and ankle stiffness in a patient (shown in Figure 1) at follow up, X-ray of fracture union of this patient.
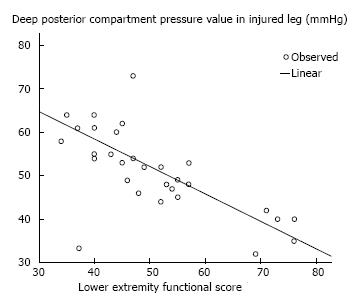
Figure 6 Negative correlation plot of lower extremity functional scale with rising pressure (Pearson’s R = -0.
814, P < 0.001).
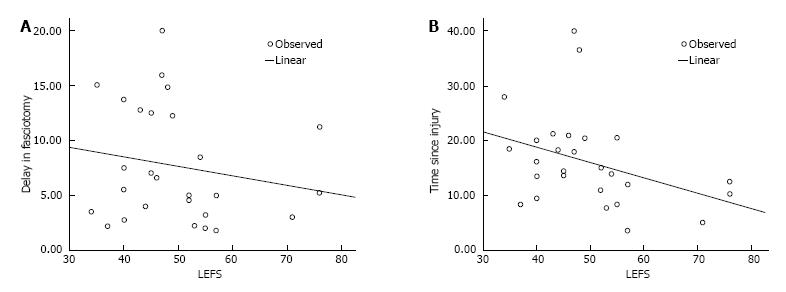
Figure 7 Correlation of (A) fasciotomy delay (Pearson’s R= -0.
182, P = 0.928) and (B) time since injury (Pearson’s R = -0.369, P = 1.984) with lower extremity functional scale. LEFS: Lower extremity functional score.
- Citation: Goyal S, Naik MA, Tripathy SK, Rao SK. Functional outcome of tibial fracture with acute compartment syndrome and correlation to deep posterior compartment pressure. World J Orthop 2017; 8(5): 385-393
- URL: https://www.wjgnet.com/2218-5836/full/v8/i5/385.htm
- DOI: https://dx.doi.org/10.5312/wjo.v8.i5.385


