Copyright
©The Author(s) 2017.
World J Orthop. Apr 18, 2017; 8(4): 350-356
Published online Apr 18, 2017. doi: 10.5312/wjo.v8.i4.350
Published online Apr 18, 2017. doi: 10.5312/wjo.v8.i4.350
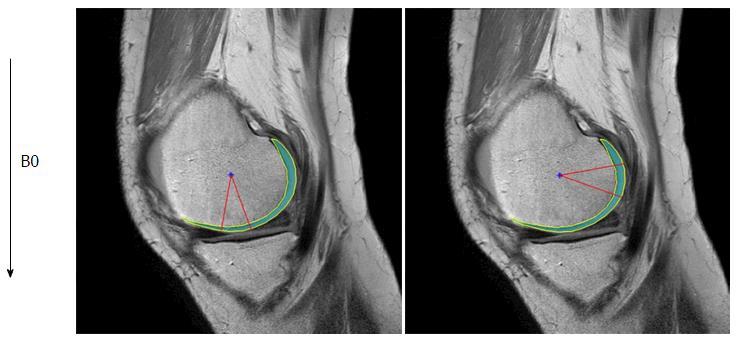
Figure 1 T2 and T1ρ relaxation time measurement.
T2 and T1ρ relaxation times were measured in a range of -10 to 20 degrees for the distal condyle and 70 to 100 degrees for the posterior condyle. The angle 0 is defined along B0.
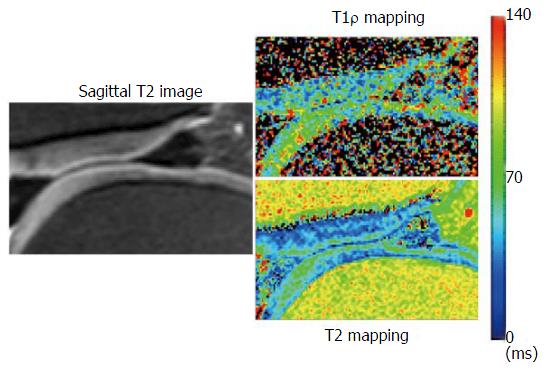
Figure 2 Example of sagittal fat suppressed proton density-weighted imaging, T1ρ mapping and T2 mapping.
Figure 3 Example of normal thickness magnetic resonance imaging with corresponding hematoxylin and eosin, Alcian blue, and Masson trichrome stains.
OA grade/stage/score in this case is 4/3/12, compatible with early OA. MRI: Magnetic resonance imaging; HE: Hematoxylin and eosin; OA: Osteoarthritis.
- Citation: Kester BS, Carpenter PM, Yu HJ, Nozaki T, Kaneko Y, Yoshioka H, Schwarzkopf R. T1ρ/T2 mapping and histopathology of degenerative cartilage in advanced knee osteoarthritis. World J Orthop 2017; 8(4): 350-356
- URL: https://www.wjgnet.com/2218-5836/full/v8/i4/350.htm
- DOI: https://dx.doi.org/10.5312/wjo.v8.i4.350


