Copyright
©The Author(s) 2017.
World J Orthop. Dec 18, 2017; 8(12): 881-890
Published online Dec 18, 2017. doi: 10.5312/wjo.v8.i12.881
Published online Dec 18, 2017. doi: 10.5312/wjo.v8.i12.881
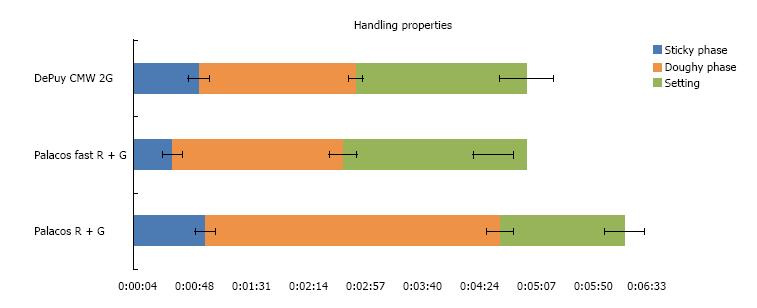
Figure 1 Graphical presentation of handling properties (sticky phase, doughy phase and setting) of tested fast setting cements and the reference material.
Data is presented as mean ± SD.
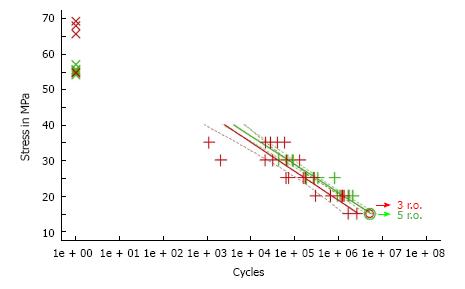
Figure 2 Fatigue strength (n = 5 × 10⁶ cycles) of both tested fast setting cements, CMW® 2G (in red) and Palacos® fast R + G (in green).
Data is presented in a S/N curve. Lines: Result of the linear regression and the “narrow” confidence band at the 95% level; x: Quasi-static values; +: Failed under fatigue load; o: Run-outs, regression with + and o.
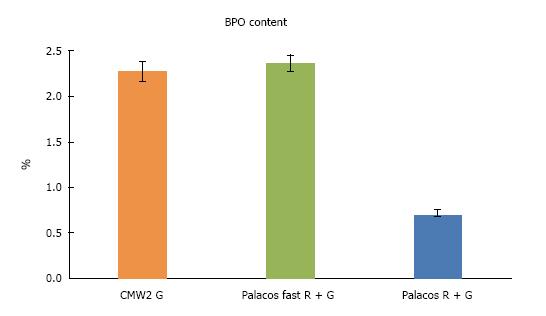
Figure 3 Graphical presentation of Benzoyl Peroxide-content of all tested cements.
Data is presented as mean ± SD. BPO: Benzoyl peroxide.
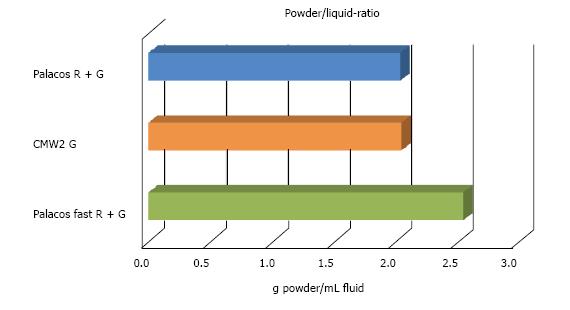
Figure 4 Graphical presentation of powder/liquid ratio of all tested cements.
Data is presented as absolute.
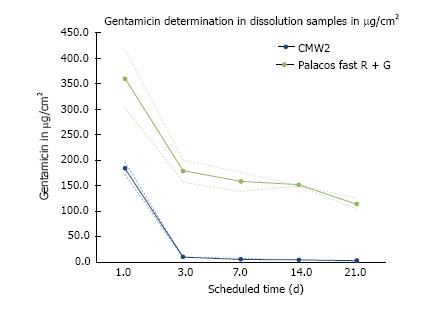
Figure 5 Graphical presentation of elution profile of CMW® 2G (in blue) and Palacos® fast R + G (in green) (specimen surface 3.
1 cm2). Data is presented as mean ± SD.
- Citation: Caraan NA, Windhager R, Webb J, Zentgraf N, Kuehn KD. Role of fast-setting cements in arthroplasty: A comparative analysis of characteristics. World J Orthop 2017; 8(12): 881-890
- URL: https://www.wjgnet.com/2218-5836/full/v8/i12/881.htm
- DOI: https://dx.doi.org/10.5312/wjo.v8.i12.881


