Copyright
©The Author(s) 2017.
World J Orthop. Oct 18, 2017; 8(10): 761-769
Published online Oct 18, 2017. doi: 10.5312/wjo.v8.i10.761
Published online Oct 18, 2017. doi: 10.5312/wjo.v8.i10.761
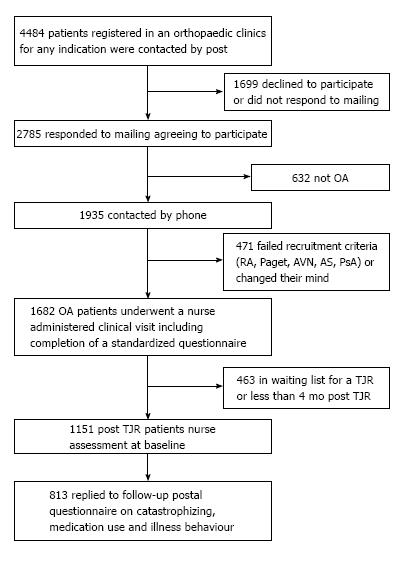
Figure 1 Flow-chart of participant recruitment for the current study.
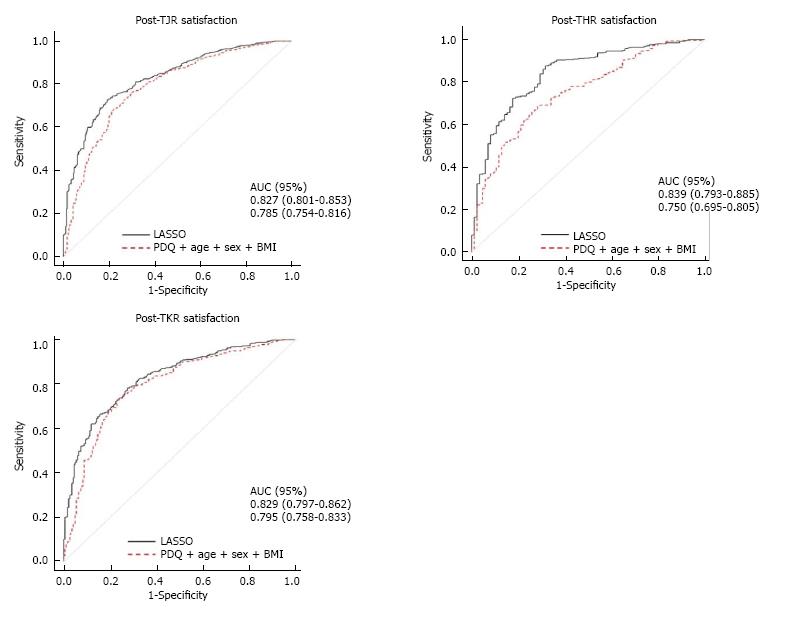
Figure 2 Receiver operator characteristic curves adjusted for age, sex and body mass index to show the amount of post-surgery satisfaction predicted by preoperative radiographic severity, pain-DETECT questionnaire scores and the best fit model.
A: Post-TJR (THR and TKR combined); B: Post-TKR; C: Post-THR. TJR: Total joint replacement; THR: Total hip replacement; TKR: Total knee replacement.
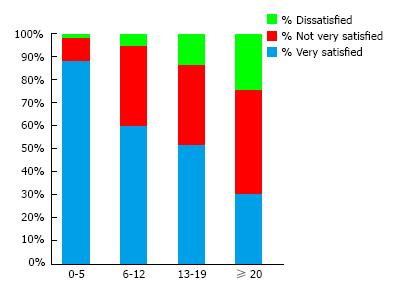
Figure 3 Proportion of post-total joint replacement patients reporting to be dissatisfied, not very satisfied or very satisfied depending on their pain-DETECT score.
- Citation: Warner SC, Richardson H, Jenkins W, Kurien T, Doherty M, Valdes AM. Neuropathic pain-like symptoms and pre-surgery radiographic severity contribute to patient satisfaction 4.8 years post-total joint replacement. World J Orthop 2017; 8(10): 761-769
- URL: https://www.wjgnet.com/2218-5836/full/v8/i10/761.htm
- DOI: https://dx.doi.org/10.5312/wjo.v8.i10.761


