Copyright
©The Author(s) 2016.
World J Orthop. Oct 18, 2016; 7(10): 678-686
Published online Oct 18, 2016. doi: 10.5312/wjo.v7.i10.678
Published online Oct 18, 2016. doi: 10.5312/wjo.v7.i10.678
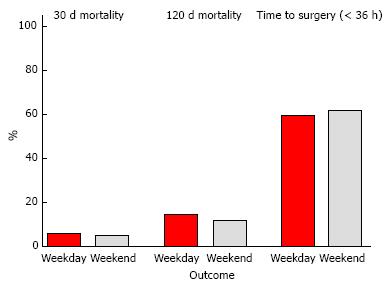
Figure 1 There was no significant difference in time-to-surgery < 36 h (P = 0.
975) 30-d mortality (P = 0.842) or 120-d mortality (P = 0.425) between acute hip fracture patients admitted on weekdays (red bars) vs weekends (grey bars). All P-values derived from logistic regression model.
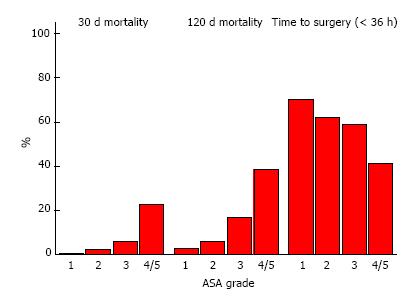
Figure 2 American Society of Anesthesiologist grade of patients admitted with hip fracture had a significant effect on 30-d mortality (P < 0.
001), 120-d mortality (P < 0.001) and time to surgery (P = 0.001). As ASA increased, the mortality rate at 30- and 120-d increased, whilst the percentage of patients undergoing surgery within 36 h decreased. Percentages are expressed as means. All P-values derived from logistic regression model. ASA: American Society of Anesthesiologist.
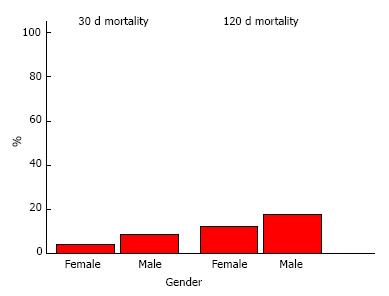
Figure 3 Gender of patients admitted with acute hip fracture had a significant influence on 30-d mortality (P = 0.
028) and 120-d mortality (P = 0.011), with males having an increased risk of death at the two time cut-offs. Percentages are expressed as means. All P-values derived from logistic regression model.
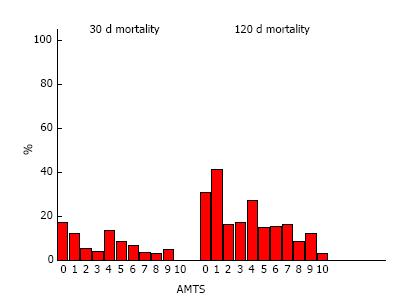
Figure 4 As Abbreviated Mental Test Score increased, 30-d mortality (P = 0.
041) and 120-d mortality (P = 0.001) decreased in patients admitted with acute hip fracture. Percentages expressed as means. All P-values derived from logistic regression model. AMTS: Abbreviated Mental Test Score.
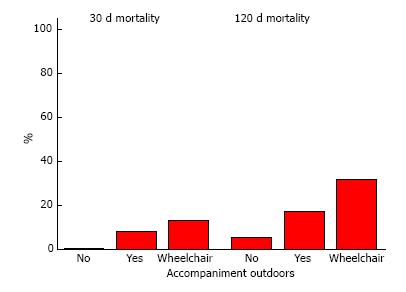
Figure 5 Requirement for accompaniment outside in hip fracture patients significantly influenced 30-d (P = 0.
033) and 120-d mortality (P = 0.033). At 30 d, patients who are wheelchair bound, bedbound or do not go outside have a higher risk of death than those requiring no accompaniment outdoors, at 30 d and 120 d. In addition, patients requiring accompaniment outdoors have a higher at 30-d mortality than those who do not (P = 0.015), but this difference is abolished by 120 d (P = 0.423). Percentages are expressed as mean. All P-values derived from logistic regression model.
- Citation: Mathews JA, Vindlacheruvu M, Khanduja V. Is there a weekend effect in hip fracture patients presenting to a United Kingdom teaching hospital? World J Orthop 2016; 7(10): 678-686
- URL: https://www.wjgnet.com/2218-5836/full/v7/i10/678.htm
- DOI: https://dx.doi.org/10.5312/wjo.v7.i10.678


